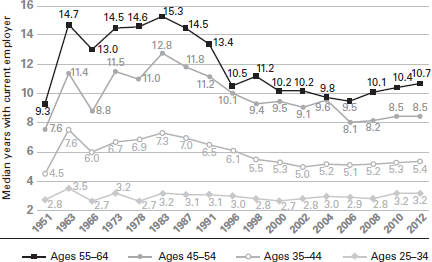
Figure 3.1 Male prime-age (25–64) workers’ median tenure trends, by age (1951–2012)

Source: Data (for 1951, 1963, 1966, 1973 and 1978) from the Monthly Labor Review (September 1952, October 1963, January 1967, December 1974 and December 1979) and from press releases (for 1983, 1987, 1991, 1996, 1998, 2000, 2002, 2004, 2006, 2008, 2010, and 2012) from the US Department for Labor, Bureau of Labor Statistics
Between the ages of 25 and 44, the average tenure is between three and seven years. If we take the mid-point as five years, then we can say the average staff turnover is 20 per cent per annum. Workplace relationships are shortening. This might be because employees are not as loyal to employers or vice versa.
The same, though, is true for the share of people living in ‘unpartnered’ relationships. Figure 3.2 shows the rise of those in the United States, split into age group, over a 10-year period from 2007 to 2017. It is the graph of an atomizing society with more fluid and shorter relationships.