The preceding chapters unveiled the physics basis for phenomena and concepts that traditionally are not acknowledged in physics: freedom to change, evolution, design, complexity, life, performance, economies of scale, diminishing returns, innovation, and social organization. These concepts constitute a new body of knowledge.
When the knowledge develops faster than the language, the new is often described in ad hoc terms that vary from one author to the next. In time, the language catches up by zeroing in on the fewest new terms and rules that govern the new domain. This becomes the new discipline. When this state is reached, the new body of knowledge is more powerful, more applicable, and easier to pass on to new generations.
Well-known examples of disciplines are geometry, mechanics, and thermodynamics. The noun discipline is not to be confused with “disciplined,” although the two words apply to the scientist who knows the disciplines, the most crispy fundamentals, not the noise. As we will see, there is no contradiction between freedom and reliance on discipline. On the contrary, the scientist who possesses the disciplines is the most free to venture into new territories of knowledge. Why, because that scientist’s confidence is justified by the well-tested reliability of the disciplines.
This chapter continues where the previous left off. To find its discipline, the science of complexity can benefit from the example set by thermodynamics, which is a discipline with unambiguous words, rules, and principles. Changing the meaning of the words in mid-course to benefit a narrative, opinion, or political objective is not allowed. Complexity and, more generally, organization and evolution in nature are most powerful and useful when pursued as a discipline.
The science of form began with geometry. I take the reader back to the birth of geometry 2,500 years ago, when the rules for expressing your reasoning (your argument that you are right) by making drawings were extremely few and very precise. While arguing, you were allowed to use nothing more than a straight edge (a ruler) and a compass. The straight edge was for drawing straight lines. The compass was for recording the distance between two points, and for drawing arcs of circles.
The fewer the rules, the more unforgiving the discipline, and the more lasting the reasoning, the proof of the truth, the theorem, and the image (the drawing). No hand-waving allowed, just the graphic construction with two tools available to even the poorest participant in the discussion (homework problem: how could the poorest person build a compass?).
Drawing cannot be displaced by photography. You can draw what you see and what appears in your mind in the dark of the night. You can photograph only what you see. That's the difference between man and machine, and why new machines (artifacts such as AI) cannot displace the human and machine species.
Compare the straight edge and compass with the wealth of drafting instruments available in modern times: templates of many shapes and sizes, triangular, elliptical, French curves, protractors, right angles, 60° angles, 30° angles, and drafting tables fitted with mechanisms that enable the straight edge to sweep the table while remaining parallel to itself. None of these is allowed in the discipline of proving truths with drawings. These tools were not available when the discipline was born.
As an aside, a reader asked, “Does anyone use these instruments any more in the age of the computer?” That’s like asking does anyone use paint, brush, and pencil anymore in the age of photography? Sure, the old instruments are still used by those who hear the calling of their imagination and creativity. You are a lot more likely to know a painter who can take photographs than a photographer who can paint or draw. You are a lot more likely to find a graphic artist who can make computer drawings than a computer user who can draw by hand. Furthermore, you can be certain that the computer user is totally unaware of the principles and disciplines that underpin the graphics software of the computer: geometry, perspective, analytical geometry, and descriptive geometry.
Compared with the advanced person who uses modern equipment, the thinker with straight edge and compass may strike us as backward, or prehistoric. This impression is false and damaging to education. The person who learns to use the ancient tools is equipping himself or herself with discipline: how to think most simply and directly, how to deliver the coup de grâce while arguing scientifically, how to disarm the skeptic, and how to design even better modern instruments for the graphics needed today.
The thinker who returns to the minimum number of rules of the discipline runs against the fashion that pervades through high school and higher education, the legacy of which is today’s knowledge “industry.” In mathematics, reliance on the pocket calculator for everything from addition to calculating an integral has done irreparable damage. In thermodynamics, reliance on software packages has created the illusion that the teaching is now more effective, when in fact very few learn the discipline that underpins the phenomena, the laws, and the software of thermodynamics.
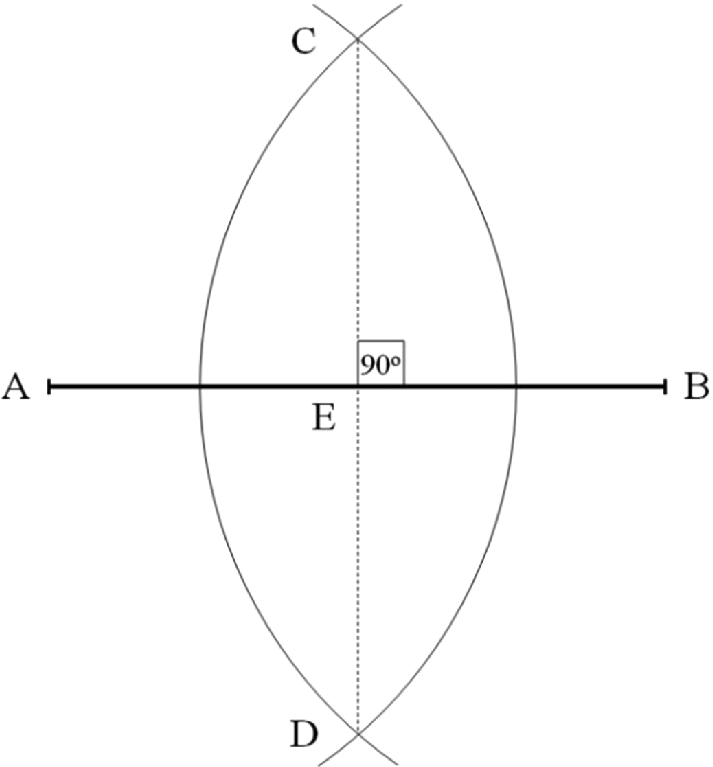
How to divide a segment in half, and how to draw a 90° angle, while using nothing but a ruler and a compass
Use the ruler to draw the segment  . With the compass needle at A, draw the arc of a circle with radius a little smaller than
  . Move the compass needle to B, and draw a second arc with the same radius as the first arc. The two arcs intersect at two points, C and D, which define the line of symmetry of the construction. The segment
  is perpendicular to the segment
  , and it divides the segment in half. Use the ruler to connect C with D, and discover that
  cuts the segment
  exactly in half, at point E.
An additional feature that results from this construction is the right angle, which is evident at the intersection between CD and AB. Often, the right angle is symbolized as a small square at the intersection—a square, because the square fits snuggly in that corner.
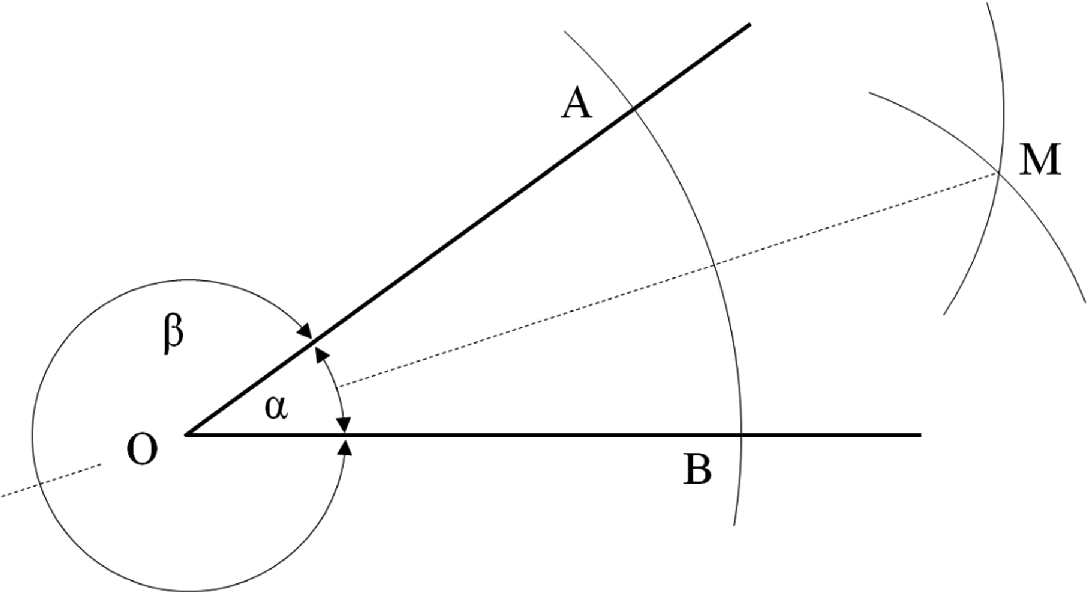
How to divide an angle in half
By repeating the construction of Fig. 7.2, we have the ability to discover all the subsequent angle fractions (α/4, α/8, …) by using only a ruler and a compass. If the given angle is obtuse, for example, β in Fig. 7.2, the construction is the same as for α, because the bisector of the angle α is the same as the bisector of the angle  .
.
 into any number of equal segments, for example, five. Draw the arbitrary line
  at an angle comparable with 45° relative to the given segment. With the compass, mark the arbitrary distance
  on this auxiliary line, and repeat marking this distance five times in the direction from A to C. The fifth mark is the point D. Connect D with B, and recognize the triangle ADB, where the side
  has been cut by you in five equal segments. From the remaining marks such as U, draw the lines that are parallel to
  , and label with 1, 2, 3, and 4 their intersections with the base segment
  . The outcome is that the original segment is cut into five equal segments, because any triangle such as AU1 is similar to the biggest triangle, ADB.
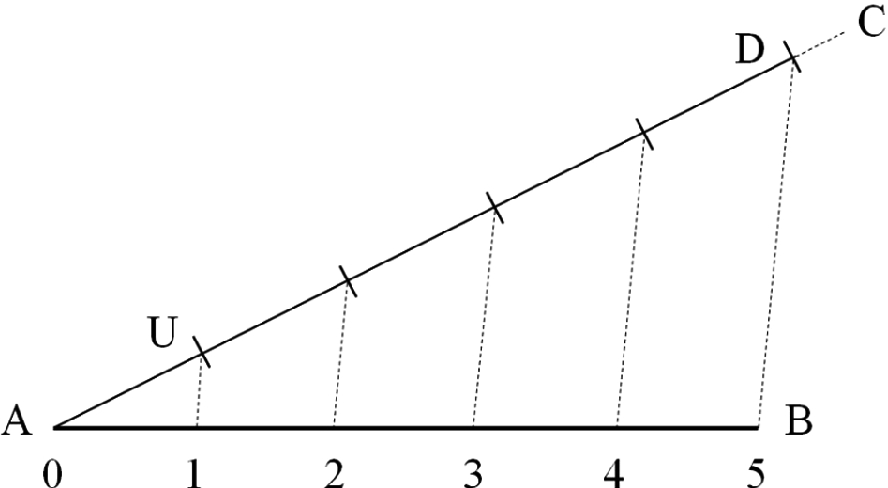
How to divide a segment into any number of equal segments
The segment  is exactly one-fifth of the distance from A to B because you have cut your auxiliary segment
  into exactly five equal segments. The given line was “cut,” which is why the original name for the “cut line” in Latin is linaea abscissa. This construction and its name are the source of the term “abscissa” for the segmented lines that frame routinely the graphs in scientific publications.
If in Fig. 7.3 we mark only two segments of size  in the direction from A to C, the construction yields only one cut on the base segment, and that cut is halfway between A and B. This special case is an alternative to the construction made in Fig. 7.1, and for this reason Fig. 7.3 is a generalization of Fig. 7.1.
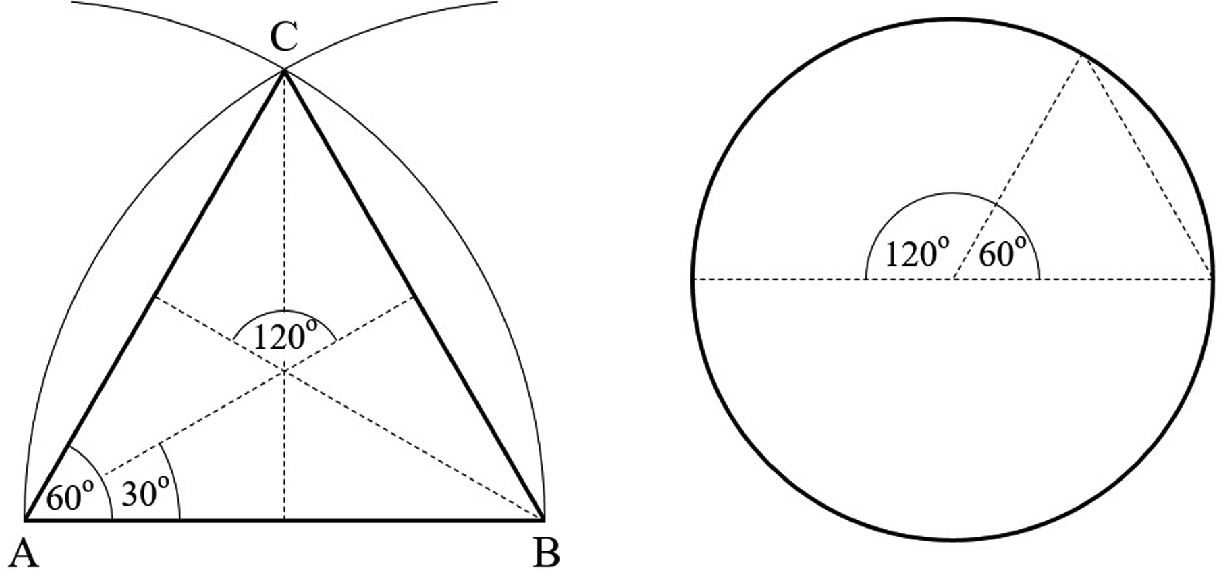
How to draw the 120° and 60° angles, or how to divide a circle into three and six equal arcs
This construction yields two angles, the 60° angle between two sides that touch, and the double of that, which is the 120° angle visible now at the intersection of the bisectors of two of the 60° angles. Delivered by this construction is also the 30° angle, which follows from the 60° angle by using the construction shown in Fig. 7.2. The circle that would be circumscribed to the equilateral triangle turns out to be divided into three equal arcs.
What if the construction must start with the given circle, not with the triangle? In such a case, we first construct the equilateral triangle shown on the right side of Fig. 7.4, which is a repeat of the construction showing on the left side. Alternatively, we measure the 60° angle from the left side of Fig. 7.4 and export that measurement to the circle on the right side of Fig. 7.4. Note the equilateral triangle drawn with dashed line. Two such triangles, adjacent at the center, define the 120° angle that serves to divide the circle into three equal arcs.
 centered at O, and then with the compass we measure the radius
  of a second circle centered at A. With these measurements,
  and
and  , we move over to the new drawing on the right side. We draw the first circle, we mark the point A on the horizontal line, and then we draw the second circle. The intersection of the two circles is point B, which (connected with the tip O) completes the construction of the angle α on the new drawing.
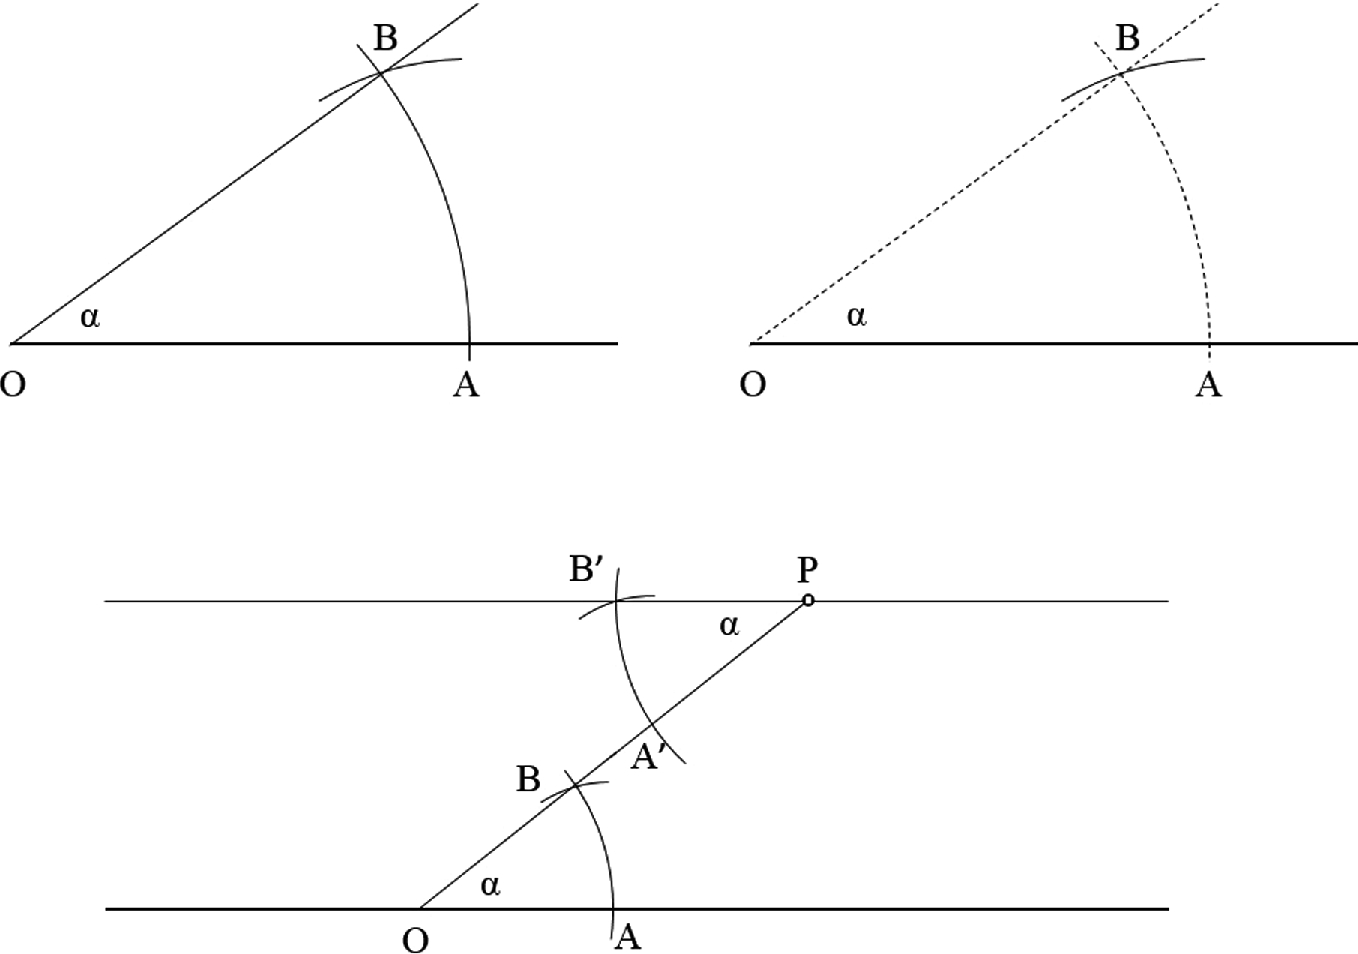
How to measure an angle (α) of an existing drawing (left), to transfer it to a new drawing (right)
Measuring an angle and drawing it somewhere else is the generator of other elemental constructions. For example, the lower half of Fig. 7.5 shows how to draw through any point (P) a line that is parallel to a given line that does not pass through P. The solution is to draw the arbitrarily oblique line PO, which forms the angle α with the original line. Next, we measure α by constructing the triangle AOB, and then we export the angle construction to the top of the oblique line, where P is now the tip of the reproduced angle α. There are only two (both arbitrary) circle radii in this construction, i.e., two measurements, OA = PAʹ and AB = AʹBʹ. This is how we determine the position of Bʹ. The line drawn through P and the new point Bʹ is parallel to the original line, because the original angle α and its reproduction are equal. They are called alternate interior angles.
These simple examples are just the opening pages to an entire history of everything (geometry, architecture, construction) that preceded the modern tools and edifices that are available today. The ruler and the compass are like the ball and the goalposts: while the shirts, shoes, balls, and stadiums become better and more expensive, the game remains the same.

The three-dimensional architecture of electrical conductors and liquid helium channels in the long section of the superconducting winding mounted on the rotor of an electric power generator. Helium flows in all directions, longitudinally, radially, and circumferentially
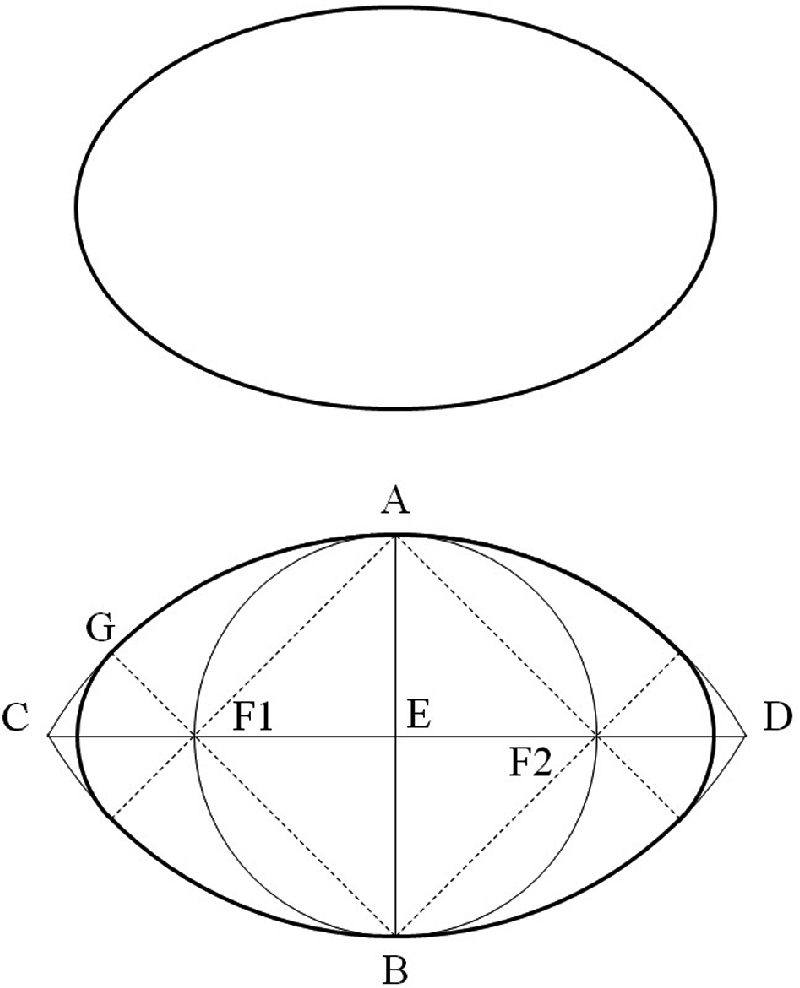
How to draw an ellipse with a ruler and a compass. The upper ellipse is exact, the lower is approximate. Can you see a difference between the two?
Key is the observation that the long axis cuts the ellipse at its equatorial latitude where the radius of curvature of the ellipse is small. The short axis cuts the ellipse at the poles, where the radius of curvature of the elliptical shape is large. Two radii of curvature, one small and the other large, are the hint that the elliptical shape can be drawn approximately with just one compass by making two kinds of circles, one smaller than the other.
The bottom half of Fig. 7.7 shows how. First, on a blank page draw vertically the short axis, from A to B. With the compass needle at A, draw the large arc of radius  . Repeat this with the compass needle at B. The drawing begins to look like the human eye, or like the ball used in American football. The two large arcs intersect at C and D. The line
  cuts the short axis in half, at point E, cf. Fig. 7.1. This line is collinear with the long axis of the approximate ellipse that we are constructing.
The next challenge is to find the approximate locations of the two foci. These would have to be to the left and right of E. Possible locations are the equatorial points (F1, F2) obtained by intersecting  with the circle of diameter
  .
.
The auxiliary lines connecting A with F1 and B with F1 are perpendicular to each other, and, consequently, the small circle of radius  is tangent at G to the big circle of radius
  , which is equal to
  . The two small arcs centered at F1 and F2 complete the construction that I used multiple times in making Fig. 7.6. The resulting ellipse is smooth because of the continuity of slope at the points of tangency, G. The shape (the slenderness) of this particular ellipse is such that the long axis exceeds by 59% the short axis.

Ellipses, in a drawing of two convex surfaces (two rollers) touching at one point
The evolving designs of nature are surprisingly organized such that their essential features can be summarized by geometric constructions that relate them to the size of the flowing system. With the constructal law, such formulas are predicted, not observed. Predicted formulas are not models. They are theory, not empiricism [3, 4]. Each formula is called a “power law” because it has the form Y = aXb, where Y is the essential feature of the flow architecture (for example, animal speed, animal organ, or airplane engine size), and X is the body size (volume, mass, weight, body length). The factor a and the exponent b are such that the formula matches approximately the (X, Y) measurements of the architectures that abound in nature.
The formula Y = aXb is a power law because the argument X is raised to a power, b. Many authors mistakenly call Y = aXb an “exponential,” because of the exponent b. The mistake is that in an exponential function Y(X) the argument X appears in the exponent, this way: Y = a · bX.
With few exceptions, the exponent b in Y = aXb is less than 1, and the corresponding X versus Y relation is named allometric. One example is b = 1/6, which was predicted for the relations between animal speed (flying, running, swimming) and body mass [5]. Fewer are the relations with b = 1, as the relation between jet engine size and airplane weight, and the relation between wingspan and fuselage length [6]. The power law with b = 1 is called isometric (which means equal measure, from Greek), because doubling X is reflected in the doubling of Y. On the other hand, when the exponent b is smaller than 1, the doubling of X leads to a smaller increase in Y. This is why power law relations with b smaller than 1 are called allometric (from allo, which in Greek means departure from the normal). We may regard the isometric relations as special cases of the more general class, which is allometric.
Why am I telling you this, in a chapter on geometric constructions, other than for the big reason that nature is a weave of freely evolving flow architectures that are represented by relatively simple drawings that form their own discipline, the science of form? The subtle reason is that when plotted in linear cartesian coordinates (with equidistant ticks in both directions) the allometric relation Y versus X is a curve, which is concave when b is smaller than 1. Curves are harder to draw than straight lines and even harder to remember as being distinct from other curves.
Consequently, the preferred representation of an allometric relation Y = aXb is in a cartesian frame where the tics along X and Y correspond to log(X) and log(Y). This representation is more useful because on a cartesian plot with log(X) on the abscissa and log(Y) on the ordinate the allometric relation becomes linear, namely, log(Y) = log(a) + b log(X), and is represented by a straight line. The slope of the line is b, and log(a) is a constant.
Lines on log–log graphs are easy to draw, compare, and remember. Before making such a graph, however, one must have at his disposal an abscissa and an ordinate with the tics scribed according to log(X) and log(Y), not X and Y. One must find some log–log graph paper. This is easy today because log–log paper is available in modern bookstores along with the other tools for the knowledge industry. The construction I teach next is how to scribe your own log–log axes when you do not have access to the store, and when you are a professor who likes to draw log–log axes correctly with chalk on the blackboard.
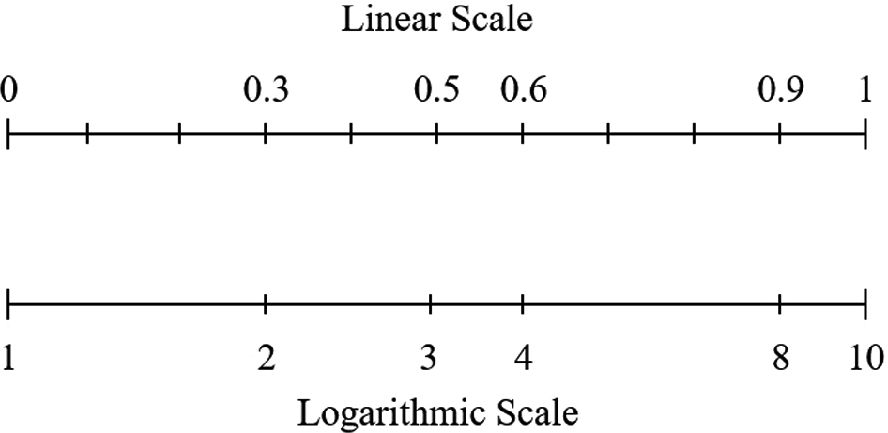
How to construct by hand your own logarithmic scale
The logarithm of 1 is zero; therefore, the left extremity of the logarithmic abscissa is labeled 1.
The logarithm of 10 in base 10 is 1; therefore, the right extremity of the logarithmic abscissa is labeled 10.
The log of 3 is 0.48; therefore, the middle of your new logarithmic abscissa corresponds approximately to 3.
The log of 4 is 0.6; therefore, under the 0.6 of the linear abscissa, you write 4 on the logarithmic abscissa.
The log of 8 is 0.9; therefore, under the 0.9 of the linear abscissa, you write 8 on the logarithmic version.
The mark for log(2) is exactly halfway between 1 and 4 on the log scale. Note that on the logarithmic scale the marks 1, 2, 4, and 8 are equidistant (homework problem: why?).
With all these tics on the new abscissa, it is easy to guess where the missing tics would fall. For example, 2 will fall between 1 and 3, closer to 3. Furthermore, 5 will fall to the right of 4, and the distance from 4 to 5 must be shorter than from 3 to 4. The tics become denser near the right end of the segment, and the denser they are the less important it is to distinguish between adjacent tics, such as between log(8) and log(9).
Now we begin to see why the discipline of geometric constructions that predate computers are essential, empowering, and liberating, especially for academics who are also scientists. This old knowledge helps us see the correct drawing in our imagination. It also helps us make a correct drawing with chalk on the blackboard, and with pencil on paper. This knowledge also empowers us to call out those scientists who are less than truthful with their graphics.
- 1.
Define your system: Identify clearly and unambiguously what “system” you are talking about. What constitutes your system? Start with the definition of “system.” The system is the region in space, or the amount of mass, that is the subject of your thinking, analysis, and design. The system is yours. The system belongs to the observer. The system is part of you. Everything else is the environment, the surroundings, the rest of the world.
- 2.
Identify the flows: Make sure your system has the freedom to change, and that you understand “what flows” within it, i.e., why your system is a “flow system,” and why it has freedom.
- 3.
Start simple: Allow only one feature of your system to change at first. This endows your system with one degree of freedom. Study if and how the changes to this feature increase the flow access of the currents that inhabit your system. Incorporate into your design the first feature with which you found that your system performs best (be alert, this is not the end!).
- 4.
Add a degree of freedom: Allow a second feature of your system to change freely. As you investigate this second degree of freedom, you will find another “best” feature, and you adopt it. With this second feature in place, go back to step 3 and refine that first feature to work with the second.
- 5.
And another…: Allow a third feature to vary freely, find the best variant of this feature, and then go back and repeat steps 3 and 4, i.e., refine the preceding two features.
- 6.
And so on: This is a dynamic construction with no end, except the finite time and life of the thinker.
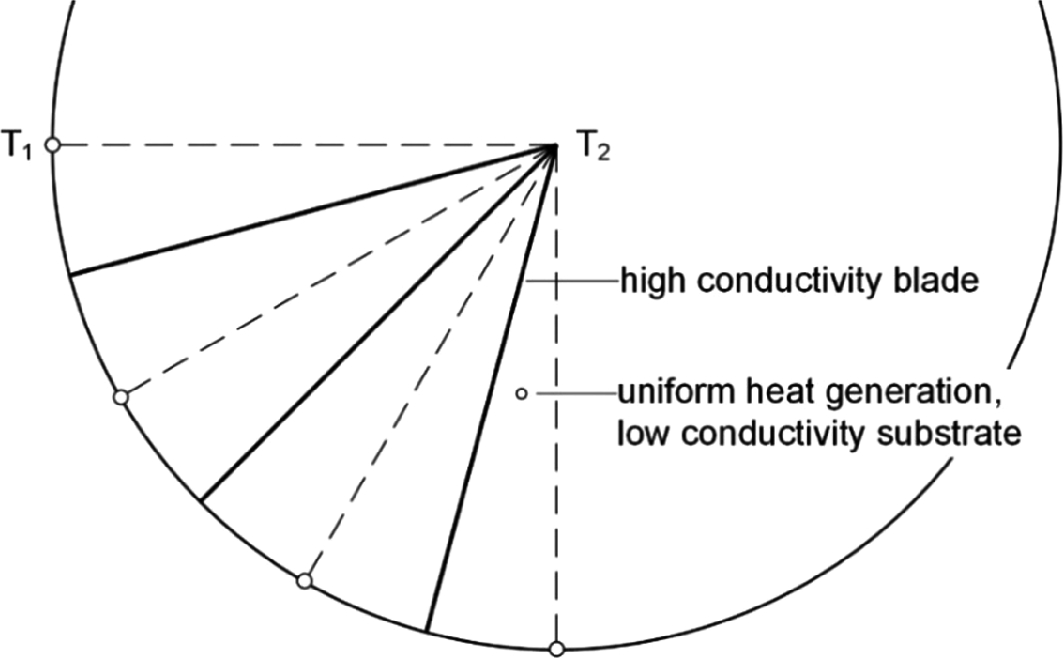
The flow of heat out of a pizza-shaped body is facilitated by inserting several radial blades with high thermal conductivity. The evolutionary design of this heat flow architecture proceeds toward pizza slices that have a certain shape, which means that the whole pizza should have a particular number of slices
In evolutionary changes toward easier heat flow, the high-conductivity material is more valuable than the low-conductivity materials. This is why the high-conductivity material is expensive, and why only a fraction of the volume can be allocated to it. The object consists of just two materials, in fixed proportions, but these materials are not “mixed.” They are unlike two metals in an alloy. The two materials are organized such that heat is conducted easier through the whole object. The object has configuration, contrast, and drawing. The less expensive material is the background on which the expensive lines are painted.
In the evolution of technology, the sequence of steps 1–6 happens naturally but slowly, in haphazard bursts of individual creativity. Usually, one step (one degree of freedom) represents a single invention, such as Traian Vuia’s use of air-tube tires on the first airplanes more than one century ago. With the new discipline of the physics of form, today industries can fast-forward the design evolution of their technologies and reduce trial and error. In the remaining chapters, we explore the benefits and freedom that come from discipline.