Chapter 4
Key Drivers of the Real Estate Cycle
Information is the oxygen of the modern age.
—Ronald Reagan
Key drivers are market factors that propel the real estate market through the various phases of the real estate cycle. They can be divided into three categories—demographic, financial and emotional—and they encompass market realities that directly influence supply and demand, such as net migration, vacancy rates and real estate affordability.
It's important to acknowledge that key drivers do not necessarily generate similar market responses. Some key drivers are volatile and can rapidly drive the real estate cycle through its phases. When stable key drivers are at work, a real estate cycle can remain in a particular phase or stage for a longer period of time.
For example, sudden demographic changes, such as population growth, can quickly increase demand for real estate and generate a sudden change in the cycle.
Key drivers resulting from financial changes, such as an increase in the level of rents, have an impact on the financial viability of real estate investments, but may not signal an immediate shift in the cycle's progression. However, a change in the number of days it takes to sell real estate can induce panic buying that is driven by a fear of missing out on the wave of capital growth seen during the boom phase of the real estate cycle.
A Collective Response
It is important to understand that the key drivers we identify here propel the real estate cycle collectively rather than individually. In this way, key drivers operate like a combination lock. Rather than requiring a single key to unlock the door to the next phase, the correct combination of several drivers is needed. Having one or two parts of the combination will not unlock the door, and the movement of one or two key drivers alone sometimes has little impact on the real estate cycle.
 Cycle Secret
The combined effect of various key driver activities can quickly thrust the real estate cycle through one phase and into the next, but no single key driver can propel the real estate cycle through a complete phase.
Demographic Drivers: Demographic key drivers determine the level of physical demand for real estate. They include such things as net migration, employment levels, the number of first-time homebuyers, vacancy rates of rental real estate and the scale of housing construction.
Financial Drivers: Financial key drivers relate to the financial viability of real estate, either as an investment vehicle or for owner occupation. They include rental levels, return on investment, income levels, rental affordability, real estate affordability, financing availability and real estate values.
Emotional Drivers: Emotional key drivers have an impact on confidence in real estate as a sound investment, and they have a powerful influence on the psychological reasons that people buy real estate. These drivers include the average number of days it takes to sell real estate, the number of listings of real estate for sale, sales levels and revitalization (upgrading of amenities, facilities and/or real estate).
• • • •
These three categories of key drivers collectively create momentum that affects the progression of the real estate cycle as it passes through one phase and on to the next.
Each key driver follows a similar pattern. For example, return on investment will increase over time and reach a peak (just before it is about to start declining). After that, returns will decrease until they bottom out (just before they are about to start increasing again).
This pattern can be compared to Earth's daily 24-hour rotation, and the key drivers will follow the pattern below:
| Increasing | = | Sunrise |
| Peak | = | Midday |
| Decreasing | = | Sunset |
| Trough | = | Midnight |
The Trass methodology of studying cycles shows that when considering each of the key drivers in light of the real estate cycle, the key driver patterns typically occur within specific phases of the real estate cycle. This helps to identify the market's position in the real estate cycle at any given time.
In terms of the return on investment, that pattern looks like this:
Return on Investment
| Direction | Real Estate Cycle Phase |
| Increasing | End of slump to mid-recovery |
| Peak | Mid-recovery |
| Decreasing | End of recovery to mid-slump |
| Trough | Mid-slump to end of slump |
 Cycle Secret
To use the real estate cycle to your advantage, you must understand the key drivers' patterns. These patterns help you determine which phase a market is at in the real estate cycle.
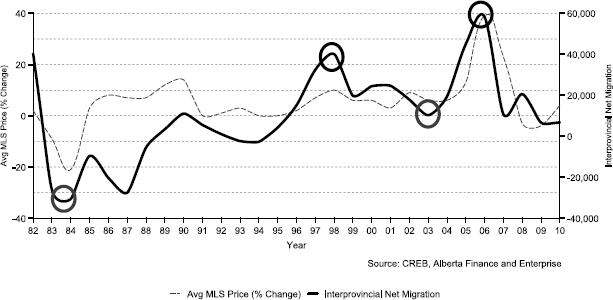
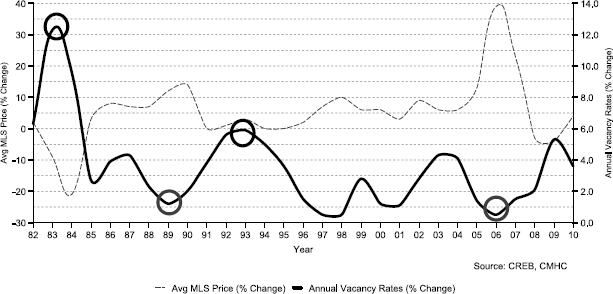
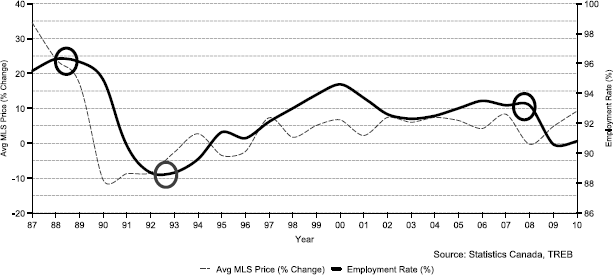
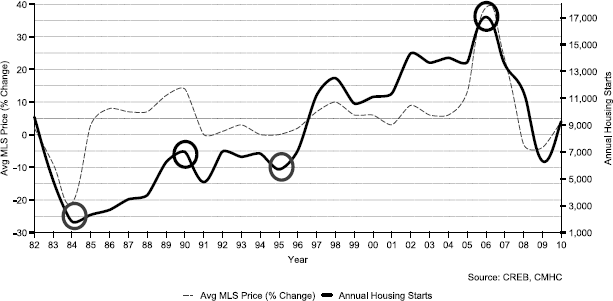
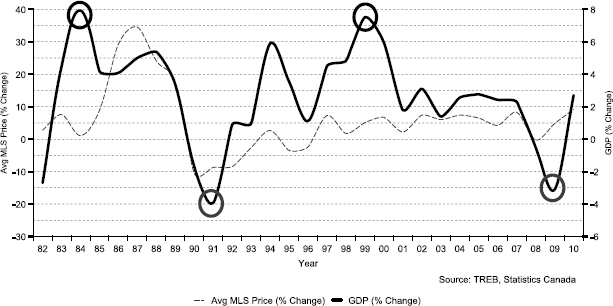
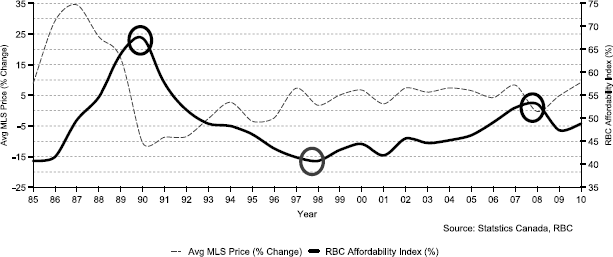
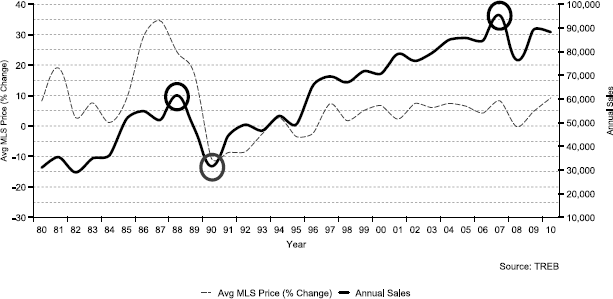
The following graphs depict key driver patterns in action. In each graph, the thin dotted line represents the annualized house price percentage change. The solid line represents the annualized change in the key driver. Each peak is highlighted with a black circle and each trough is highlighted with a grey circle.
Demographic Drivers
Net Migration or Population Change
(Immigrants plus number of births) less (emigrants plus number of deaths).
Net migration or population change results in either an increasing or a decreasing population. Population changes can often be rapid, causing a sudden surge or drop in demand. A sudden increase in population, usually in the form of net migration, can result in strong growth in rental levels as additional properties cannot be supplied quickly. Population growth typically peaks during the middle of the boom phase and reaches a trough in the middle to end of the slump phase. (See graph 4.1 on next page.)
Graph 4.1: Alberta Net Interprovincial Migration and Calgary Housing Price (% Change), 1982–2010
Residential Vacancy Rates
The number of vacant residential properties available to rent divided by the total number of properties.
Vacancy rates will trough during a recovery phase and peak during a slump phase. (See graph 4.2 on next page.)
Graph 4.2: Calgary Annual Vacancy Rate and Calgary Housing Price (% Change), 1982–2010
Employment Levels
The percentage of employable people who are actually employed.
High employment levels usually bring upward pressure on incomes, which offers enhanced affordability of real estate or an opportunity to pay higher rents. Conversely, low employment levels will result in static incomes, making real estate and rent less affordable. Employment levels will peak from midway to the end of a boom phase and drop from midway to the end of a slump phase (see graph 4.3).
Graph 4.3: Toronto Employment and Toronto Housing Price (% Change), 1987–2010
Housing Construction
The number of new houses being constructed.
Construction tends to lag behind any increased demand for real estate due to the significant lead time required to build. This lag can, and usually does, result in an eventual oversupply of real estate, long after the actual demand for additional properties has dissipated. Construction levels peak at the end of the boom phase and trough from midway through to the end of the slump phase.
Graph 4.4: Calgary Annual Housing Starts and Calgary Housing Price (% Change), 1982–2010
First-Time Homebuyers
The percentage of total sales that are to first-time homebuyers.
First-time homebuyers are an essential segment of a real estate market. They are the catalyst that allows everyone else to move up. The percentage of total sales to first-time homebuyers peaks in the middle of the boom phase and reaches a trough near the end of the slump phase.
Financial Drivers
Gross Return on Investment (ROI)
Gross annual rental income (based on market rates) divided by the market value of the real estate.
Investment funds are fickle when it comes to the direction in which they flow, and investment opportunities other than real estate will continually be compared to returns being achieved on real estate investments. Investment funds often flow toward the highest available returns from the choices of real estate, shares, bonds and bank deposits. The ROI of real estate tends to peak during the recovery phase and reach a trough during the early stages of the slump phase.
Average Rents
Average levels of rental prices.
Rent levels typically overcompensate for increased demand during a boom phase and reach unsustainably high levels. They also overcompensate for decreased demand during the slump phase and reach very low levels. Rents will peak near the middle of a boom phase and trough near the middle of a slump phase.
Graph 4.5: Calgary Rents (% Change) and Calgary Housing Price (% Change), 1984–2010
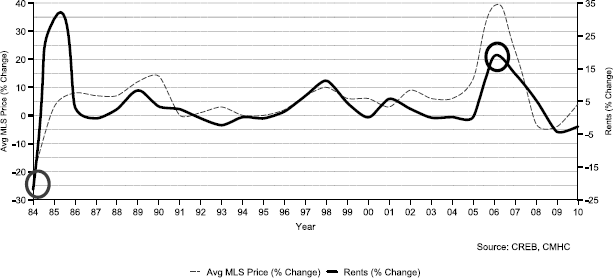
In rent-controlled regions it is important to use “market rent” numbers rather than average rents in order to get a more accurate picture. Average rents will be skewed lower and less volatile in rent control regions.
Average Incomes
Average incomes before tax.
Incomes assist with the affordability of rental prices and real estate ownership. Income growth will peak near the end of the boom phase and hit its trough near the end of the slump phase.
The Availability of Financing
The ease or difficulty of obtaining financing for real estate purchases.
The availability of money and the willingness of lenders to put money in the hands of investors are subject to their own cycles. Financing is more readily available during a boom phase and less so during a slump phase.
Gross Domestic Product (GDP)
Gross domestic product (GDP) is a measure of a region's output and is based on the market value of goods and services produced.
Real estate and associated products and services make a significant contribution to a country's GDP, which tends to peak in the recovery or early boom phase and reach a trough in the middle of the slump phase. That said, when assessing a market it is important to look at the regional (municipal and provincial) GDP numbers.
Real Estate Values
Market value based on a willing buyer and willing seller.
Like rents, real estate values typically overcompensate for increased demand at the end of the boom and early in the slump, when they reach unsustainably high levels. They also overcompensate for decreased demand during the slump. Values will typically peak at the end of the boom phase, or early in the slump phase. Depending on the state of the key drivers, it is not uncommon to see another drop in values near the end of the slump.
Graph 4.6: Ontario GDP (% Change) and Toronto Housing Price (% Change), 1982–2010
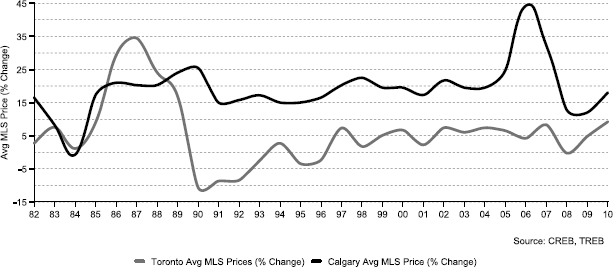
Graph 4.7: Toronto Housing Price (% Change) and Calgary Housing Price (% Change), 1982–2010
Real Estate Affordability
The measure of how affordable it is to own or invest in real estate.
Affordability is impacted by several factors including ease of borrowing, interest rates, income levels and rental levels, which all affect borrowers' borrowing capacity. Real estate becomes least affordable during the beginning of the slump phase and most affordable during the recovery phase.
Graph 4.8 below uses the RBC Affordability Index to illustrate the relationship between real estate values and affordability. It should be noted that as the index goes up, affordability goes down.
Graph 4.8: RBC Affordability Index and Toronto Housing Price (% Change), 1985–2010
Emotional Drivers
Number of Days It Takes to Sell Real Estate
How many days it takes to sell from the date of listing real estate for sale.
This key driver can influence the levels of fear experienced by potential real estate buyers during the boom and by vendors during the slump. For example, during a boom phase, potential buyers fear that if they do not make a quick decision, they may miss out on the wave of capital growth in values as properties are selling rapidly. During a slump phase, vendors fear that if they do not place a realistic price on their real estate, it may take a long time to secure a sale. The number of days to sell peaks at the end of the slump phase and troughs from midway to the end of the boom phase.
Revitalization and Renewal
The upgrading of properties, amenities or services in a specific location.
Revitalization is prolific at the end of a boom phase when many people utilize their increased equity (as a result of the boom) to finance the refurbishment of real estate in an attempt to further increase its value or boost rental income. Revitalization can create powerful emotions in purchasers and motivate them to pay a premium for properties that are upgraded to a superior standard. Revitalization hits its lowest point at the beginning of the recovery phase.
Real Estate Listings
The number of properties available for sale (or listed for sale with real estate agents).
In contrast to sales volumes, real estate listings will peak during the slump phase as the supply of real estate exceeds demand. Listings will reach their lowest point during the boom phase when properties are selling rapidly. This key driver, like the number of days it takes to sell real estate, can cause potential real estate buyers to fear that they may miss out on the wave of capital growth during the boom phase of the real estate cycle. During the slump phase, vendors fear that if they do not put a realistic price on their real estate, it may take a long time to sell due to the high number of listings during this phase.
Vendors are only too aware of how to make their real estate more marketable to the few purchasers in the market during the slump. This is why they discount their selling price significantly at this point in the slump.
Real Estate Sales Volumes
The number of real estate sales.
Sales volumes will peak near the end of the boom phase and hit their lowest point near the end of the slump phase. During the boom phase, inexperienced investors become aware of the high level of sales and fear they may be missing out because so many other investors are buying so much real estate. During the slump phase, many investors are fearful of the low level of sales, as they realize that real estate is no longer an asset that can be quickly realized if they need to sell.
As long as regulations do not change making it easier or more difficult to list properties, year-over-year comparisons remain true. The recent Canadian Real Estate Association/Competition Bureau settlement will make it more difficult to accurately compare numbers.
Graph 4.9: Toronto Sales and Toronto Housing Price (% Change), 1980–2010
Key Drivers Propel the Cycle Forward
Regardless of where you begin, the real estate cycle always progresses in the same way. That is, a slump always follows a boom, a boom always follows a recovery, and a recovery is always sandwiched between the slump that comes before it and the boom that follows. Each of these phases include a beginning, middle and end stage. Phases and stages are propelled by key drivers. Key drivers tell strategic investors what they can expect in terms of cycle changes. Although some key drivers can act as stabilizing market forces, these drivers never act independently. Their combined impact is what powers the real estate cycle.