Chapter 10
The Toronto Market: Focus on Key Drivers
Let our advance worrying become advance thinking and planning.
—Winston Churchill
Having reviewed historically significant phases of the real estate cycle in Toronto (1989–2003), we can apply the same key driver assessment to the current GTA real estate market. Here, key driver and market influencer data from 2009 and 2010 provide an excellent case study of how the short-term impact of market influencers can cloud the perception of what is actually happening to the cycle.
A Slump Looms
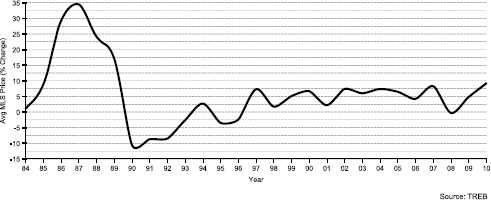
As 2008 was beginning, many of the key drivers in the GTA economy showed signs of moving into the slump phase. By the beginning of 2009, many believed a complete global economic collapse was imminent and the next Great Depression was upon us. Unemployment was rising, and net migration, GDP, incomes, housing starts and incomes were falling rapidly. The grim economic news of the day brought the housing market to its knees. People virtually stopped buying homes. The result, as shown in graph 10.1, was falling values in the GTA heading into 2009. A slump had commenced.
Graph 10.1: GTA Average MLS Price (% Change), 1984–2010
Market Influencers Enter the Fray
Wanting to avoid a U.S.-style meltdown in the real estate sector, the Canadian government looked for demand-creating influencers that would help stimulate the real estate market long enough for the overall economy to recover. The Bank of Canada dropped interest rates to historic lows and kept them there for years.
Around the same time, governments in B.C. and Ontario announced that they would be implementing a harmonized sales tax (HST) on the purchases of new homes effective July 1, 2010. As a result, people scrambled to purchase real estate before the new tax was implemented. These demand-creating influencers combined to stimulate demand for real estate.
Affordability increased quickly thanks to the combined effect of lower home prices and the low–interest rate environment. This led to a surge in real estate sales in the second half of 2009 and throughout most of 2010, resulting in increasing values.
By the first quarter of 2010, as values continued to rise, the government was no longer concerned about a faltering real estate market. Instead, the Bank of Canada became concerned about a real estate bubble, especially in the GTA where there were boom-like conditions. Raising interest rates back to normal levels would have easily cooled off the real estate market. This move was not an option because it would also have resulted in undesirable consequences for many other areas of the economy. Instead, the Bank of Canada made it more difficult for homebuyers to qualify for mortgages. This decision, combined with the implementation of the HST, helped cool things off during the last part of 2010.
This means that the real story of the GTA real estate cycle for 2009 and 2010 was all about government-induced market influencers. It also signals caution for strategic real estate investors, who know that market influencers are short term and can often cloud the perception of the real estate cycle by making it appear as though a transition from phase to phase has begun. In this situation, it is even more critical that strategic real estate investors seek a complete understanding of how the collective key drivers are behaving in the market. That understanding provides the context that a strategic real estate investor needs to determine the exact position of the cycle.
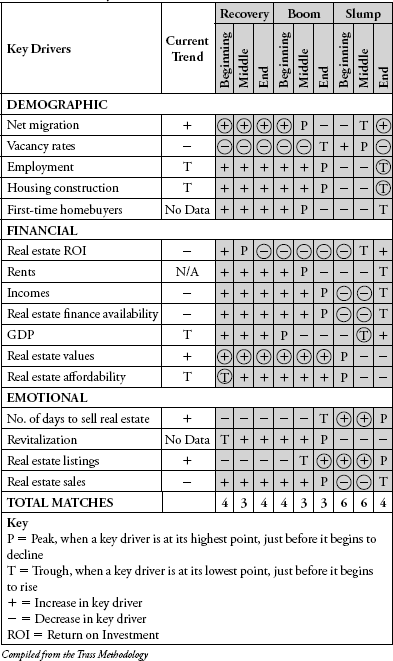
The Key Driver Scorecard on the next page indicates the current trend for each key driver of the real estate cycle in the GTA. Based on the collective summary of the key drivers, the GTA's cycle in 2011 is between the middle and end of the slump phase.
The following section goes into greater detail for each key driver, provides perspective on each key driver's long-term trend and looks at how we expect these drivers to act in 2011.
Key Drivers of the Current Toronto Real Estate Cycle
Net Migration
Net migration tends to peak around the middle of a boom phase in the real estate cycle and trough during the middle of the slump phase. In the GTA's case, as shown in graph 10.2, the peak arrived a bit earlier than typically expected, as did the trough when it hit its lowest point near the end of the boom, in 2007. At that time, net migration in Ontario reached its lowest levels in 20 years.
Graph 10.2: Ontario Net Migration, 1990–2010
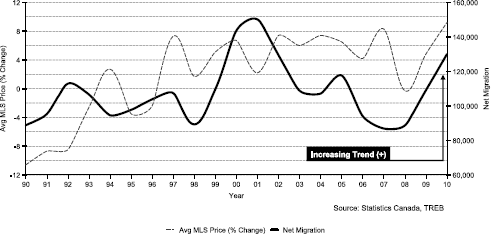
The fact that net migration was slightly out of phase from what we would typically expect has turned out to be a very good thing for the GTA housing market. When the market entered the slump phase and values began to fall in 2009, net migration was already beginning to show early signs of a sustained increasing trend. This added demand for housing helped offset the high supply left over from aggressive building throughout the boom.
Table 10.1: GTA Key Driver Scorecard, Current Trend.
Since net migration is a critical requirement of demand for housing, having a declining trend heading into a recession is usually cause for concern. However, as shown in graph 10.2, since 2007 the trend has been reversed and net migration in Ontario has increased significantly.
In addition to the rise in international migration, interprovincial migration also increased. In fact, in the third quarter of 2010 there was a net surplus in interprovincial migration for the first time in 29 quarters.
Strategic analysis: With Canada's growing global reputation as a destination of choice for immigration, strategic real estate investors can expect net migration from international migration to continue to rise through 2011. In the context of the real estate cycle, the key driver of net migration is lining up with the end of the slump phase and beginning of the recovery phase.
Vacancy Rates
Rental levels typically overcompensate for increased demand during the boom and reach unsustainably high levels. They then overcompensate for decreased demand during the slump and reach very low levels. Therefore, vacancy rates typically plunge at the end of the boom phase and peak during the slump phase. Assessment of this key driver in the GTA is complicated, given the relatively low vacancy rates that have been consistent in the overall GTA for many years. These historically low vacancy rates are due primarily to the high level of immigration that occurs in this region on an annual basis. (This demographic reality creates sustained demand for rental housing as immigrants typically do not buy their own homes until several years after they move to the GTA.) This can be seen in graph 10.3, which shows the GTA vacancy rate has not exceeded 4.5 per cent over the past 25 years.
Graph 10.3: GTA Vacancy Rates, 1985–2010
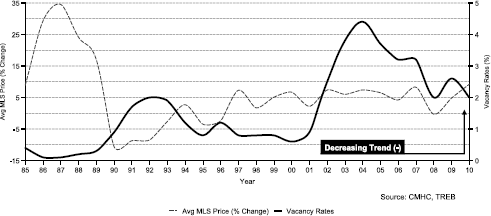
Strategic analysis: Strategic real estate investors expect to see vacancy rates in the GTA trending down throughout 2011. This key driver trend will be supported by fewer renters turning to homeownership, combined with continued strong immigration and an improving labour market.
Employment
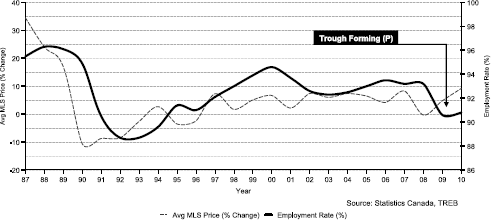
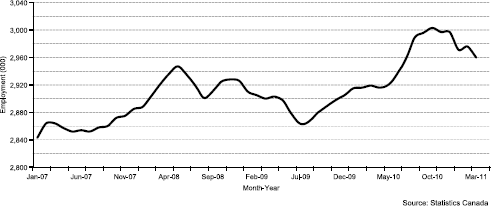
Employment will typically be at its highest levels in the middle to end of the boom phase, and at its lowest around the middle to end of the slump phase. As shown in graph 10.4, employment in the GTA appears to have troughed in 2010. Further evidence of an improving labour market can be seen in employment growth illustrated in graph 10.5, which shows that the number of jobs in the GTA has been increasing since June 2009. In fact, by the end of 2010, the number of people employed in the GTA had surpassed the pre-recession levels.
Graph 10.4: GTA Employment, 1987–2010
Graph 10.5: GTA Employment Growth, June 2007–November 2010
Strategic analysis: Improvement in the financial and manufacturing sectors has contributed to the increasing trend in employment. In the context of the real estate cycle, the key driver of employment is lining up with the end of the slump phase and the beginning of the recovery phase.
Housing Construction
Strategic real estate investors recognize that while housing construction is a key driver, it tends to lag behind any increased demand for housing due to the significant lead time required to build, especially in larger centers where condominium buildings make up the majority of starts. This lag usually results in an eventual oversupply that persists long after the demand for housing dissipates. Therefore, construction levels tend to peak at the end of the boom phase and trough at the middle to end of the slump phase.
Analysis of the GTA real estate cycle shows that housing construction peaked relatively early in the boom in 2003. This occurred because the severe slump from 1990 to 1996 led to significant pent-up demand heading into the current cycle. As a result of that pent-up demand, housing starts surged early—and strongly—in the recent boom. Now, a trough appears to be forming in 2010 and 2011. This is the result of a temporary surge in demand for new housing that has been fuelled by market influencers like low interest rates and people's desire to take possession of new homes before the HST went into effect in July 2010.
Graph 10.6: GTA Housing Starts, 1972–2010
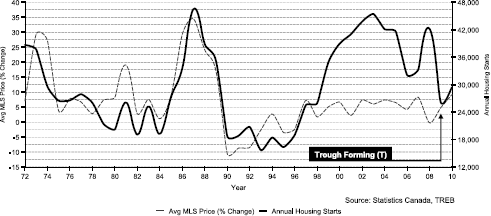
Strategic analysis: For the purposes of our analysis as of the beginning of 2011, strategic real estate investors are identifying a trough for the key driver of housing construction. This is typical during the middle to end of a slump phase.
Rents
Rental amounts tend to peak near the middle of the boom phase and trough near the middle of the slump phase. This is skewed in the GTA, where rent controls are in place. These controls impede the free-market supply and demand fundamentals. That is why “market rents” are more accurate in rent control areas rather than posted “average rents.”
Strategic analysis: Because rent controls are in place in the GTA real estate market, this key driver is of limited use in the assessment of the GTA real estate cycle.
Incomes
The rate of income growth typically peaks near the end of the boom phase and hits a statistical trough near the end of the slump phase. As shown in graph 10.7, this has been fairly consistent with the GTA cycle where income growth has been steadily declining since reaching its peak near the end of the boom in 2008.
Graph 10.7: GTA Average Hourly Wages (% Change), 1998–2010
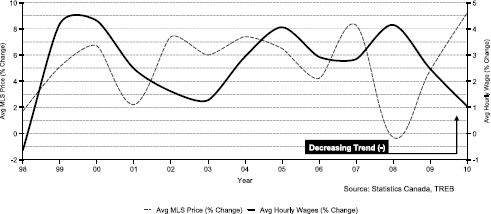
Strategic analysis: As long as the employment rate continues to rise, this key driver will eventually put upward pressure on wages. For the time being, the rate of income growth is experiencing a downward trend, consistent with the beginning to middle of the slump phase.
Gross Domestic Product (GDP)
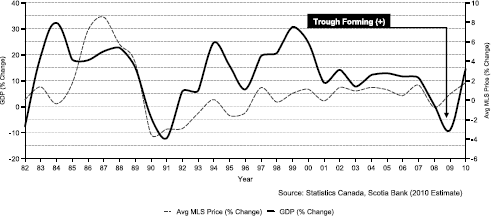
GDP is the measure of a region's output and is based on the market value of goods and services produced. As such, it is one of the most important economic indicators because it provides the sum of all economic activity. In the context of the real estate cycle, GDP growth tends to peak in the recovery phase and trough in the beginning of the slump phase.
Strategic analysis: In the GTA's case, GDP growth peaked in 1999, just as the recovery was ending and the boom phase was beginning. Since then, it reached a trough in 2010. That low point is expected during the beginning of the slump phase. Toronto's GDP growth is expected to increase to 3.5% in 2011.
Graph 10.8: Ontario GDP Growth, 1982–2010
Real Estate Affordability
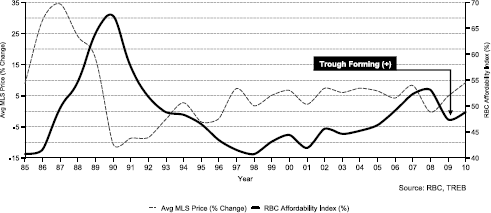
Housing affordability is a measure of how affordable it is to own a house. Affordability is affected by several factors, including finance availability, interest rates, income levels, housing costs and other homeownership costs such as taxes and utilities. Typically, housing becomes least affordable during the beginning of the slump phase and most affordable during the recovery phase. This lack of affordability is indicated by a higher “affordability index,” which is the percentage of annual wages you will spend to buy a house.
In the GTA's case, the affordability index reached its expected trough (became most affordable) during the recovery phase in 1998. More recently the affordability index in the GTA reached its peak (became least affordable) in 2008, just as the current slump was beginning.
Strategic analysis: Looking forward to 2011 and 2012, with an anticipated increase in the prime interest rate of one and a half to two percentage points, thus offsetting an improving labour market and strong net migration, the strategic real estate investor will forecast that affordability in the GTA is moving toward a statistical trough.
Graph 10.9: Toronto RBC Affordability Index, 1985–2010
Real Estate Listings
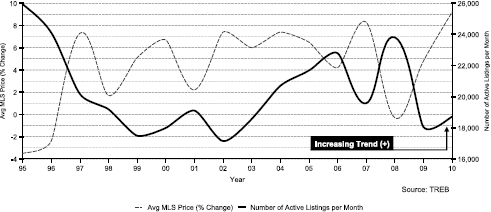
The number of listings of properties for sale tends to peak in comparison to sales volumes during the end of the slump phase as the supply of property exceeds demand. It reaches a statistical trough during the boom when properties are selling rapidly. In the GTA's case, listings have not followed this typical pattern; in fact, they have moved the opposite way during the slump phase, due mainly to the strong demand brought on by the market influencers discussed above. It is important to note that, before a true sustained recovery begins, it is likely that listings will begin an upward trend.
Strategic analysis: Based on the first two quarters of 2011, it appears that listings in the GTA are on the rise. This upward trend is consistent with the end of a slump.
Graph 10.10: GTA Active Listings, 1995–2010
Real Estate Sales
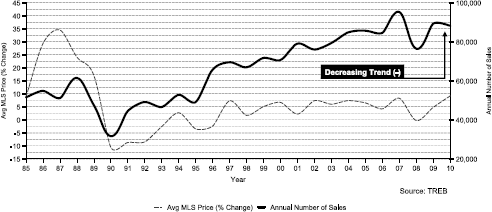
Sales volumes tend to peak near the end of the boom phase and trough near the end of the slump phase. The peak was consistent with the current GTA cycle, but the trough that occurred in 2009 was premature due to the market influencers of emergency low interest rates and HST-stimulated demand.
Strategic analysis: Strategic real estate investors expect to see the downward trend in sales continue, as per a typical end to a slump phase in the real estate cycle.
Graph 10.11: GTA Real Estate Sales, 1985–2010
Toronto's Real Estate Climate: Market Influencers Skew Cycle
Strategic real estate investors who review this chapter's analysis of key drivers in the GTA market will undoubtedly agree that the market remains in the slump phase of the real estate cycle. There are, however, several key drivers that appear to be moving in a more positive direction, with employment, GDP, real estate listings, sales and vacancy rates all exhibiting the potential to move on from a statistical trough/low point.
Are those key drivers indicating a market in transition from slump to recovery? Strategic investors would say no. They recognize that market anomalies caused by market influencers have complicated the current GTA market. Through most of 2009 and 2010, market influencers (low interest rates and the incentive to buy before the HST took effect) disguised the reality of the market slump, which is typically characterized by flat or declining market signals.
But that disguise isn't all bad news. Whereas a non-strategic investor may make market decisions based on unsustainable market improvements, the strategic real estate investor recognizes the opportunities this presents: when their non-strategic colleagues buy in a slump market they think is on the rebound, strategic vendors make money. They know the price will not hold, even though their non-strategic buyer is predicting further increases in value. Similarly, the strategic real estate investor may buy property in a slump because he has a business plan to hold that property until a sustained recovery arrives.
The bottom line is that strategic real estate investors will exercise caution in a slump. They know that the pace of value growth set in the GTA market of 2010 will not be sustained, even though other key drivers appear to support a shift from slump to recovery.
 Alert
Alert
How do you know if your portfolio can weather rising interest rates during a slump phase? Strategic real estate investors diligently stress-test their portfolios to measure the potential impact of rising interest rates. Where appropriate, they take action.
 Cycle Secret
Reality is a strategic real estate investor's best friend. Strategic investors use analysis of key drivers to keep from getting caught up in the emotions of short-term market trends, but remain open to opportunities to select buy-hold-and-sell and positive cash flow tactics that fit each phase of a real estate cycle. They also know the difference between temporary and sustained market shifts and act accordingly.
 Bonus Downloda
Visit www.realestatecyle.ca for a free download of the complete GTA 20-Year Historical Key Driver Package.