1 Introduction
The guidelines for drinking water are attributed to two main criteria: (1) the absence of unacceptable taste, odor, and color and (2) the absence of substances that harm the physiological functions. In this way, water needs to get together with certain physical, chemical, and microbiological principles, that is, it must be free from illnesses delivering microorganisms and concoction substances, hazardous to well-being before it can be named consumable.
Most of the villages of the developing countries currently have a water supply, yet few of them have wastewater collection and treatment system [1–3]. There is a need to construct proper sewer frameworks in the small communities; otherwise, individuals will depend on on-site sanitation. In such septic tank, sewage water infiltrates to the underlying aquifer forming the biggest volumetric source of pathogenic organisms to the groundwater. Wastewater and sludge are also dumped in the closest water body or directly on agrarian fields.
Bishnoi and Arora [1] found that village’s wastewater effluent was the major source of fluoride in the potable groundwater in Haryana, India. Village’s environs in central India were the source of nitrate contamination in basaltic groundwater aquifer [2]. Gao et al. [4] monitored the groundwater quality in drinking water wells in a village belonging to Shanghai City (China). They found that the groundwater in the residential areas was highly contaminated by NH4-N without significant seasonal patterns and most water samples are unsuitable for human consumption. The work of Sajidu et al. [5] revealed high levels of fluorides (>1.5 mg/l) in some villages of Southern Malawi, and a positive correlation was observed between the pH of the water and fluoride concentrations. Geriesh and EL-Rayes [6] studied the municipal contamination of the shallow groundwater under south Ismailia City villages (Egypt). They concluded that the major source of the groundwater contamination was the seepage from the poorly constructed septic tanks; therefore, the human activity was the main source of higher nitrate and heavy metals concentrations and high bacterial count in the shallow groundwater. Emara et al. [7] deduced that the industrial activities, wastewater drains, and fertilizers are the main sources of groundwater pollution in the water-bearing formation of the Quaternary aquifer under some rural areas in Giza Governorate of Greater Cairo, Egypt. In the central part of the Nile Delta, most of the villages are unsewered; therefore, the consumed water for domestic purposes is stored in the septic tanks and artificially recharges the groundwater causing water logging and groundwater pollution. Salem [3] integrated the water level, sedimentological setting, stable isotopes, subsurface temperature, and hydrochemistry data to investigate and evaluate the problem.
The Nile Delta is facing great challenges, with extremely dense housing, high pressure on the cultivated land, high water requests, and rapid population growth. Groundwater is an essential source of drinking water in the countryside regions in Egypt. Each needs about 2 l of clean drinking water every day. Hence, it is necessary to evaluate the quality of water proposed to be utilized for drinking. Indeed, the chemical pollutants seriously affect the human health. Natural processes and anthropogenic activities affect the water quality. The quality of water is portrayed by water parameters (physical, chemical, and microbiological), and human well-being is at hazard if values surpass satisfactory limits [8].

Location map of the study area (a) and the locations of the collected groundwater samples (b)
2 Geology of the Study Area
The geology of the Nile Delta has been extensively discussed by some researchers over several decades [27–34]. Mit Ghamr Formation composed of sand and gravels with thin clay intercalations. It is assumed to be Pliocene to Quaternary age. The whole sequence of Mit Ghamr is capped by Bilqas formation of the Holocene age. The depositional environment of this formation is probably shallow marine to fluvial. On both sides of the present delta, these deposits form a series of gravel terraces at various heights [35]. Bilqas formation is the top cover of the Delta area and consists mostly of clay. Fine-grained sands, silts, plant remains, and peat deposits are frequent. According to Salem [3] “These sediments appear to have been deposited under continental, lagoonal, fluvatile and beach environments. They represent the advent of a third Holocene sea transgression phase advancing almost from the N and NE direction.”
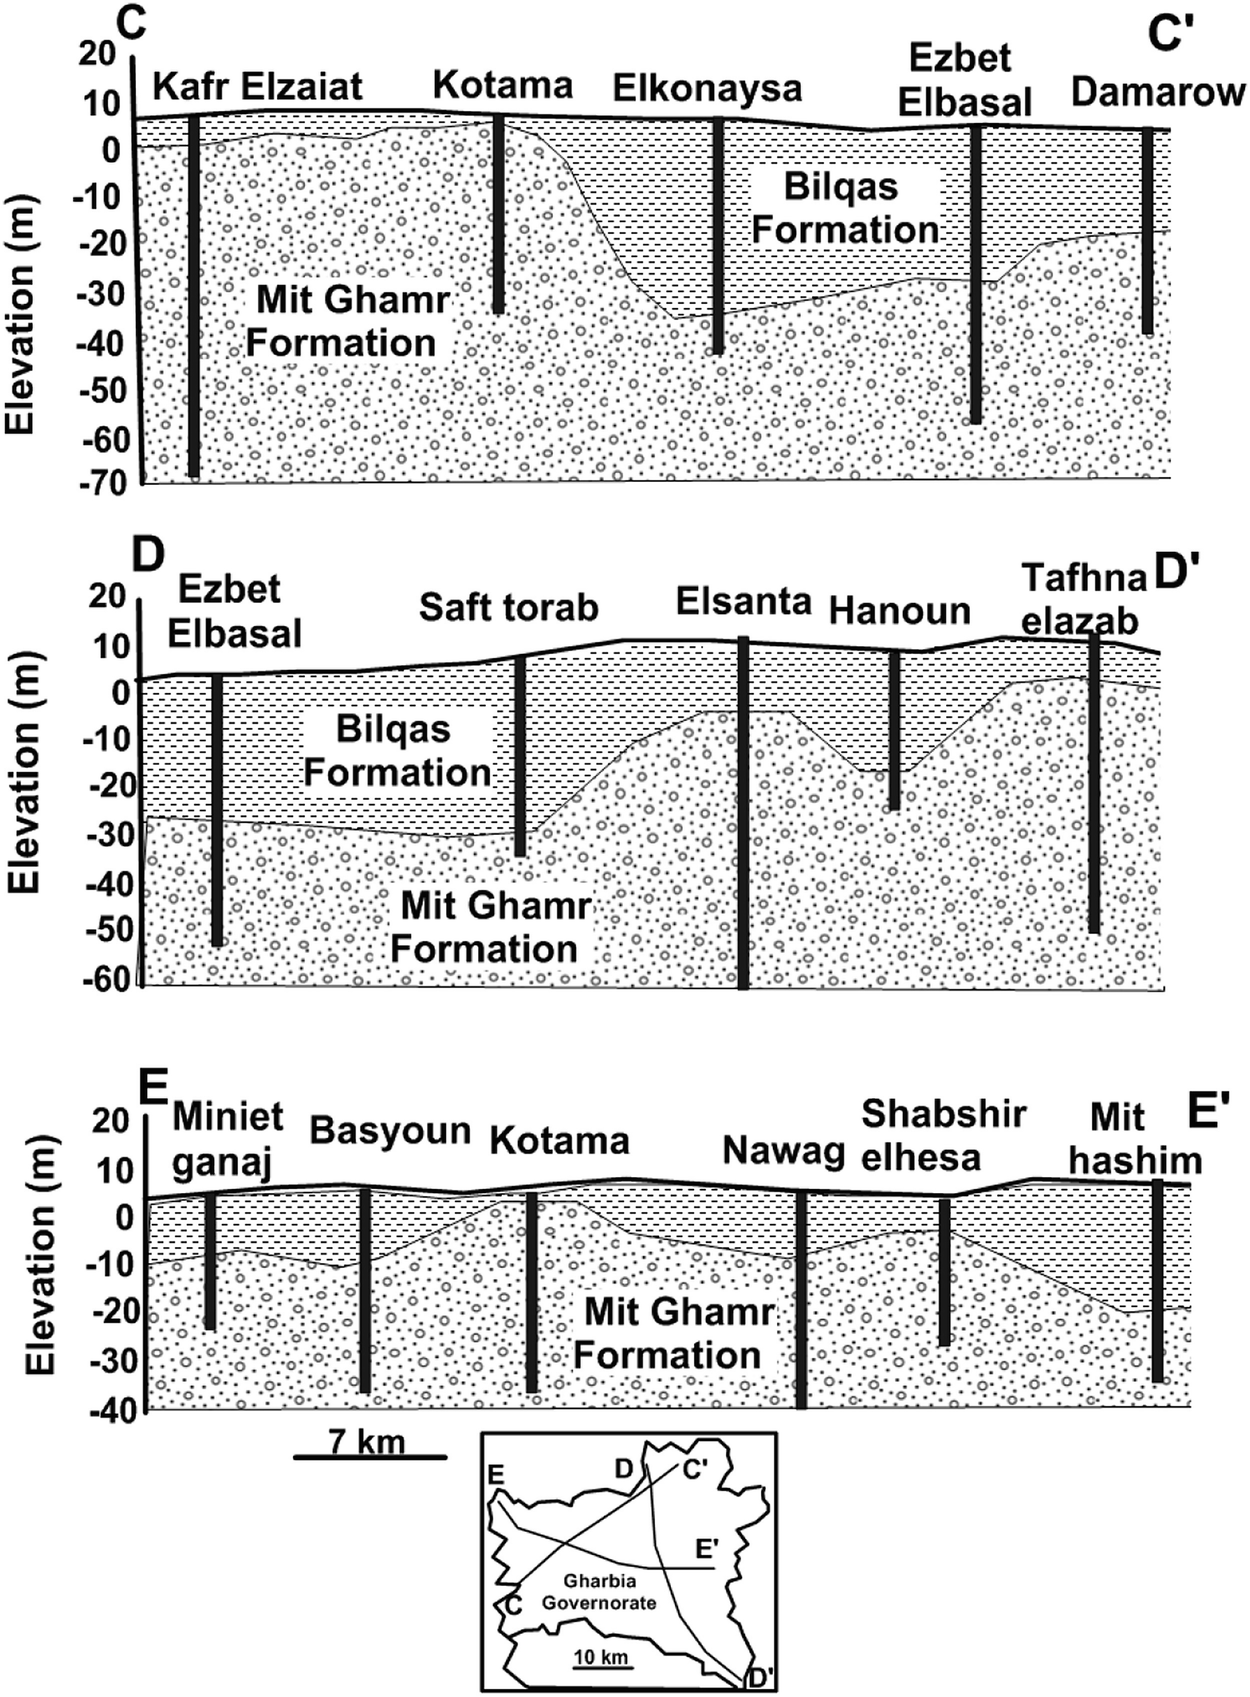
Geohydrologic sections through the groundwater aquifer in the study area [36]
3 Materials and Methods
Groundwater samples were collected from 16 villages in the study area during 2016 (Fig. 1b). Samples were obtained from wells range in depth from 9 to 46 m.
3.1 Hydrochemical Analysis
Hydrochemical characteristics of the analyzed water samples
S. No | 1 | 2 | 3 | 4 | 5 | 6 | 7 | 8 | 9 | 10 | 11 | 12 | 13 | 14 | 15 | 16 | |
|---|---|---|---|---|---|---|---|---|---|---|---|---|---|---|---|---|---|
Village name | Shubra El-Namla | Abiar | Nawag | Damatt | Shabsheer Elhessa | Shenta Ayaash | Bolqina | Pirma | Saa Elhagr | Kotama | Shubra Qaas | Nahttai | Mit Badr Halawa | Mit Habib | Damro | Dokhmees | |
Param. | Units | ||||||||||||||||
Depth | m | 35 | 27 | 44 | 15 | 46 | 45 | 38 | 28 | 28 | 30 | 9 | 25 | 33 | 32 | 21 | 16 |
Temp. | °C | 25.3 | 25.4 | 25.3 | 25.1 | 25 | 25.5 | 24 | 23.7 | 23.7 | 24.1 | 20.2 | un | un | un | 21.6 | 22.4 |
TDS | mg/l | 430 | 440 | 690 | 1,550 | 520 | 770 | 330 | 2,580 | 680 | 350 | 1,500 | 350 | 330 | 500 | 2,500 | 7,420 |
EC | us/cm | 880 | 880 | 1,400 | 3,320 | 1,060 | 1,055 | 580 | 5,180 | 1,370 | 740 | 3,075 | 717.5 | 676.5 | 1,025 | 5,020 | 14,870 |
ORP | mv | −69 | −69 | 150 | −0.6 | 135 | 28 | 57 | −9.6 | −25.5 | −50.1 | −29 | −26.5 | −75 | −75 | −48.9 | −17.3 |
PH | 7.64 | 7.42 | 7.77 | 7.29 | 7.64 | 7.74 | 8.45 | 7.01 | 7.3 | 7.72 | 7.34 | 7.3 | 8.1 | 7.96 | 7.83 | 7.26 | |
DO | mg/l | 0.5 | 0.5 | 0.7 | 0.7 | 0.7 | 0.6 | 0.7 | un | un | un | un | un | un | un | 2.3 | un |
TH | mg/l | 241.6 | 279.6 | 350.8 | 724.18 | 311.2 | 425.8 | 168.4 | 1,376 | 405.9 | 161.28 | 328.9 | 222 | 178.72 | 259.2 | 557.84 | 3898.6 |
K | mg/l | 4.725 | 3.81 | 5.71 | 20.037 | 12.57 | 3.126 | 5.96 | 95.18 | 3.52 | 2.696 | 1.79 | 2.288 | 2.6 | 3.13 | 33.34 | 118.5 |
Na | mg/l | 36 | 42 | 56 | 200.79 | 41 | 71 | 34 | 216.66 | 64.27 | 39.8 | 435.5 | 45.2 | 33.9 | 74.2 | 698 | 1,087 |
Mg | mg/l | 26 | 31 | 38 | 49.8 | 32 | 38 | 24 | 160 | 49 | 15.8 | 29 | 20 | 14.2 | 12 | 32.4 | 446 |
Ca | mg/l | 54 | 61 | 78 | 208 | 72 | 108 | 28 | 288 | 82 | 38.6 | 84 | 56 | 48.2 | 84 | 170 | 828 |
Cl | mg/l | 105.8 | 98 | 157.6 | 516 | 82 | 113.4 | 82.5 | 697.1 | 163 | 58.8 | 613.5 | 57 | 49.9 | 166.7 | 486 | 2,566 |
NO3 | mg/l | 1.93 | 1.69 | 0.6 | 1.87 | 2.23 | 2.14 | 2.01 | 6.63 | 4.83 | 1.97 | 1.7 | 1.83 | 1.68 | 4.64 | 28 | 3.8 |
SO4 | mg/l | 23.24 | 56.66 | 72.47 | 72.5 | 52.27 | 63.67 | 25.29 | 188.2 | 39 | 15.6 | 72.3 | 65.2 | 0.3 | 4 | 244.53 | 220.68 |
HCO3 | mg/l | 205 | 215 | 236 | 81.646 | 266 | 386 | 146 | 817.8 | 321.4 | 206 | 386 | 201 | 242.5 | 210 | 860 | 2,563 |
CO3 | mg/l | 0 | 0 | 12 | 13 | 12 | 12 | 11 | 17.2 | 3.6 | 8 | 10 | 14 | 12 | 2.1 | 62 | 40 |
Fe | mg/l | 0.286 | 0.025 | 0 | 0.43 | 0 | 0 | 0 | 1.144 | 1.824 | 0.0056 | 0 | 0 | 1.231 | 0.527 | 0 | 0 |
Mn | mg/l | 1.087 | 0.722 | 0.645 | 0.774 | 0.51 | 0.324 | 0.2 | 0.863 | 1.616 | 0.644 | 1.85 | 0.387 | 0.25 | 0.217 | 0.299 | 1.496 |
Zn | mg/l | 0.007 | 0.088 | 0.0072 | 0.007 | 0.007 | 0.0071 | 0 | 0.008 | 0.067 | 0.005 | 0.01 | 1.025 | 1.45 | 0.174 | 0.048 | 2.9 |
N | mg/l | 1.93 | 1.69 | 2.07 | 1.87 | 2.23 | 2.14 | 1.52 | 6.63 | 4.83 | 0.122 | 5.155 | 4.09 | 4.14 | 3.46 | 4.53 | 3.8 |
P | mg/l | 0.598 | 0.401 | 0.398 | 0.38 | 0.373 | 0.376 | 0.365 | 0.13 | 0.64 | 0.11 | 0.48 | 0.44 | 0.53 | 0.64 | 0.53 | 0.57 |
AS | mg/l | 0.15 | 0.184 | 0.182 | 0.182 | 0.177 | 0.227 | 0.01 | 0.24 | 0.008 | 0.186 | 0.01 | 0.008 | 0.006 | 0.012 | 0.011 | 0.11 |
NH4 | mg/l | 0.57 | 0.42 | 0.6 | 0.47 | 0.61 | 0.52 | 0.6 | 12.45 | 1.49 | 1.02 | 2.82 | 0.79 | 2.03 | 5.83 | 6.97 | 9.78 |
Ba | mg/l | 0.177 | 0.145 | 0.027 | 0.025 | 0.02 | 0.02 | 0.01 | 0.024 | 0.025 | 0.067 | 0.074 | 0.068 | 0.066 | 0.091 | 0.314 | 0.114 |
Sr | mg/l | 0.748 | 0.579 | 1.187 | 1.34 | 0.71 | 0.631 | 0.42 | 0.794 | 0.919 | 0.569 | 1.246 | 0.505 | 0.452 | 0.36 | 1.039 | 0.76 |
Si | mg/l | 42.55 | 28.22 | 31.56 | 35.75 | 35.59 | 29.96 | 14 | 50.66 | 26.58 | 42.16 | 14.38 | 12.69 | 10.99 | 14.04 | 17.35 | 13.31 |

Desirable limits of parameters and its assigned relative weight
Parameters | WHO desirable limits | Weight (wi) | Relative weight |
|---|---|---|---|
TDS | 500 mg/l | 5 | 0.08621 |
PH | 6.5–8.5 | 3 | 0.05172 |
EC | 1,500 us/cm | 5 | 0.08621 |
TH | 300 mg/l | 4 | 0.06897 |
Ca | 200 mg/l | 2 | 0.03448 |
Na | 200 mg/l | 3 | 0.05172 |
Mg | 125 mg/l | 2 | 0.03448 |
K | 12 mg/l | 2 | 0.03448 |
Cl | 250 mg/l | 3 | 0.05172 |
CO3 | 350 mg/l | 2 | 0.03448 |
SO4 | 250 mg/l | 2 | 0.03448 |
NH4 | 0.5 mg/l | 4 | 0.06897 |
HCO3 | 350 mg/l | 2 | 0.03448 |
NO3 | 50 mg/l | 5 | 0.08621 |
Fe | 0.3 mg/l | 3 | 0.05172 |
Mn | 0.4 mg/l | 4 | 0.06897 |
Zn | 5 mg/l | 2 | 0.03448 |
As | 0.01 mg/l | 5 | 0.08621 |
∑W = 58 | ∑W = 1 | ||


where wi is the weight of ith parameter and n is the number of chemical parameters.
3.2 Statistical Analysis
Multivariate statistical techniques, such as CA and PCA, are often used as “unbiased methods” to summarize associations between samples and variables. Such associations based on similar magnitudes and variations in the chemical and physical composition may reveal the effects of climate or human activity on water quality. Agglomerative hierarchical clustering approach options include single linkage, complete linkage, weighted and unweighted pair group average linkage, and centroid linkage. Ward’s method was used for this analysis because it is commonly applied in the literature germane to this study [39, 40]. One of the reasons it is widely applied is that it tends to yield spherical clusters of the same size (i.e., classification variables over all classes essentially have the same variance).
PCA is an effective method for pattern estimation that used to clarify the difference of an extensive arrangement of intercorrelated variables. It demonstrates the relationship between variables by decreasing the dimensionality of the dataset [41]. The covariance matrix of the original variables is used to extract the eigenvalues and eigenvectors. PCA changes informational collection into an uncorrelated one [42]. The first PC is the projections of the given points onto the extreme fluctuations, the second PC has the change subject to being orthogonal to PC1; the third PC has the greatest difference subject to being orthogonal to the first and second PCs [43, 44]. The multivariate statistical analysis relates variables into PCs depending on their common relationship coefficients and these affiliations might be used to estimate the mineralization, lithology and ecological procedures [45].
4 Results
The physical and chemical properties of the groundwater samples from the study area were given in Table 1.
4.1 Description and Spatial Distribution

Spatial distribution maps of TDS (a), HCO3 (b), TH (c), Cl (d), NO3 (e), and SO4 (f) concentrations according to WHO [8] drinking water guidelines
The values of alkalinity in all samples ranged from 157 mg/l (sample 7) to 2,603 mg/l (sample 16). Except samples 6, 8, 11, 15, and 16, other samples are of the desirable limit of HCO3 (Fig. 3b). Total hardness concentrations range from 161.28 mg/l (sample 10) to 3898.6 mg/l (sample 16). According to Sawyer and McCarty [46] common hardness scale, the groundwater samples 1, 2, 7, 10, 12, 13, and 14 are under the hard category, but all other samples are very hard water (Fig. 3c). The lowest concentration of the chloride ion is 49.9 mg/l (sample 13), and the highest level is 2,566 mg/l was detected in sample 16. Chloride levels in most samples are below WHO permissible limits (Fig. 3d) except that of samples 4, 8, 11, 15, and 16. Nitrate concentrations were found to be in a range of 0.6 mg/l (samples 3) to 6.63 mg/l (sample 8). Therefore, all samples are under the desirable limits (Fig. 3e). Concentrations of sulfate are below the WHO permissible limits (Table 1 and Fig. 3f) and range from 0.3 mg/l (samples 13) to 244.53 mg/l at sample 16.
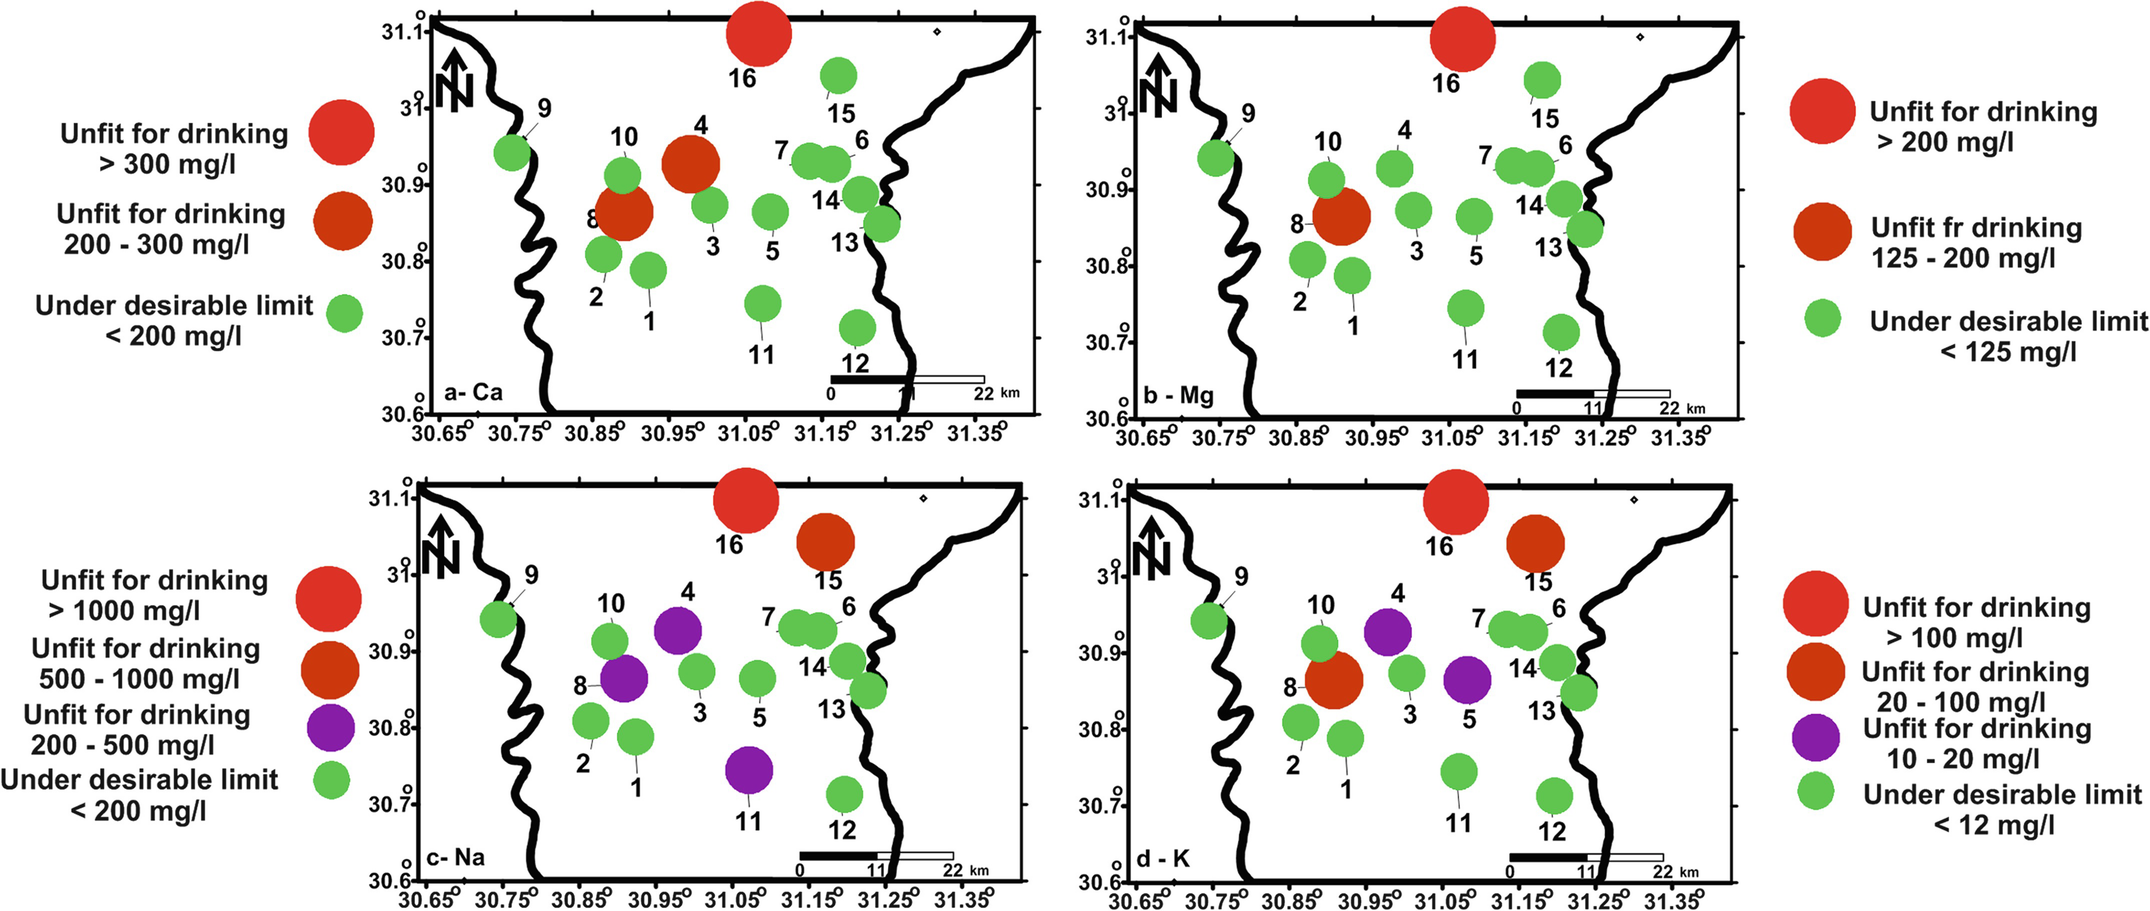
Concentrations spatial distribution maps of Ca (a), Mg (b), Na (c), and K (d) according to WHO [8] drinking water guidelines
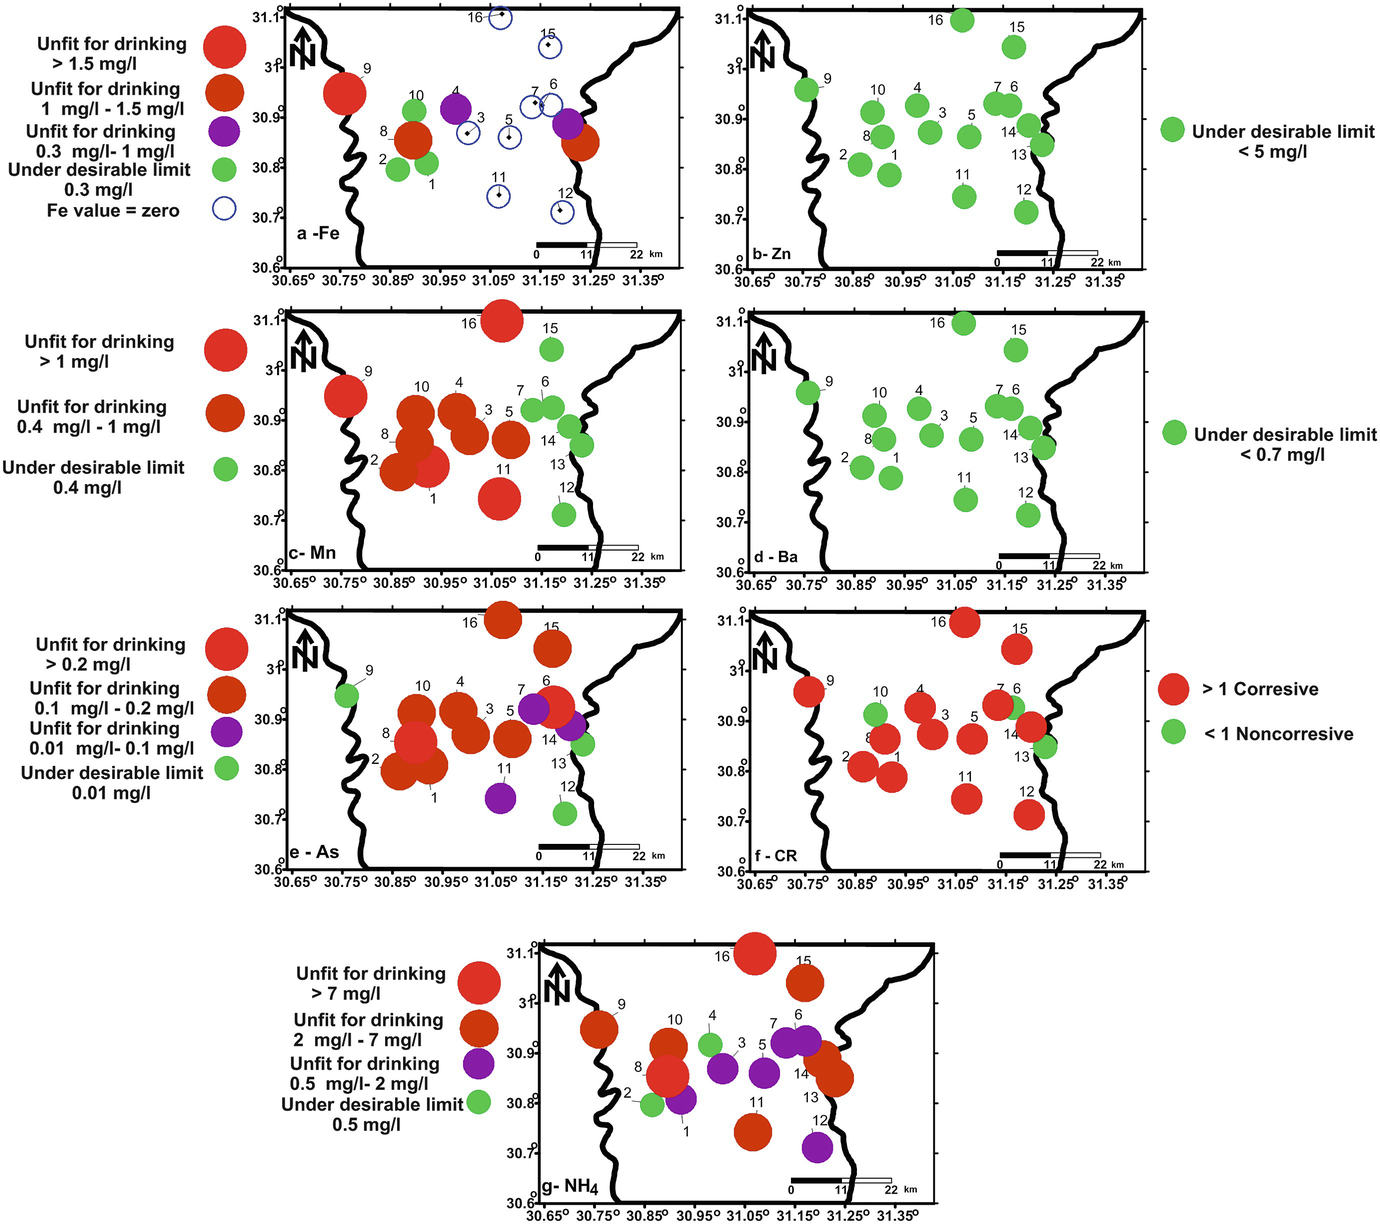
Spatial distribution maps of Fe (a), Zn (b), Mn (c), Ba (d), As (e), CR (f), and NH4 (g) concentrations according to WHO [8] drinking water guidelines
4.2 Statistical Analysis
Correlation matrix for the chemical constitutions present in the collected groundwater samples
TDS | K | Na | Mg | Ca | Cl | NO3 | SO4 | HCO3 | CO3 | Fe | Mn | Zn | N | P | AS | NH4 | Ba | Sr | Si | |
|---|---|---|---|---|---|---|---|---|---|---|---|---|---|---|---|---|---|---|---|---|
TDS | 1 | |||||||||||||||||||
K | 0.91 | 1.00 | ||||||||||||||||||
Na | 0.93 | 0.77 | 1.00 | |||||||||||||||||
Mg | 0.95 | 0.90 | 0.78 | 1.00 | ||||||||||||||||
Ca | 0.98 | 0.91 | 0.85 | 0.98 | 1.00 | |||||||||||||||
Cl | 0.99 | 0.88 | 0.90 | 0.96 | 0.98 | 1.00 | ||||||||||||||
NO3 | 0.26 | 0.23 | 0.48 | 0.02 | 0.13 | 0.12 | 1.00 | |||||||||||||
SO4 | 0.93 | 0.88 | 0.91 | 0.83 | 0.87 | 0.86 | 0.52 | 1.00 | ||||||||||||
HCO3 | 0.99 | 0.89 | 0.91 | 0.96 | 0.98 | 0.98 | 0.25 | 0.91 | 1.00 | |||||||||||
CO3 | 0.14 | 0.13 | 0.38 | −0.11 | 0.01 | 0.01 | 0.90 | 0.44 | 0.12 | 1.00 | ||||||||||
Fe | −0.10 | 0.05 | −0.22 | −0.03 | −0.06 | −0.11 | −0.02 | −0.17 | −0.09 | −0.15 | 1.00 | |||||||||
Mn | 0.42 | 0.36 | 0.40 | 0.43 | 0.39 | 0.49 | −0.18 | 0.28 | 0.38 | −0.32 | 0.20 | 1.00 | ||||||||
Zn | 0.71 | 0.56 | 0.60 | 0.76 | 0.75 | 0.74 | −0.08 | 0.54 | 0.75 | −0.13 | 0.00 | 0.17 | 1.00 | |||||||
N | 0.34 | 0.48 | 0.37 | 0.27 | 0.27 | 0.30 | 0.36 | 0.41 | 0.30 | 0.30 | 0.52 | 0.32 | 0.21 | 1.00 | ||||||
P | 0.12 | −0.13 | 0.24 | 0.07 | 0.11 | 0.15 | 0.16 | 0.03 | 0.15 | −0.06 | 0.20 | 0.21 | 0.31 | 0.23 | 1.00 | |||||
AS | −0.01 | 0.17 | −0.22 | 0.12 | 0.07 | −0.02 | −0.32 | 0.01 | −0.01 | −0.21 | −0.27 | −0.14 | −0.29 | −0.49 | −0.70 | 1.00 | ||||
NH4 | 0.72 | 0.86 | 0.65 | 0.66 | 0.68 | 0.66 | 0.46 | 0.75 | 0.69 | 0.30 | 0.21 | 0.17 | 0.37 | 0.67 | −0.05 | −0.07 | 1.00 | |||
Ba | 0.22 | 0.09 | 0.46 | 0.03 | 0.10 | 0.14 | 0.76 | 0.39 | 0.23 | 0.57 | −0.28 | −0.08 | 0.07 | 0.06 | 0.36 | −0.34 | 0.24 | 1.00 | ||
Sr | 0.23 | 0.16 | 0.33 | 0.07 | 0.15 | 0.22 | 0.20 | 0.29 | 0.15 | 0.30 | −0.04 | 0.51 | −0.24 | 0.16 | 0.00 | 0.04 | 0.01 | 0.02 | 1.00 | |
Si | −0.20 | 0.05 | −0.38 | −0.11 | −0.16 | −0.23 | −0.17 | −0.14 | −0.22 | −0.14 | 0.07 | 0.02 | −0.55 | −0.31 | −0.65 | 0.81 | −0.04 | −0.26 | 0.15 | 1.00 |
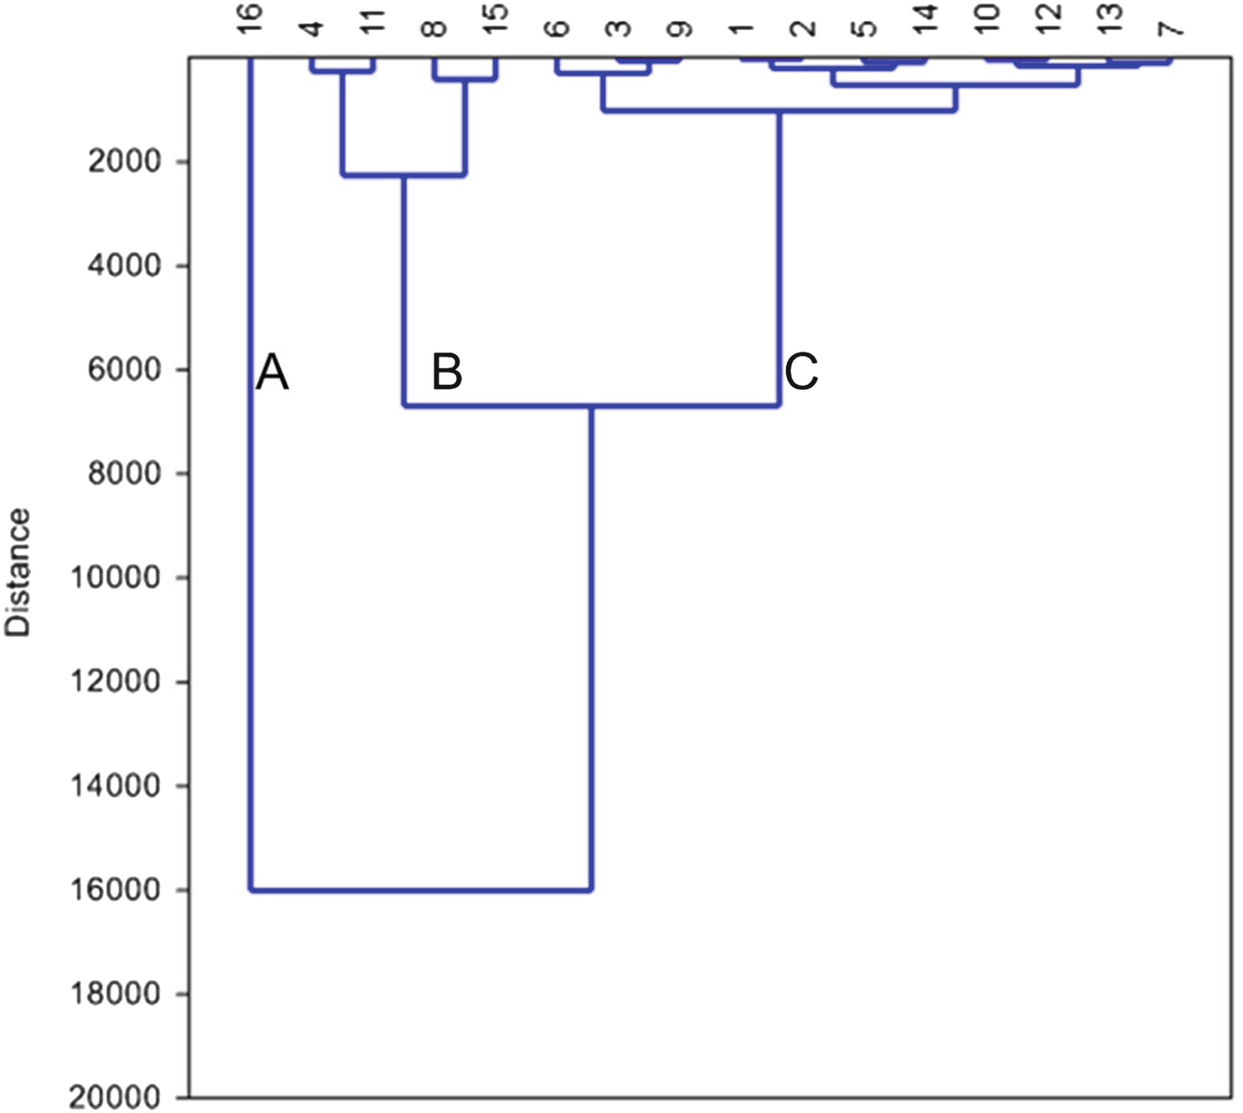
Dendrogram based on Ward’s method shows three groups of the collected water samples according to the abundance of the hydrochemical composition
Hydrochemical compositions of clusters A, B, and C
Unit | Cluster A (sample 16) | Cluster B (samples 4,11, 8, and 15) | Cluster C (samples 1, 2, 3, 5, 6, 7, 9, 10, 12, 13, and 14) | |||||
|---|---|---|---|---|---|---|---|---|
Min | Max | Average | Min | Max | Average | |||
TDS | mg/l | 7,420 | 1,500 | 2,580 | 2032.5 | 330 | 770 | 490 |
EC | μS/cm | 14,870 | 3,075 | 5,180 | 4148.75 | 580 | 1,400 | 944 |
PH | 7.26 | 7.01 | 7.83 | 7.3675 | 7.300 | 8.450 | 7.731 | |
K | meq/l | 3.03 | 0.48 | 2.44 | 1.07 | 0.059 | 0.322 | 0.117 |
Na | meq/l | 47.27 | 8.73 | 30.36 | 16.86 | 1.474 | 3.227 | 2.085 |
Mg | meq/l | 36.71 | 2.39 | 13.17 | 5.58 | 0.988 | 4.033 | 2.245 |
Ca | meq/l | 41.40 | 4.20 | 14.40 | 9.38 | 1.400 | 5.400 | 3.226 |
Cl | meq/l | 72.41 | 14.55 | 32.44 | 20.99 | 1.407 | 4.701 | 2.909 |
NO3 | mg/l | 3.80 | 1.70 | 28.00 | 9.55 | 0.600 | 4.830 | 2.323 |
SO4 | meq/l | 7.29 | 0.58 | 3.91 | 1.88 | 0.006 | 1.507 | 0.790 |
HCO3 | meq/l | 42.03 | 6.33 | 13.41 | 8.77 | 2.394 | 6.330 | 3.928 |
CO3 | meq/l | 0.66 | 0.16 | 1.02 | 0.42 | 0.000 | 0.230 | 0.129 |
Fe | mg/l | 0.01 | 0.01 | 1.14 | 0.40 | 0.002 | 1.824 | 0.365 |
Mn | mg/l | 1.496 | 0.30 | 1.85 | 0.95 | 0.217 | 1.616 | 0.611 |
Zn | mg/l | 2.9 | 0.01 | 0.05 | 0.02 | 0.005 | 1.450 | 0.259 |
N | mg/l | 3.8 | 1.87 | 6.63 | 4.55 | 0.122 | 4.830 | 2.610 |
P | mg/l | 0.57 | 0.13 | 0.53 | 0.38 | 0.110 | 0.640 | 0.444 |
AS | mg/l | 0.11 | 0.01 | 0.24 | 0.11 | 0.006 | 0.227 | 0.120 |
NH4 | mg/l | 9.78 | 0.47 | 12.45 | 5.68 | 0.420 | 5.830 | 1.316 |
Ba | mg/l | 0.114 | 0.02 | 0.31 | 0.11 | 0.020 | 0.177 | 0.069 |
Sr | mg/l | 0.76 | 0.79 | 1.34 | 1.10 | 0.360 | 1.187 | 0.653 |
Si | mg/l | 13.31 | 14.38 | 50.66 | 29.54 | 10.990 | 42.550 | 27.545 |
Cluster B includes samples 4, 8, 11, and 15. As for chemical elements, this water type had the moderately mean concentrations among the three clusters (Table 4), and it had higher ion concentrations of Fe, Sr, and Si than the other two clusters and dominated major ion concentrations arranged as follows: sodium > calcium and chloride > bicarbonate. They also had relatively high concentrations of potassium, magnesium, and sulfate. Finally, the water samples of cluster C (samples 1, 2, 3, 5, 6, 7, 9, 10, 12, 13, and 14) were dominated by Ca > Na > Mg and HCO3 > Cl ion concentration arrangement (Table 4). The average concentrations of the physicochemical parameters of this cluster are the lowest among the three groups.
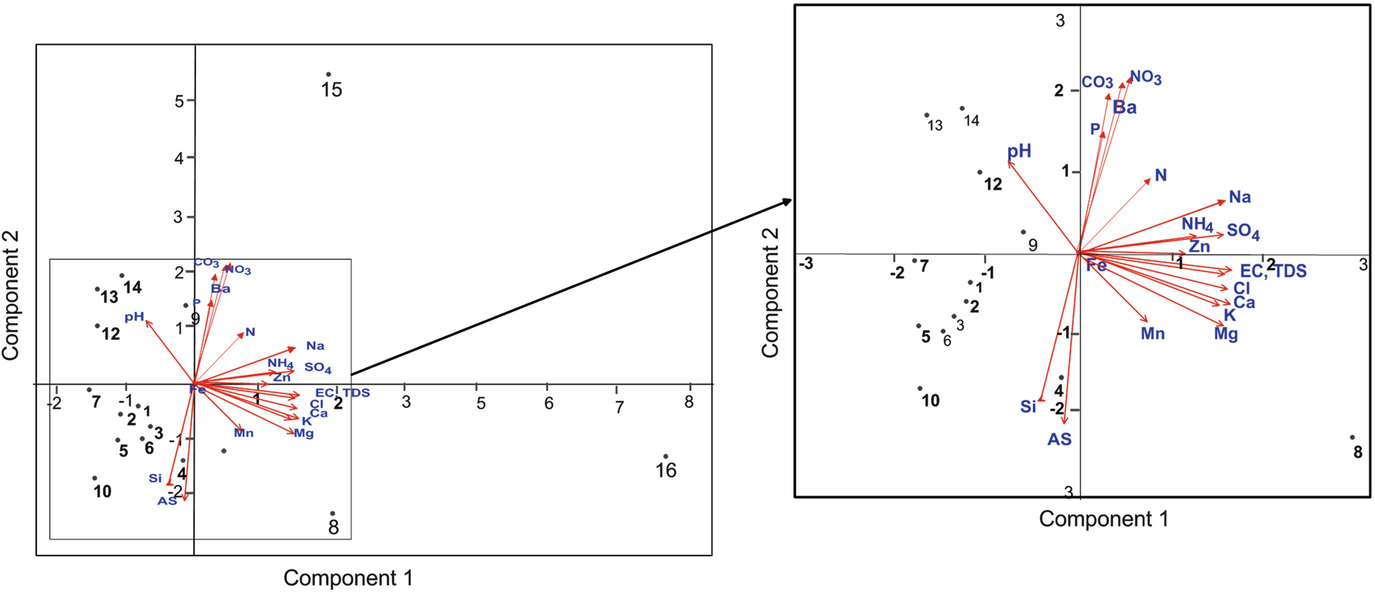
PCA scatter diagram showing the relationships between samples and the water physicochemical characteristics
4.3 Drinking Water Quality
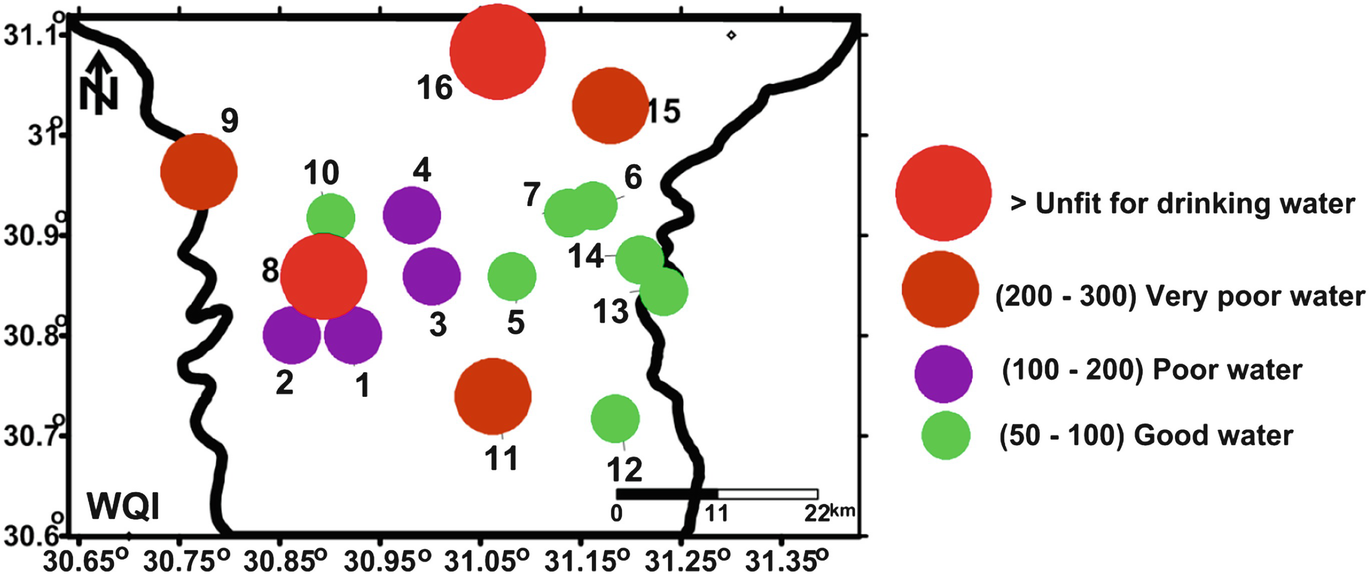
Spatial distribution map of drinking water quality index (WQI)
5 Discussion
Egyptians living in the villages directly use groundwater for various purposes. Nile Delta villages have no or badly constructed sewage networks. Therefore, groundwater under these villages might receive pollutants. Physicochemical parameters of 16 groundwater samples (one sample for one village) were measured to evaluate this problem. The quality of the sampled groundwater varied greatly from one village to another. Using cluster analysis, the collected samples were classified into three groups. Cluster A includes sample 16 which is dominated by higher concentrations of TDS, EC, potassium, magnesium, sodium, calcium, sulfate, chloride, bicarbonate, Mn, Zn, P, NH4, Ba, and unfit WQI values. Bad water quality of this group might be related to the effect of El-Gharbia main drain and seawater intrusion.
Cluster B includes samples 4, 8, 11, and 15. This group had the moderately mean ion concentrations among the three clusters, and it had higher ion concentrations of Fe, Sr, and Si than the other two clusters and dominated major ion concentrations arranged as follows: sodium > calcium and chloride > bicarbonate. They also had relatively high concentrations of potassium, magnesium, and sulfate. WQI of this group varies from poor characters in Damatt (4), very poor in Shobra Qaas village (11) and Damro (15), to unfit in Pirma (8). Groundwater of this group might receive a seepage from the domestic wastes.
Samples of cluster C (1–3, 5–7, 9, 10, and 12–14) were dominated by Ca > Na > Mg and HCO3 > Cl ion concentration arrangement (Table 4). The average concentrations of the physicochemical parameters of this cluster are the lowest among the three groups. WQI of these samples varies from good as in samples 5, 6, 7, 10, 12, 13, and 14, poor (1–3, and) to very poor (sample 9). A wide range of WQI in this group is assumed to be related to the slight seepage from domestic wastes which increase the values of minor elements like NH4 but did not affect the major ion concentrations.
The presence of undesirable concentrations of arsenic and ammonia in most of the samples is related to the direct seepage from the domestic wastes such that of the drains and septic tanks. Higher concentrations of arsenic and ammonia sometimes accompanied with higher TDS and major element concentrations due to the higher leakage from septic tanks under the village like that of Pirma (sample 8) and both the effect of seepage from the main drains and seawater intrusion as in sample 16 (village of Dokhmees).
6 Conclusions
Groundwater was sampled from 16 villages during 2016. Spatial distribution of the elements’ concentrations according to WHO guidelines, WQI (drinking water quality index), and statistical analysis was used to evaluate the groundwater pollution under Central Nile Delta villages. The studied groundwater was affected by the seepage from the septic tanks and/or drains in most of the villages. The groundwater affected by drains showed high TDS, EC, potassium, magnesium, sodium, calcium, sulfate, chloride, bicarbonate, Mn, Zn, P, NH4, Ba, and unfit WQI values. Samples directly affected by seepage from the septic tanks had moderately mean ion concentrations and higher concentrations of Fe, Sr, and Si. It also had WQI values range from poor, very poor to unfit. Other samples were affected by neither drains nor septic tanks and had the lowest TDS concentrations and good WQI. Arsenic and ammonia undesirable concentrations in most of the collected groundwater samples are indications of direct infiltration from septic tanks and/or seepage from the drains. These two chemicals are of severe hazardous effect on the human health.
7 Recommendations
Sewage networks should be constructed in the Egyptian villages to prevent the groundwater contamination due to the use of septic tanks. The state and civil society organizations should inform the residents of the villages of the need to analyze the groundwater of their wells and consult the concerned authorities to determine the validity of this water for different uses. Also, they should be aware of the health hazards resulting from the use of contaminated water. The state should also extend the villages with clean water networks so that the need for underground water is reduced. Detailed hydrochemical and the microbial survey should be done to evaluate the groundwater contamination under the Egyptian village.