The temperature-depth profiles of 47 boreholes were investigated to characterize the groundwater flow system in the northwestern part of the Nile Delta, Egypt (hereafter referred to as the study area). A vertical subsurface thermal system was used for the investigation.
The groundwater was recharged in the reclaimed area located in the southwestern direction of the study area, where high subsurface temperatures were recorded. The discharge regions were located in the old agricultural lands (northern and northeastern areas) and were characterized by low subsurface temperatures compared with those in the recharge area. This abnormal thermal system was attributed to contrasts in the surface air temperature, where higher values were recorded in the recharge area (Wadi El-Natrun station; annual average temperature 23.15°C) and lower values were detected in the old agricultural lands (Damanhour station; annual average temperature 20.37°C). Regardless of this unusual framework, the geothermal gradient was low in the recharge territory (average 0.0198°C/m) and high in the discharge area (average 0.0343°C/m).
The effect of irrigation canals on the thermal system was detected from the constructed vertical two-dimensional (2D) cross-sections, where the gaining streams were underlined by a warm zone, while the losing streams were underlined by a cooler zone. Vertical groundwater fluxes in the study area were assessed from a comparison between measured and simulated one-dimensional (1D) temperature profiles. All temperature profiles related to wells in the Wadi El-Natrun station area were of the recharge type, with groundwater flux (U) values ranging from 0.3 to 1.5 m/year, except for well 21, which was the discharge type (U range −0.1 to −0.5 m/year). The temperature profiles related to Damanhour station were of the discharge type (U range −0.1 to −1.5 m/year), except for wells 22, 47, and 39, which were the recharge type (U range 0.1 to 0.5 m/year).
We concluded that the geothermal gradient is superior to the thermal system for following the groundwater stream framework in regions such as those we examined.
It is known that water table data alone are not sufficient for calibrating groundwater flow models, and assessments of groundwater flux, as well as information on solute development and heat flow, are required for model adjustment [1]. Subsurface heat exchange occurs everywhere on Earth, at higher rates in some areas than in others. Geothermal heat is considered to be a good tracer for various geologic processes; the best example of these processes is the groundwater flow system [2], in which temperature profiles can be utilized to gauge the recharge and discharge rates of groundwater, the effects of surface warming, the groundwater-surface water relationship, the hydraulic conductivity of the stream base layer, and basin penetrability [1].
Stallman [3] was one of the early specialists who investigated the potential for utilizing subsurface temperature to estimate groundwater velocity and aquifer hydraulic conductivity. The pioneering hypothetical work of Suzuki [4], Stallman [5], and Bredehoeft and Papadopulos [6] demonstrated that the subsurface temperature could be utilized to analyze one-dimensional (1D) heat transfer in order to estimate groundwater velocity. The augmentation of this kind of investigation to assess groundwater upward and downward movement rates, interaction with surface water, and flow in fractures, as well as the impact of surface warming, is considered here in relation to the temperature-depth profile.
The utilization of subsurface temperature at the basin scale was spearheaded by Cartwright [7], who utilized the Bredehoeft and Papadopulos [6] model to estimate the velocity of groundwater upward movement in the Illinois Basin. Domenico and Palciauskas [8] introduced a 2D analytical solution regarding heat transfer in a vertical cross-section of a basin. Subsequent utilization of analytical solutions in regard to sedimentary basins was essentially made by Japanese investigators, including Sakura [9], Inagaki and Taniguchi [10], Taniguchi [11, 12], and Dapaah-Siakwan and Kayane [13]. Numerous specialists became interested in the investigation of numerical solutions for coupled groundwater and heat transfer models in two and three dimensions. The best monograph on heat transfer in a groundwater basin was published in 1989 and distributed by the American Geophysical Union [14].
Taniguchi et al. [15] reported that surface temperatures in Tokyo had increased by 0.025°C/year in the past 100 years, and they computed vertical groundwater flux by comparing their temperature profiles with those measured by Dapaah-Siakwan and Kayane [13]. Ferguson and Woodbury [16] further developed the model crafted by Taniguchi et al. [15] by utilizing a numerical model to include measured ground surface temperature (GST) at the upper boundary of the model. Different scientists in Japan explored the subjective impact of surface warming on temperature profiles, e.g., Sakura et al. [17]. Salem et al. [18, 19] inferred that current temperature profiles measured in the Nagaoka region were influenced by surface warming to a depth of 60 m. Related work explored the impact of land use on subsurface temperatures [20–23]. Investigations the consequences of surface warming on groundwater are limited to date; however, future investigations will be valuable in determining the potential impact of worldwide warming on water resources [24].
Changes in climatic conditions, particularly surface warming, influence the subsurface temperature, and have been recorded as inversions in subsurface temperature profiles [25]. Human activities affect the thermal conditions of the shallow subsurface under urbanized areas and create what is called subsurface urban heat islands. These islands have been detected in various regions around the world; for example, underneath Osaka, Japan [26]; Albuquerque, New Mexico, United States [27]; Winnipeg, Canada [28]; urban areas in England [29, 30]; and some urban areas in Germany [31, 32].
All these investigations dealing with the relationship between the subsurface temperature and the groundwater flow system assume that the temperature profile in a well is illustrative of the temperature in the relevant aquifer. In open and screened boreholes, differences in water levels of a regional scale flow system that interface with a well create vertical flow inside the borehole [33]. These differences in hydraulic heads are attributed to nearby flow conditions: downward flow in recharge zones and upward flow in discharge zones. The resulting vertical flow within the borehole significantly disturbs the temperature profile [34, 35].
Gravity-driven groundwater flow is associated with a forced convective heat flow and produces cooling and a low geothermal gradient under groundwater recharge regions, an undisturbed thermal system and gradient underneath horizontal groundwater flow domains, and higher temperatures and gradients underneath groundwater discharge zones [15]. Such a framework could be regarded as a typical subsurface heat framework caused by the groundwater stream. In the area of the present study, an abnormal thermal regime was recognized, where the recharge area had a higher groundwater temperature than that of the discharge area. Accordingly, the purpose of this study was to explain this thermal system and use it to clarify the regional groundwater flow system in the area.
Studies dealing with the relation between subsurface temperature and groundwater flow systems in Egypt have been performed recently. Salem and Osman [36] and Salem and El Bayumy [37] modeled the vertical 2D groundwater flow and heat transport to estimate vertical groundwater flow velocities in the northwestern part of the Nile Delta (present study area) and the east Wadi El-Natrun region, respectively. They concluded that permeability was the controlling parameter for the groundwater flow system. Salem et al. [38] and Salem [39] used temperature-depth profiles to depict the groundwater stream framework in the middle Nile Delta and at Wadi El-Assiuty in the Nile Valley, respectively. Also, borehole temperatures were used to show the surface water-groundwater interaction [40]. Salem [41] used the subsurface thermal regime to investigate the paleo-groundwater flow system in Al Kufra basin, Libya, as a case study for an arid area.
One of the principal national concerns of Egyptian governments during the past five decades has been the reclaiming of Egyptian deserts, especially the desert located in the west Nile Delta. Numerous horticultural land improvement projects have been undertaken in the west Nile Delta, depending on the surface water and groundwater. Since these improvement practices have an impact on groundwater quantity, quality, and flow system, the present study relied on the usage of borehole temperatures to trace groundwater stream lines and to assess groundwater vertical flux rates in the study region.
2 Study Area
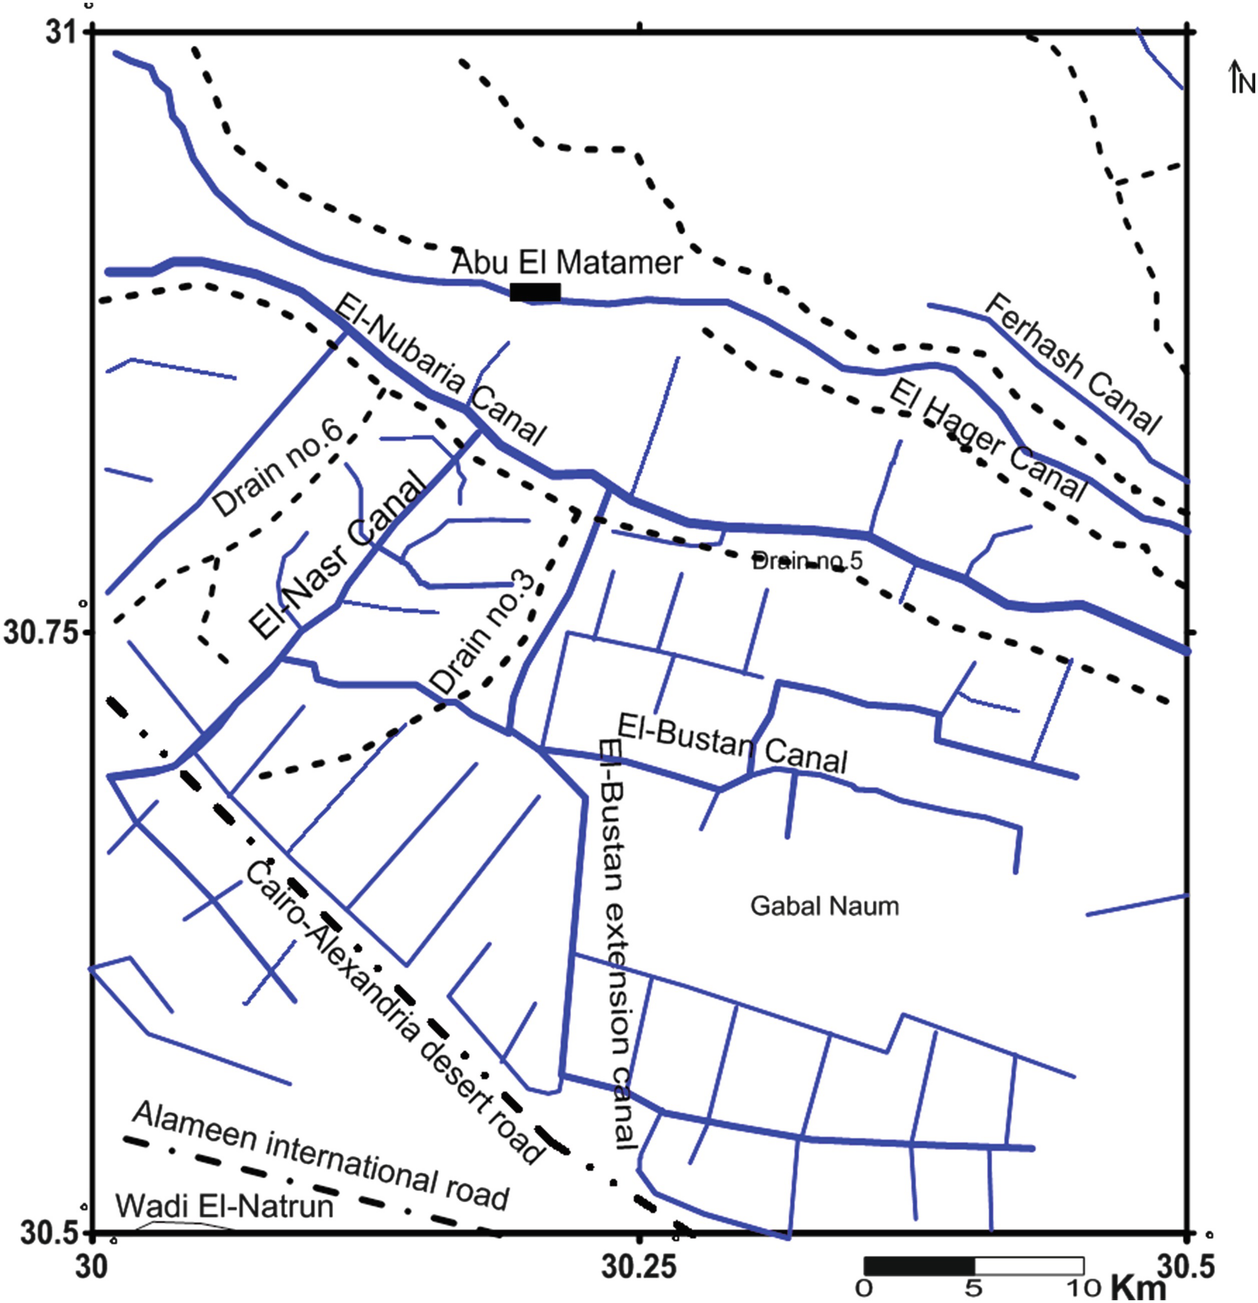
The study area is located in the northwestern part of the Nile Delta (Fig. 1a, b) and is bounded by latitudes 30° 30′ and 31° 00′ N and longitudes 30° 00′ and 30° 30′ E. In this area, the eastern part of the El-Nubaria canal is categorized as belonging to old agricultural land (young alluvial plain). The western El-Nubaria canal area belongs to the old alluvial plain and is one of the desert areas recently reclaimed for agricultural purposes (see Fig. 2). Many canals and drains were recently constructed for irrigation purposes (see Fig. 3). These waterways play important roles in groundwater recharge and discharge, water level changes, flow direction, and water quality. A connection between these surface water streams and the shallow groundwater is assumed because these canals and drains were constructed through the Quaternary sediments of the present aquifer. The principal irrigation canals in the investigated area are the El-Nubaria, Ferhash, El-Hager El-Nasr, El-Bustan, and El-Bustan extension canals.
Fig. 1
Location maps of the study area (a, b). Hydrogeological map of the western Nile Delta and aquifer thickness in the study area (b) and southwest-northeast hydrogeological cross-section of the study area (c)
Fig. 2
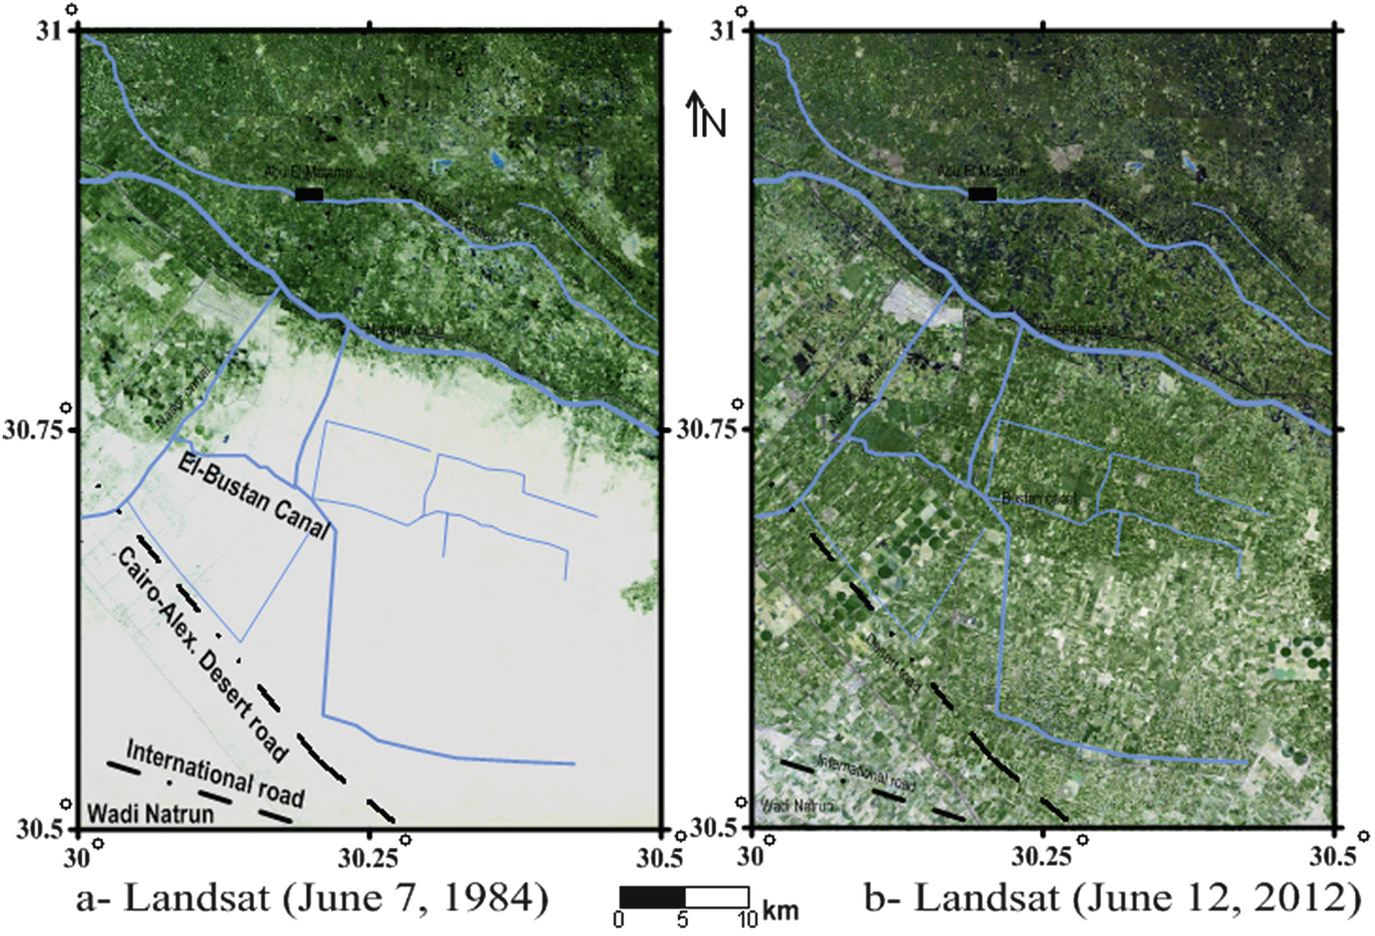
Maps indicate land use change where the desert land shown in (a) (1984) was completely reclaimed by agricultural activities in 2012 (b). Modified from [42]
Fig. 3
Surface water irrigation system in the study area
3 Hydrogeology
The western Nile Delta area has been the subject of previous intensive hydrogeological, hydrogeochemical, and geophysical studies. Among these studies is the work of Saad [43], who stated that the groundwater flow direction in the area is from northeast to southwest, and the transmissivity of the Pleistocene aquifer is 0.615–0.897 m2/min. El Fayoumy [44] reported that Quaternary sediments represent the soil cover and constitute the main aquifer, which is mostly clastic with dominant sand facies. He added that the subsurface sedimentary section in the western Delta is about 4,000 m thick, and rests upon the basement complex, with a complicated structure system and many unconformity surfaces. The Desert Institute, in an internal report [45], stated that the groundwater level in the entire area increased by about 2.5–3 m from March 1972 to March 1973. Before the reclamation projects began, the groundwater seeped from the El-Nubaria canal to the west, but since the construction of the pumping stations, the groundwater has been flowing towards the El-Nubaria canal, where it acts as a drain.
Mabrouk [46] used an electrical resistivity technique to determine the successive layers and their thicknesses between Wadi El-Natrun and the El-Nasr canal area. He noted that the geologic succession consisted of three main layers – a surface layer of aeolian sand, loam, and sandy gravel – and two subsurface layers, consisting of deltaic deposits (thickness 90–347 m) and an impervious clay bed. El Ghazawi [47] proved that the El Galaa and El-Nubaria faults were the most important factors influencing the groundwater conditions in the area. Abdel Baki [48] stated that the recharge in the area arose from two sources, the groundwater inflow and the water infiltrated from irrigation, and he found that the groundwater depth varied widely, from a few meters close to the Delta to about 60 m near the Cairo-Alexandria desert road. Abdel Baki [48], Ismail [49], and Gomaa [50] noted that the water-bearing formations in the western Nile Delta were Recent, Pleistocene, Pliocene, Miocene, and Oligocene aquifers. Gomaa [50] showed that all the western Nile Delta reservoirs were recharged from the Nile Delta Quaternary reservoir.
Abdel Baki [48] and Diab and Dahab [51] stated that the Rosetta branch of the Nile and the El Rayah, El Behiri, and El Rayah El Nasseri canals cut through sands, and these authors noted that these canals have a direct connection with the Quaternary aquifer and play an important role in the water regime of the area. El Sheikh [52] mentioned that the general groundwater flow north of Wadi El-Natrun is from the south and southeast to the direction of the Wadi El-Natrun depression. He added that the Nile Delta reservoir is the most important recharging source for the southern part of the area, as well as being an important source of seepage from the surface water system. Embaby [53] noted that if irrigation systems and management were to be improved, soil surface and groundwater salinization would be reduced. He suggested installing an artificial drainage system to avoid the problem of waterlogging. The groundwater in the Quaternary aquifer generally exists in a free water table condition. The depth of the fresh water body, which lies under a saline water body, decreases toward the west of the area.
Based on a geoelectric resistivity technique, Nawar [54] found that the depth to the fresh water-bearing zone increased from the southwest towards the northeast in the Nile Delta area. The resistivity of the fresh water bearing-zone also increased from the southwest towards the northeast. He added that the general groundwater flow was from the southern parts (recharge area) to the northern and northeastern (discharge) parts of the Nile Delta area. Fouad and Zhi [55] stated that because of the direct hydraulic contact between surface water bodies and the Nile Delta aquifer, any change in the flow and water table would affect the groundwater levels and the regional water balance, owing to surface water/groundwater interaction and the complex flow system. They found that the highest water levels in the northwestern parts of the area were due to the thinness of the aquifer. The total amount of groundwater taken for irrigation is larger than the groundwater recharge, and this factor, will, in the long term, undermine the capacity and sustainability of the aquifer, and will lead to saltwater intrusion.
Abdel-Raouf and Abdel-Galil [56] have stated that the thickness of the Pleistocene aquifer is 200 m in the central parts and increases toward the north, reaching 350 m, while the thickness decreases toward the south, thinning out in the Wadi El-Natrun area. The saltwater intrusion increases toward the northern and southern portions owing to seawater intrusion and the shallowness of the Miocene aquifer. El Arabi and Morsy [57] have stated that the regional flow direction in the Nile Delta area is from south to north. In areas with high recharge from local reclamation water conveyors in old reclamation projects that use surface water, groundwater mounds exist owing to the downward seepage of excess irrigation water and leakage from irrigation.
Salem et al. [58] investigated the hydrogeochemical changes accompanying reclamation processes in the small Abu Mina basin, which is part of the western Nile Delta region. These authors compared the groundwater data in pre-reclamation (1974) and post-reclamation (2008) periods, and found that the groundwater seemed to have been subjected to many changes: a rise in water level, modification of the flow system, improvement of water quality, and the addition of new salts through dissolution processes.
Salem and El Bayumy [59] studied the groundwater aquifer in the area east of Wadi El-Natrun and they stated that
The studied groundwater flows from the east and north directions where the surface water sources are located to the west and south directions. Wadi El-Natrun is a natural discharge area for the groundwater and the hydraulic gradient increases gradually from east to west which could be related to topographic and fault effects. Water table change between 1960 and 2010 showed a drawdown of groundwater levels reached about 25 m mainly in the southern part of the region. Seepage from the irrigation channel and excess uses of surface irrigation water at the northern part of the area lead to water level rise about 5 m to the east and 10 m to the west. In the southern part, to avoid wells drying and aquifer depletion, it is recommended to regulate the pumping rate of the current wells and construct surface channel network to minimize groundwater pumping.
As mentioned by Salem and Osman [36, 42], the groundwater in the investigated region is contained in sediments of the Quaternary (Recent and Pleistocene), Neogene (Pliocene and Miocene), and Oligocene ages (Fig. 1b, c). The main aquifer in the area is the Pleistocene aquifer, where its thickness increases to the east and northeast, reaching 300 m in the northeastern part (see Fig. 1a). The sediments of the Holocene age are located in the western part of the area and are composed of recently formed aeolian sand conglomerations (4- to 10-m-thick) with intercalations of calcareous deposits (Fig. 4b). The Pleistocene aquifer includes Nile gravels and sands with thin clay intercalations (Fig. 1b, c). The underlying sediments of this aquifer are clay-rich Pliocene and Miocene sediments.
Fig. 4
Spatial distribution map of hydraulic heads in the study area. Modified from [42]
The Quaternary aquifer is unconfined in the western part of the El-Nubaria Canal, while it is semi-confined in the eastern part, owing to the effect of the clay cover of the young alluvial plain where the old cultivated land is located (Fig. 1c). The main groundwater recharge source of the present aquifer is seepage from the constructed canal and drain network [48]. According to Salem and Osman [36], the water table changes from 2 mbsl in the northern parts (Abu El Matameer zone) up to a level of 27 mbsl in the southwestern direction (north of Wadi El-Natrun) (Fig. 4). The groundwater mainly flows from the southwestern corner to the northern and northeastern directions. Local groundwater flow was noted in the southern part. An extra groundwater flow to Wadi El-Natrun in the southwestern course was also discerned.
Salem and Osman [60] studied the freshwater and saltwater interaction in the study area using a geoelectrical survey, and they stated that “two zones of groundwater quality were delineated: the slightly freshwater zone in the southern part, with resistivity range of 15–90 Ω m, and the brackish water to saltwater zone, with a very low resistivity of <2 Ω m in the northwestern parts. In addition to tracing the freshwater-seawater contact zone, these authors detected three geoelectric layers. The surface layer was composed of sand, clay, and silt. Its resistivity ranged from 5 to 512 Ω, and the thickness varied from 1 to 25 m. The aquifer layer was composed of sand with intercalations of clay, with resistivity ranging from 15 to 90 Ω and thickness ranging from 25 to 120 m. The clay layer resistivity ranged from 2 to 15 Ω and thickness ranged from 2 to 69 m”.
Abdelhameed et al. [61] investigated the sedimentological characteristics of the Quaternary aquifer in the study area and they stated that “the majority of the samples are medium to coarse clayey sand, moderately sorted and coarse skewed. This may support the multi-directional depositional currents. Wind action influences skin of the sediments. The samples lie within the field of river processes. Mineralogical analysis by X-ray diffractometry revealed that smectite is the most abundant clay mineral, followed by kaolinite, whereas illite is the less abundant clay mineral. The essential carbonate minerals are calcite and dolomite whereas non-carbonate minerals include quartz, feldspar, and hematite.”
4 Methodology
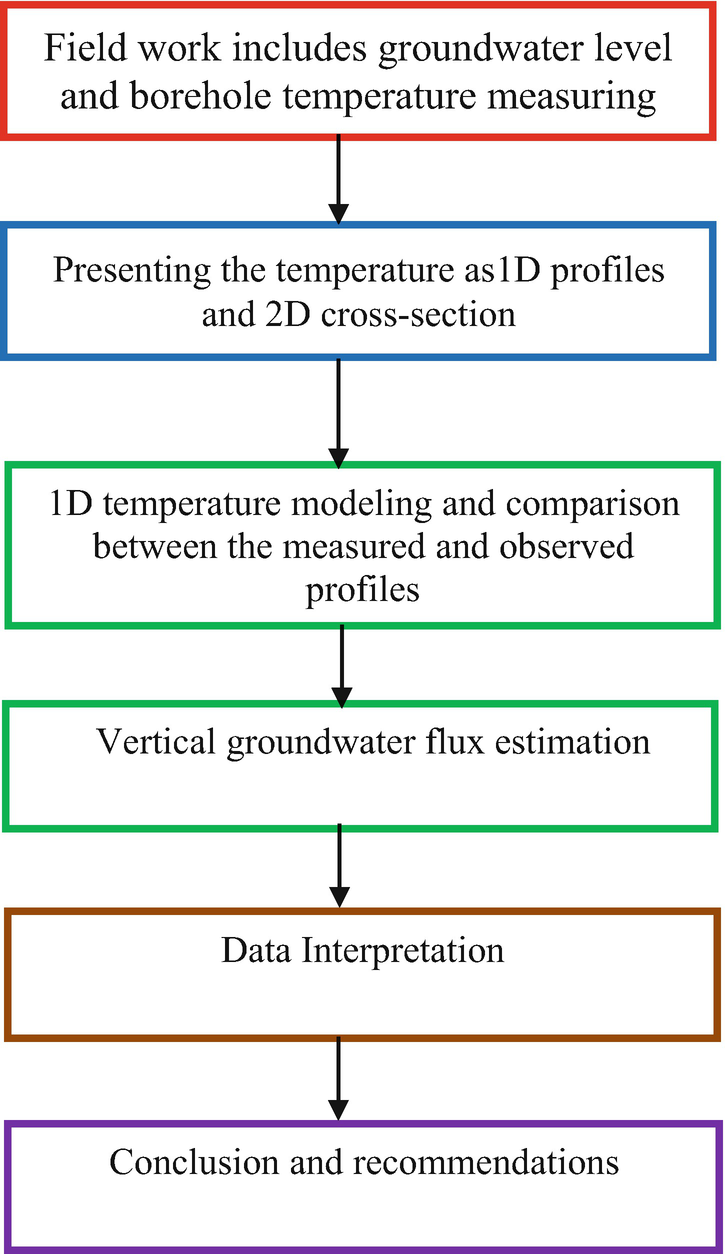
A flow-chart illustrating the methodology of the present work is shown in Fig. 5. During 2010, the temperature was measured in 47 boreholes, at 5 to 10 m depth intervals, (Fig. 6), using thermistor thermometers, which have an accuracy of 0.1°C. Well screens (average length 20 m) were placed at the bases of the wells. The borehole depths ranged from 22 to 200 m (usually 80–120 m) and their average diameter was 20 cm. The wells used were encased, and were drilled at least 1 year before the temperature logging was performed. It is assumed that groundwater temperature in the boreholes is the same as the temperature of the aquifer around the well, where a physical temperature balance occurs between the well water temperature and the formation temperature. The measured borehole temperatures were plotted, and were classified as the Damanhour group and the Wadi El-Natrun group, and then 2D cross-sections were created parallel or perpendicular to the flow direction. Then 1D modeling was performed according to the methods mentioned by Carslaw and Jaeger [62] and Taniguchi et al. [15, 23]. The groundwater vertical velocity was then estimated and spatially plotted on the map of the area. The data used in this work were used by Salem and Osman [36] to model the subsurface thermal regime in the study area in two dimensions.
Fig. 5
Flow-chart illustrating the working steps of the current study. 1D one-dimensional
Fig. 6
Borehole location map. The yellow color background represents the recently reclaimed desert land and the green color represents the old cultivated land. Wadi El-Natrun and Damanhour stations are plotted. The brown lines indicate the locations of the hydraulic heads and temperature cross-sections
5 Climate
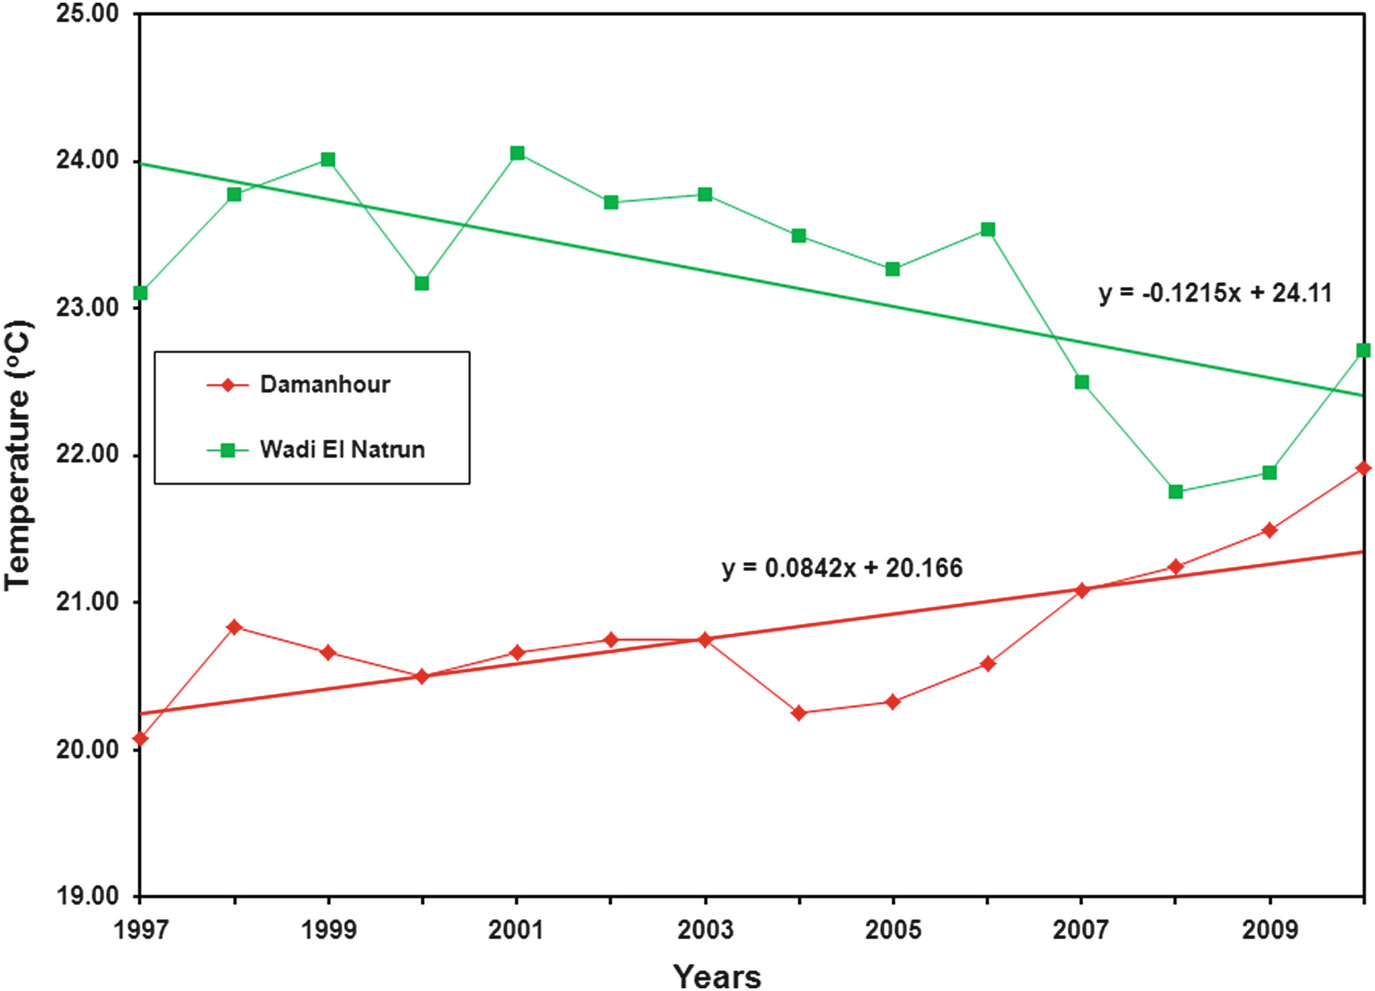
The climate in Egypt is dry, characterized by a hot summer and a short warm winter. Damanhour and Wadi El-Natrun are the two accessible stations in the climate investigation range, and their geographical positions are shown in Fig. 6. Changes in the mean annual air temperature with time are presented in Fig. 7. The annual average air temperatures at Wadi El-Natrun station and Damanhour station are 23.15°C and 20.37°C, respectively. During the 14 years before we carried out our study, the annual recorded air temperatures had a warming pattern at the Damanhour station and a cooling pattern at the Wadi El-Natrun station. The warming pattern detected at Damanhour station could be attributed to a general worldwide environmental change. The cooling pattern at Wadi El-Natrun station could be related to the effect of agricultural reclamation in the desert part of the western Nile Delta during the past few decades [36, 37, 59]. The estimated mean annual surface air temperature changes are 0.044°C/year in the Damanhour area and 0.03°C/year in the Wadi El-Natrun area.
Fig. 7
Surface air temperature changes in the study area. Modified from [36, 37]
6 Results
6.1 One-Dimensional Temperature Profiles
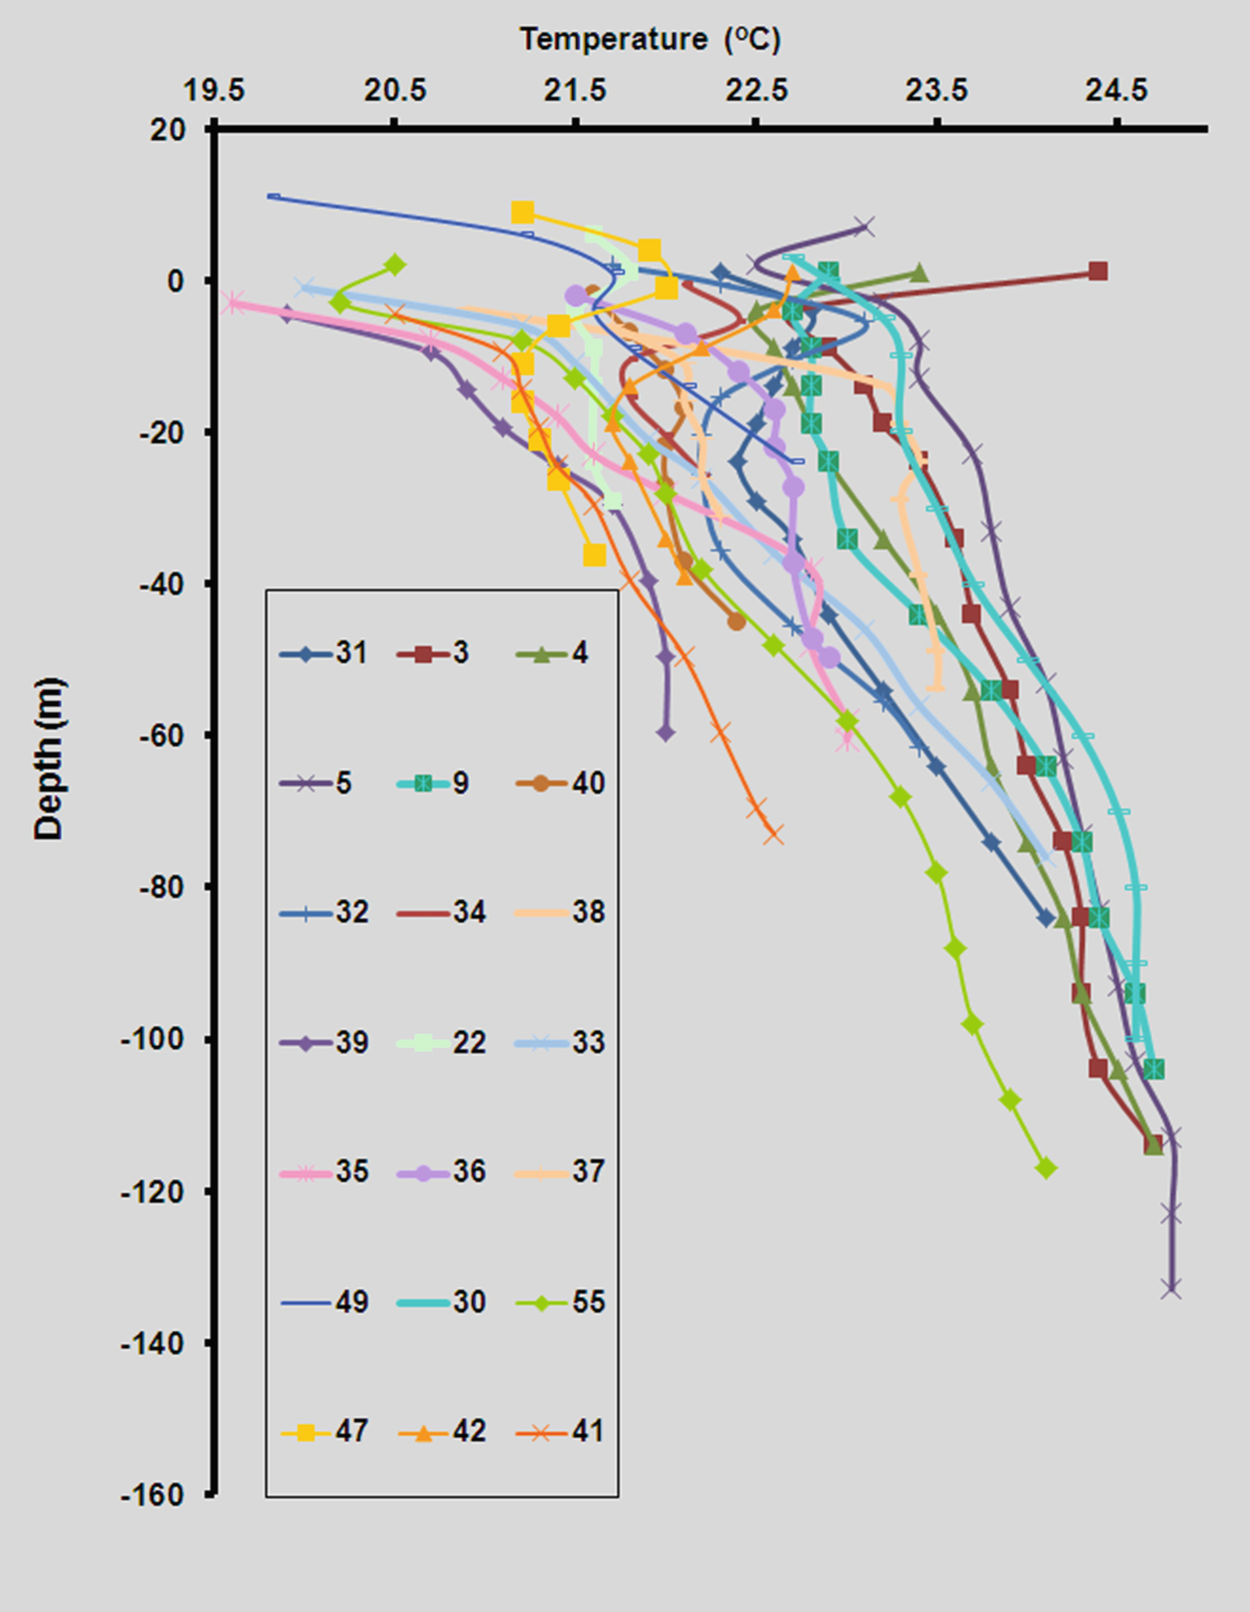
The measured borehole temperature profiles were classified into two groups (Figs. 8 and 9) according to the locations of the wells (Fig. 6) and the groundwater flow system (Fig. 4), The wells in the first group are located in the reclaimed western desert area (El-Nubaria canal) where the recharge area is located. The wells in the second group are in the old developed terrain of the eastern El-Nubaria trench, where the groundwater mostly discharges. In general, the measured temperatures in the second group were lower than those in the first group. In contrast to the second group of wells, the first group had a lower geothermal gradient, ranging from 0.0145 (well 29) to 0.0326°C/m (well 21), with an average value of 0.0198°C/m. The geothermal gradient in the second group ranged from 0.016 (well 47) to 0.049°C/m (well 38), with an average of 0.0343°C/m.
Fig. 8
Temperature depth profiles representing the subsurface temperatures in the newly reclaimed desert land
Fig. 9
Temperature depth profiles representing the subsurface temperatures in the old agricultural lands
Groundwater flow causes a forced convective heat flow that brings down temperatures underneath the main groundwater recharge region, with an undisturbed thermal pattern underneath regions of horizontal groundwater flow, and warming underneath the groundwater discharge regions. Accordingly, the present information points to an abnormal temperature framework, where the recharge area profiles had higher temperatures (first group) than those in the discharge zone (second group). This unusual subsurface thermal framework could be identified by the differences in the average annual air temperatures, with the temperature in the recently reclaimed desert land being higher (23.15°C at Wadi El-Natrun station) than that in the old horticultural land (20.37°C at Damanhour station). The geothermal gradient is considered to be the principal thermal parameter for distinguishing between the recharge and the discharge zones, and the present geothermal gradient of the recharge zone was lower than that of the discharge zone, as mentioned before.
6.2 Vertical Two-Dimensional Subsurface Temperature Distribution
Seven vertical 2D subsurface temperature distributions were selected (Fig. 6). Three cross-sections were matched with the groundwater flow direction (southwest-northeast), while four cross-sections were perpendicular or parallel to the groundwater flow direction (southeast-northwest).
6.2.1 Southwest-Northeast Cross-Sections
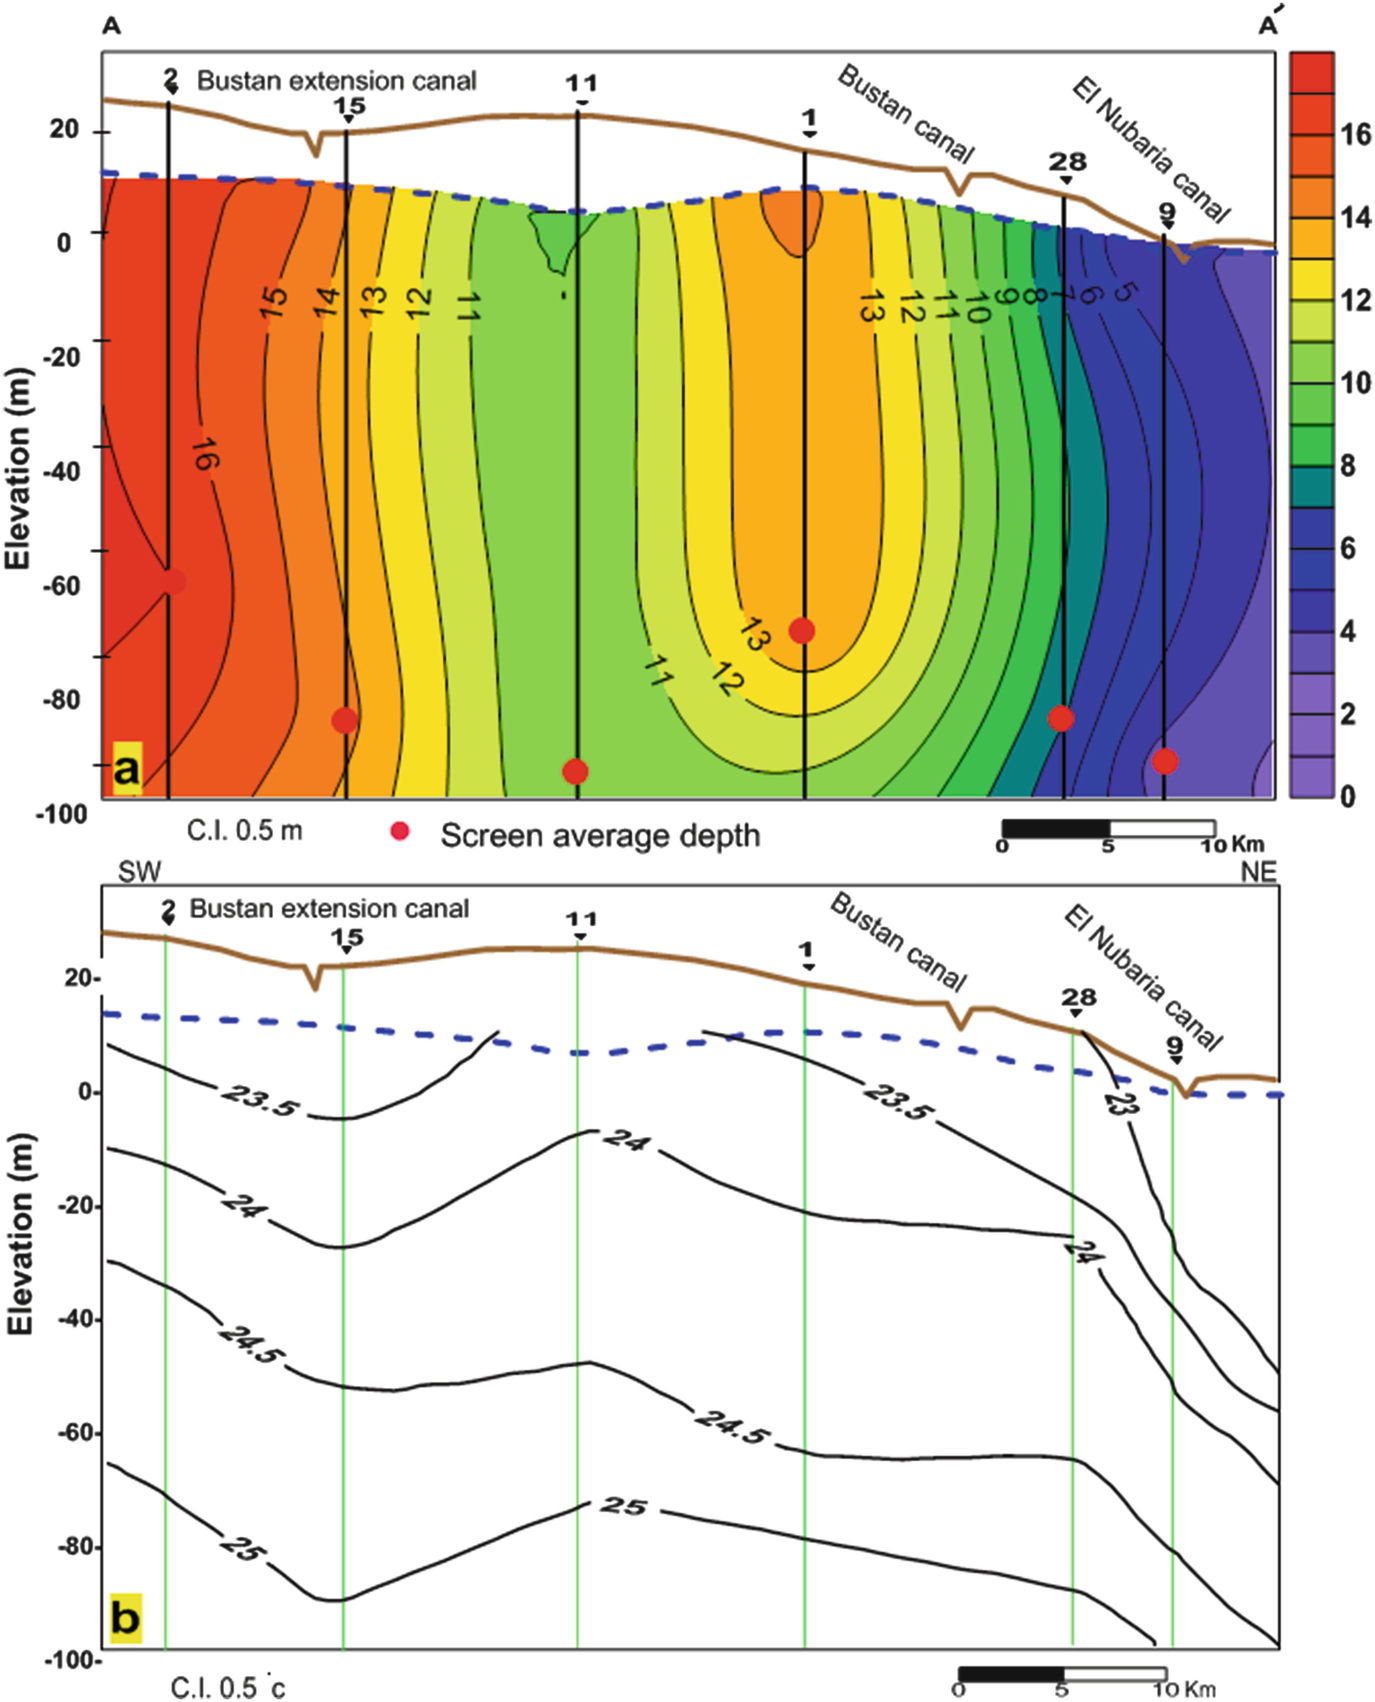
The vertical 2D distribution of the hydraulic heads along cross-section AA’ (Fig. 10a) indicates that the groundwater flow is from southwest to northeast, with the existence of a general local recharge area at the site of well 1 and a local discharge area at the site of well 11. The temperature distributions along the same section (Fig. 10b) show high temperatures in the recharge area compared with those in the discharge area. High temperatures were encountered in the local discharge area at the site of well 11, while low temperatures were noted in the local recharge area at the site of well 1.
Fig. 10
Vertical 2D hydraulic heads (a) and subsurface temperature (b) distributions along the cross-section AA’. Temperature values are in °C and the vertical lines indicate the boreholes
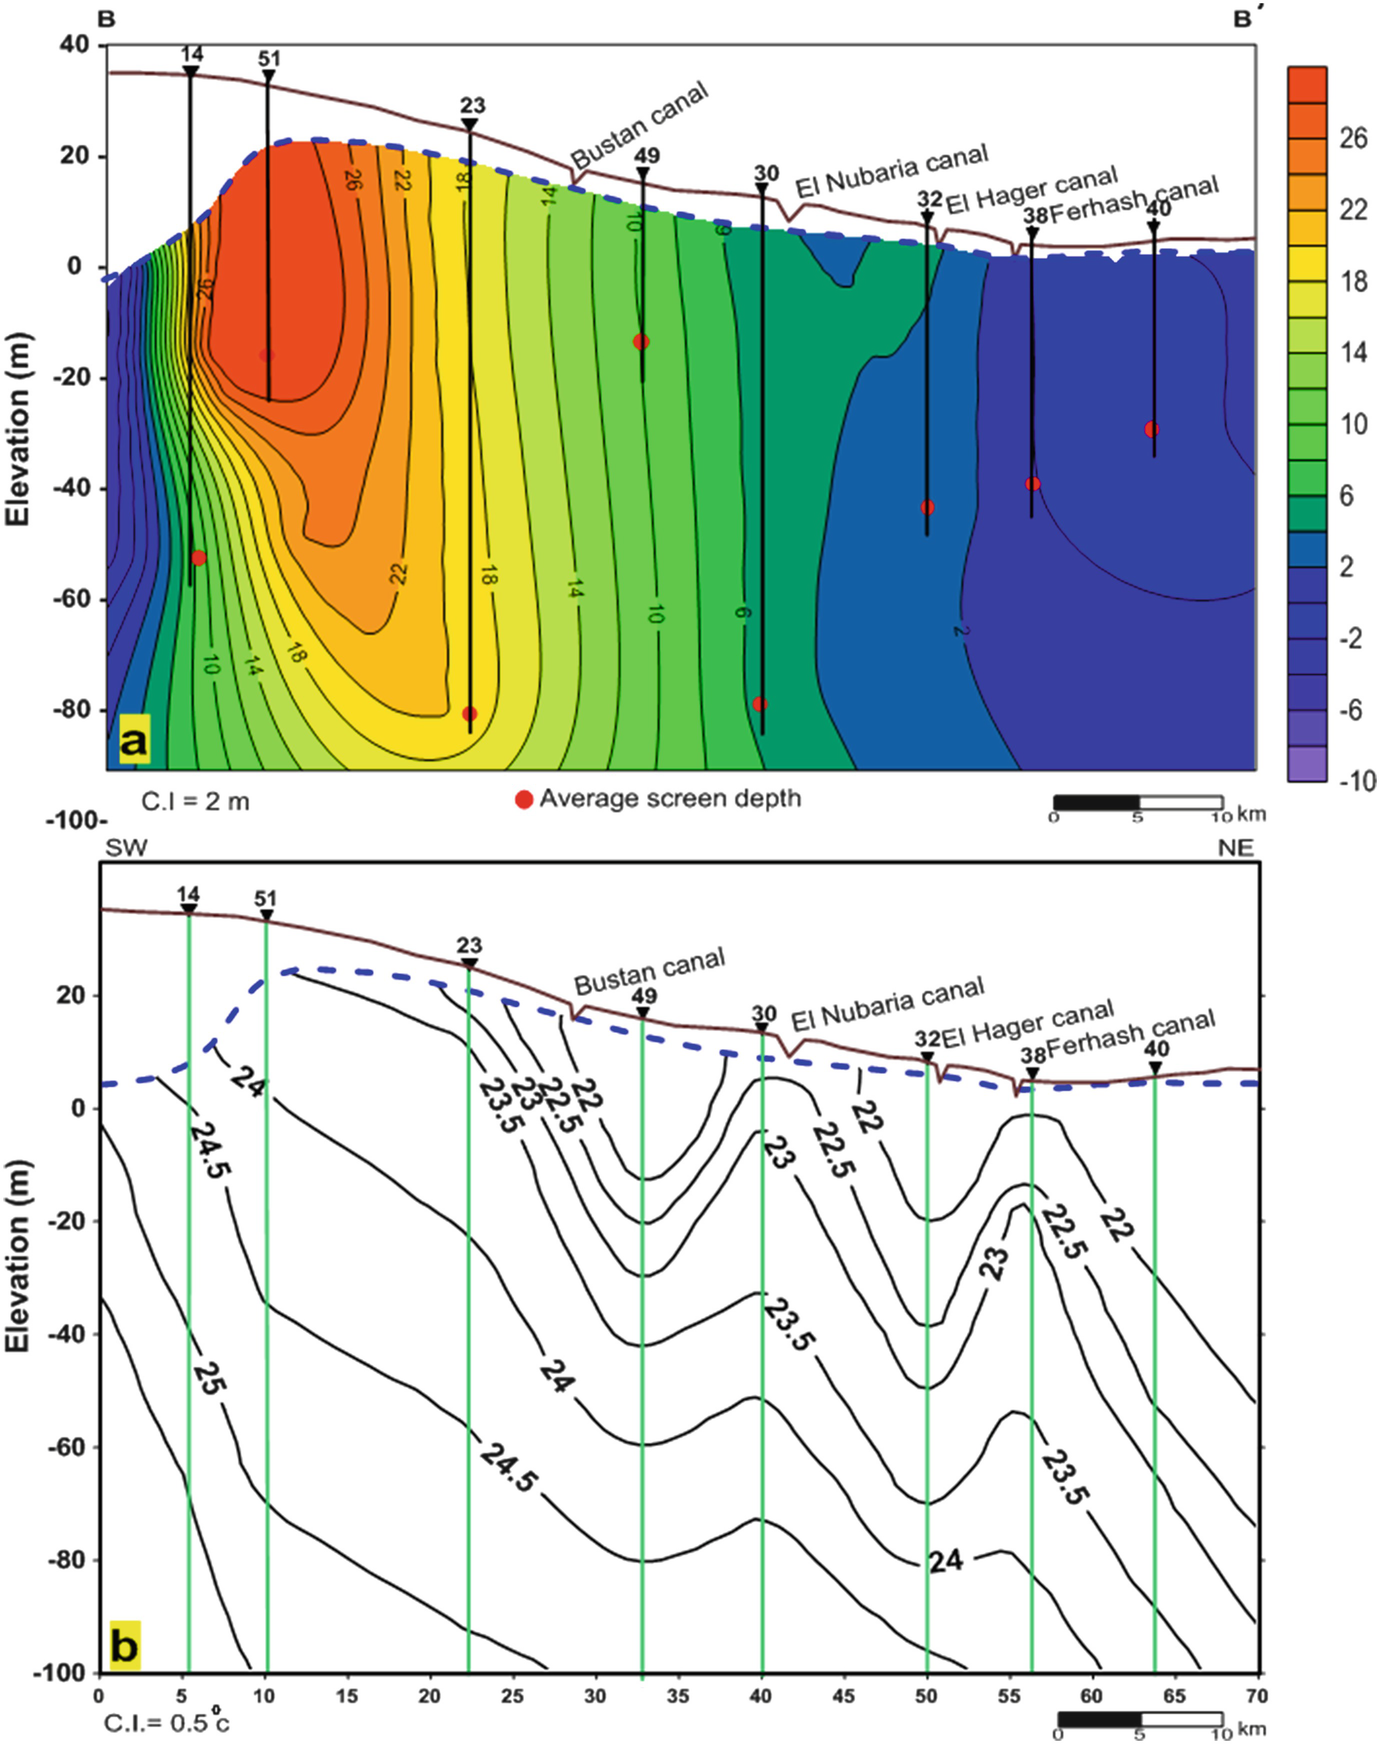
As shown in Fig. 11a, there are two main flow systems; one towards the southwest to the Wadi El-Natrun direction, and the other trending to the northeastern direction, which has two local recharge areas at well sites 49 and 32 and two local discharge areas at well sites 30 and 38. Figure 11b shows the vertical 2D temperature distribution along the cross-section BB. The water discharged to the Wadi El-Natrun direction has a higher temperature than that of the recharge area. Isotherms are deeper along the regional flow system from the southwest to the northeast. Isotherms show higher values in the local discharge areas under the El-Nubaria and Ferhash canals and lower values in the local recharge areas under the El-Bustan and El-Hager canals. This means that, in these locations, the El-Nubaria and Ferhash canals are gaining streams, while the El-Bustan and El-Hager canals are losing streams.
Fig. 11
Vertical 2D hydraulic heads (a) and subsurface temperature (b) distributions along the cross-section BB’. Modified from [36]. Temperature values are in °C and the vertical lines indicate the boreholes
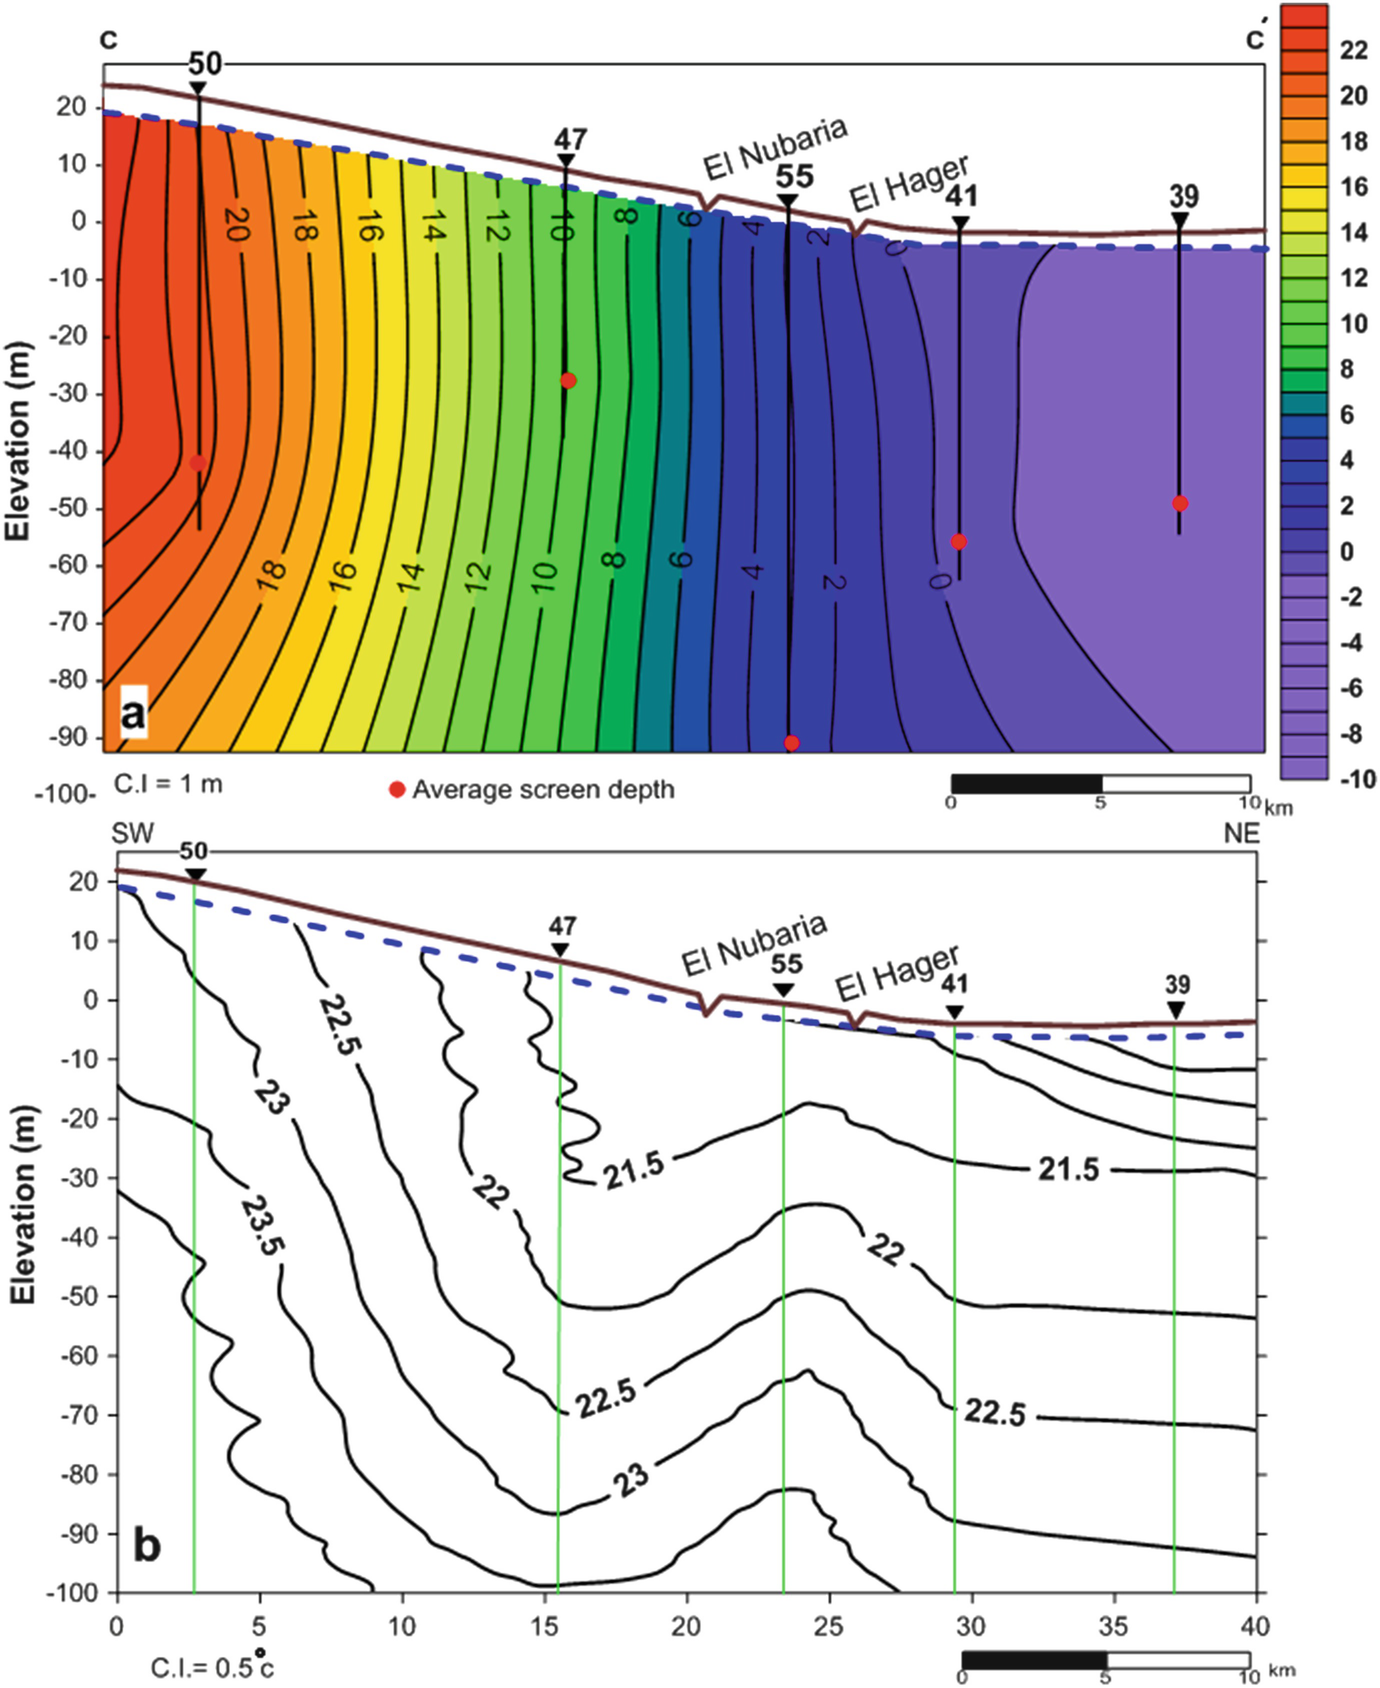
Along the CC’ cross-section, the hydraulic heads are high in the southwestern direction, owing to the higher topography, and they are decreased in the northeast, where the lowlands are located (Fig. 12b). Only one flow system from southwest to northeast is noted. Higher isothermal line values are recognized in the recharge area, while horizontal isothermal lines are noted in the northeastern direction between well sites 41 and 39 (Fig. 12b). Such horizontal isotherms indicate almost no flow conditions, a condition which may be caused by seawater intrusion. However, the El-Nubaria canal at this location acts as a losing stream, and the cooling effect of the seeped water from this canal is recorded in the area of well site 47.
Fig. 12
Vertical 2D hydraulic heads (a) and subsurface temperature (b) distributions along the cross-section CC’. Temperature values are in °C and the vertical lines indicate the boreholes
6.2.2 Southeast-Northwest Cross-Sections
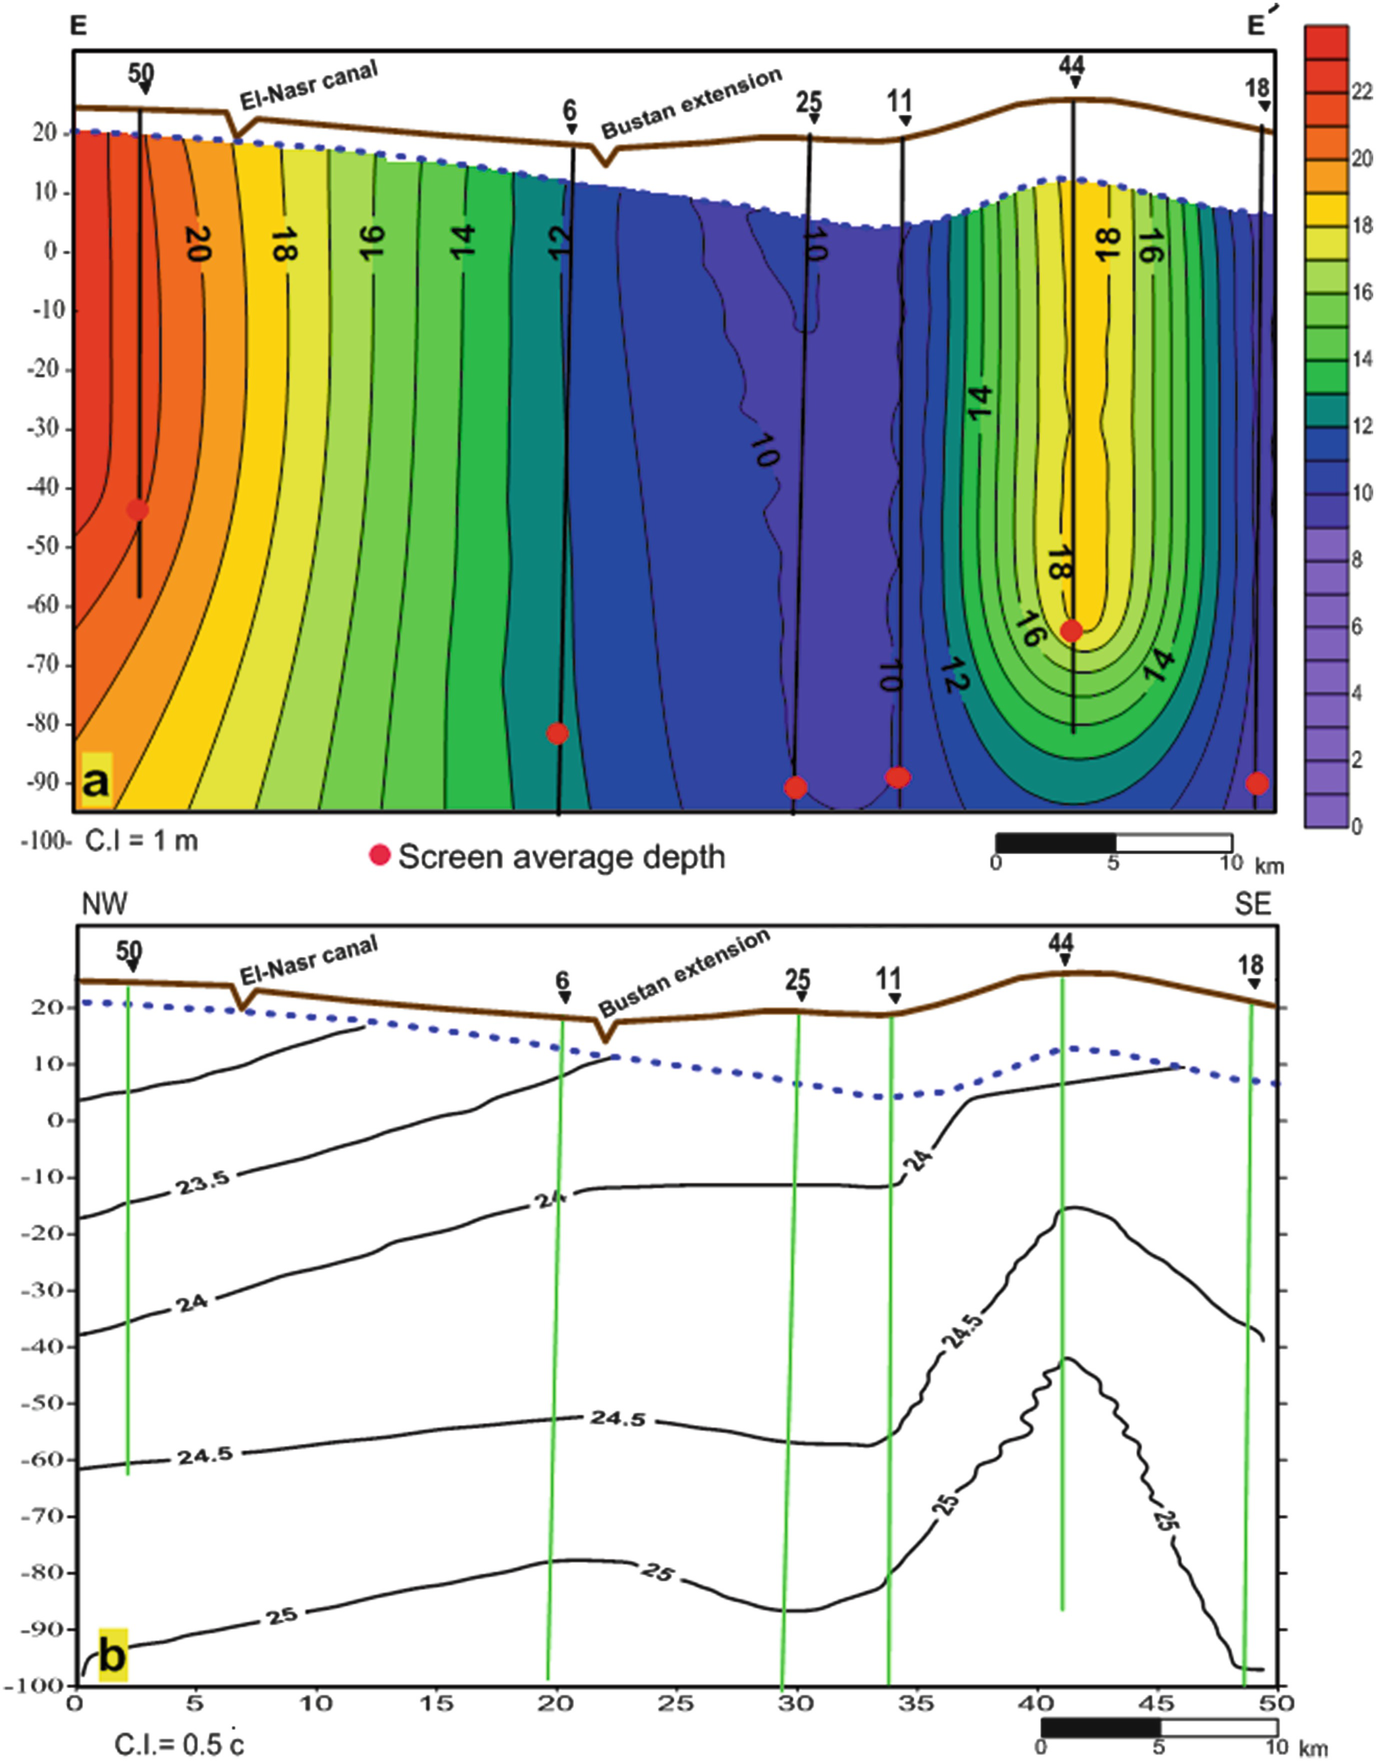
The cross-section DD’ (Fig. 13a) shows the vertical 2D distribution of the hydraulic heads. Hydraulic heads are high in the southwestern direction and decrease to the southeast toward the lowlands. The vertical 2D temperature distributions along the cross-section DD’ (Fig. 13b) show a cooling effect on the subsurface temperature owing to groundwater seepage from the El-Bustan extension and El-Nasr canals. Hydraulic heads are high in the northwest of the cross-section EE’ owing to the location of the main recharge area and water seepage from the El-Nasr canal (Fig. 14a). The water table elevation decreases in a southeastern direction with a high local value at well site 44. Low isothermal line values were recorded in the northwest in the proposed recharge area, whereas higher values were seen in the southeast, owing to groundwater discharge (Fig. 14b).
Fig. 13
Vertical 2D hydraulic heads (a) and subsurface temperature (b) distributions along the cross-section DD’. Temperature values are in °C and the vertical lines indicate the boreholes
Fig. 14
Vertical 2D hydraulic heads (a) and subsurface temperature (b) distributions along the cross-section EE’. Temperature values are in °C and the vertical lines indicate the boreholes
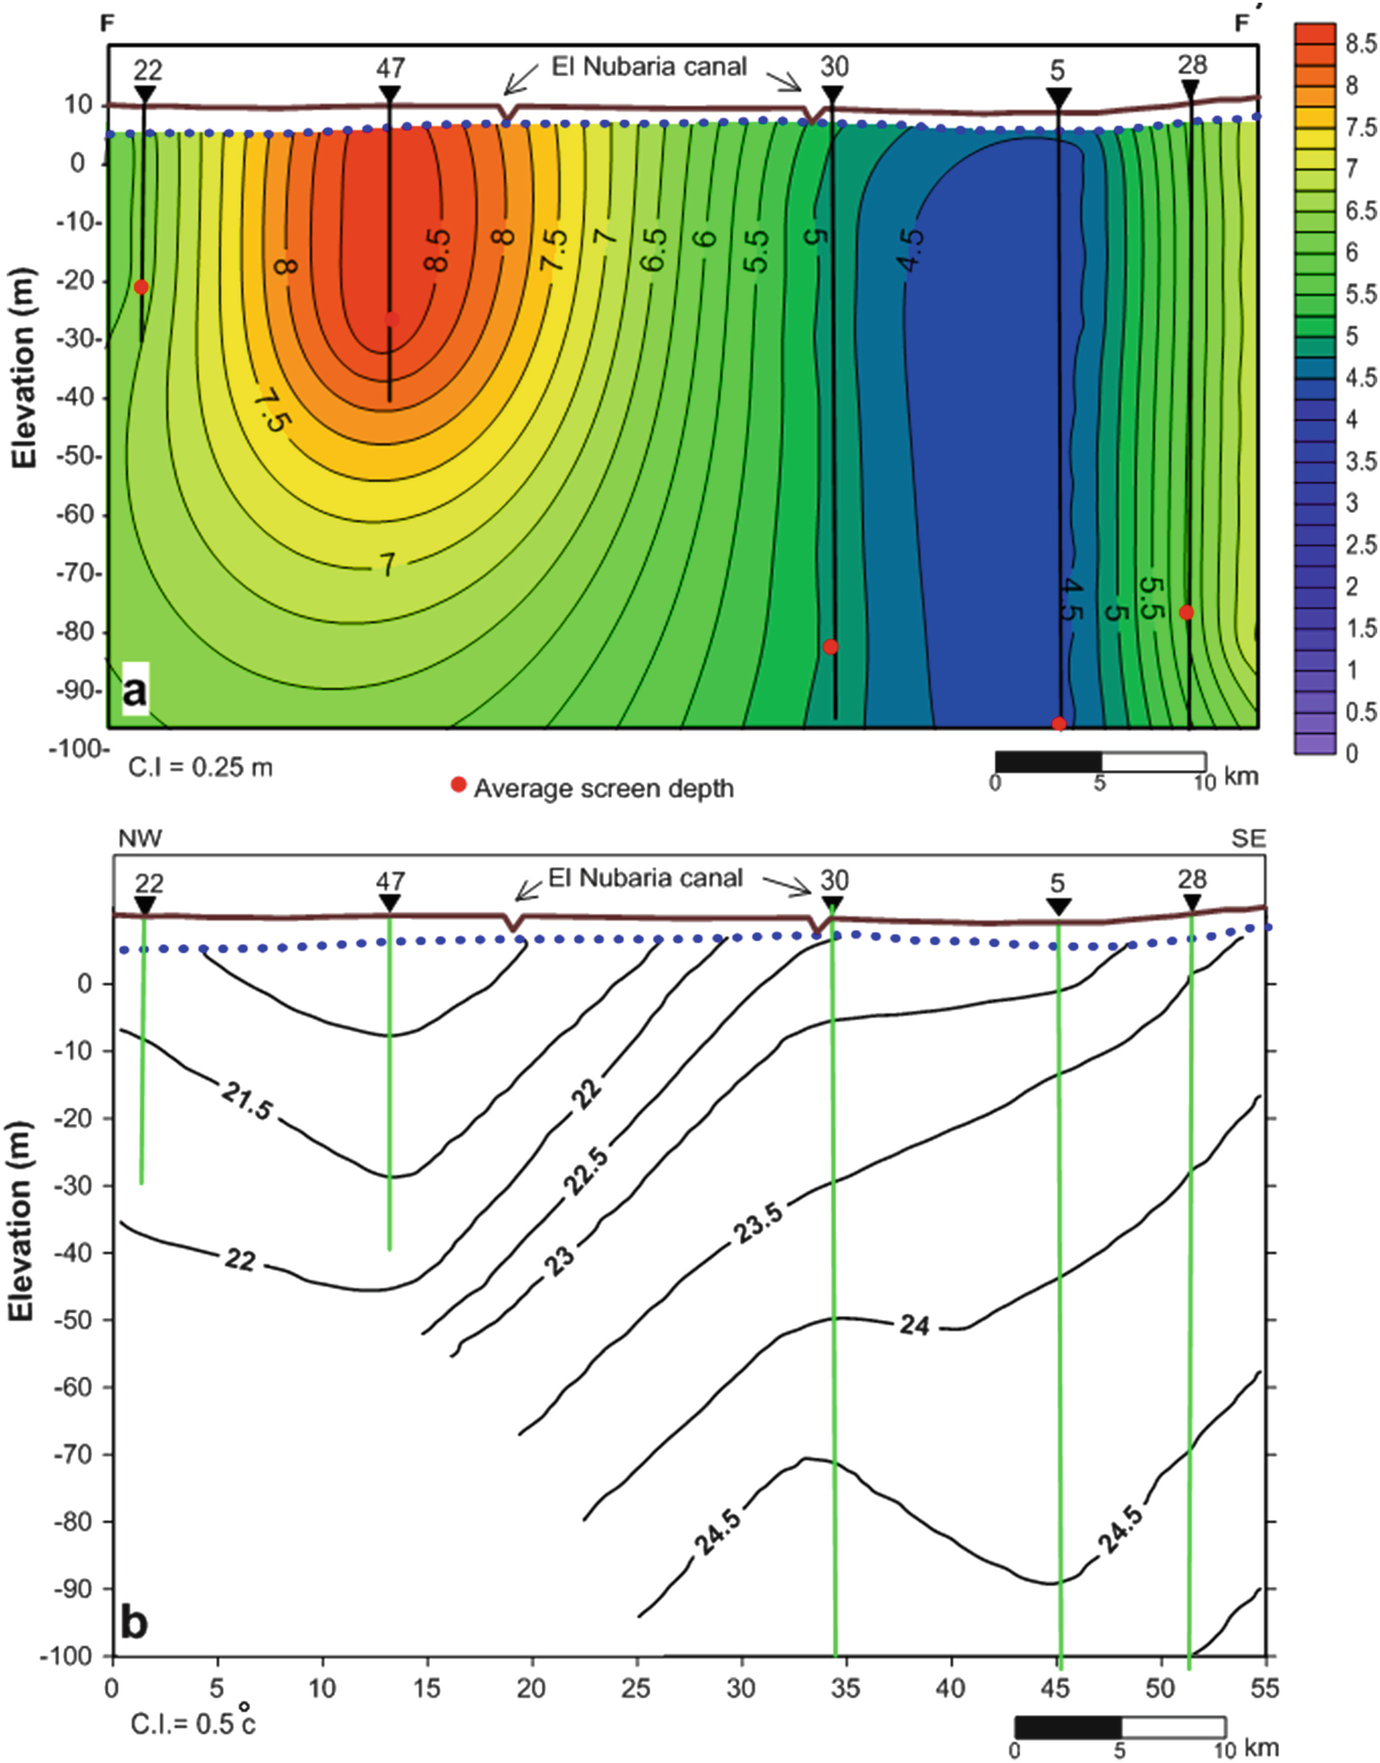
The vertical 2D distribution of the hydraulic heads along the FF’ cross-section (Fig. 15a) shows higher values of the hydraulic heads at well site 47 and a decrease toward well site 5. The higher water table might be related to the effect of the El-Nubaria canal and irrigation processes. The Subsurface temperature has low values under the area of higher hydraulic heads (Fig. 15b) owing to the recharge effect. Higher temperature isotherms are encountered in the southeastern parts, where the discharge process occurs (at well sites 5 and 28).
Fig. 15
Vertical 2D hydraulic heads (a) and subsurface temperature (b) distributions along the cross-section FF’. Temperature values are in °C and the vertical lines indicate the boreholes
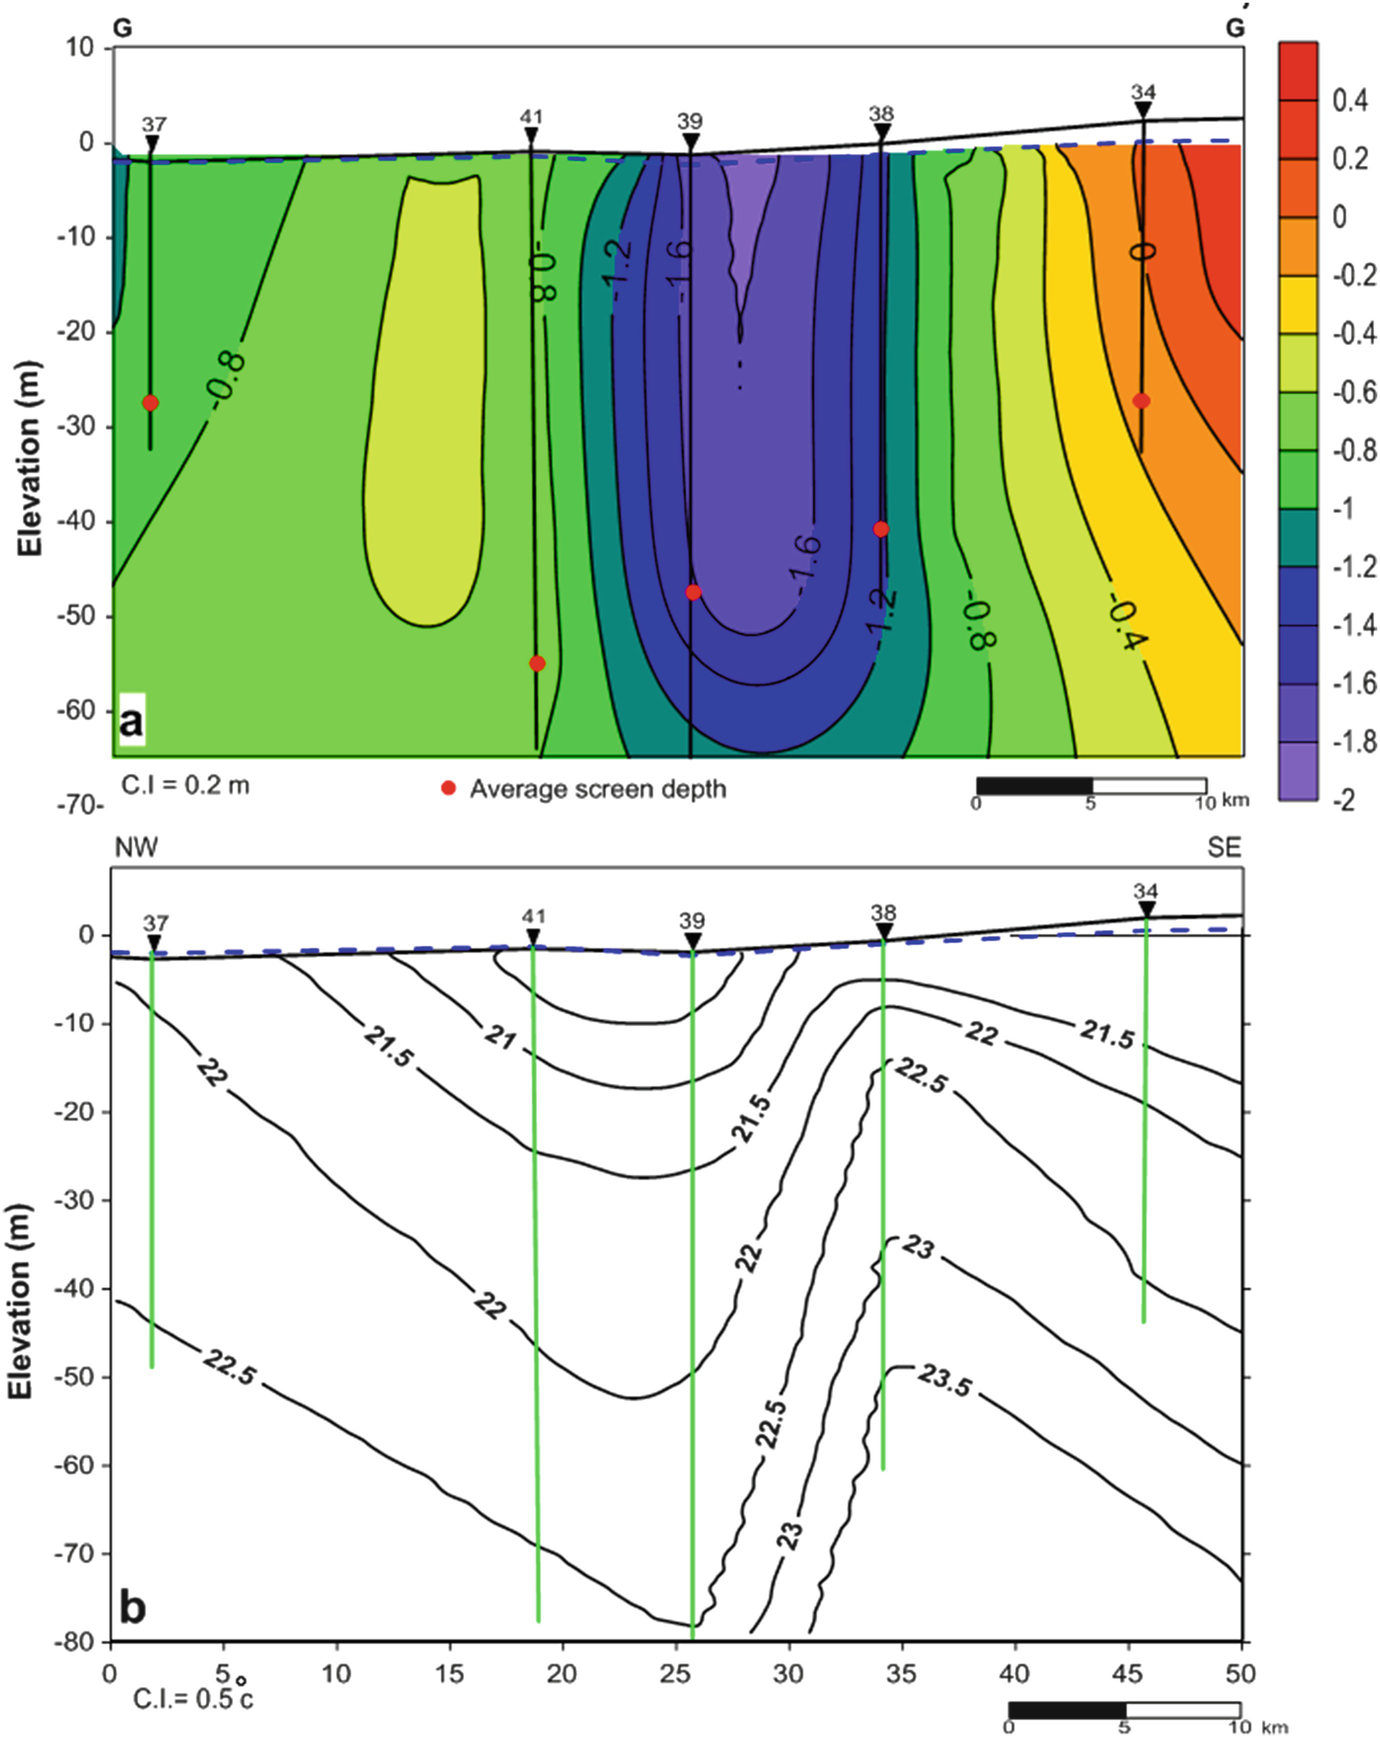
A local discharge area was noted in the cross-section GG’ between well sites 39 and 38, and higher potentiometric surface values were noted to the east, while low values were recorded to the west (Fig. 16a). In general, subsurface temperatures had lower values where the hydraulic heads had higher values (well site 34) and the subsurface temperatures had higher values where the hydraulic heads had low values (well site 37) (Fig. 16b). Local cooling and warming effects, owing to local recharge and discharge at well sites 41 and 39, and well site 34, respectively, were noted. The abrupt change in subsurface temperatures between well sites 34 and 38 could be related to a fault effect [37].
Fig. 16
Vertical 2D hydraulic heads (a) and subsurface temperature (b) distributions along the cross-section GG’. Temperature values are in °C and the vertical lines indicate the boreholes
6.2.3 Model Calculations
To analyze the temperature-depth profiles with heat advection owing to groundwater flow, subsurface temperatures have been calculated using different vertical groundwater fluxes. Carslaw and Jaeger [62] calculated the temperature using a 1D heat conduction–advection equation under the condition of a linear increase in surface temperature, as shown in Eq. (1):
(1)
where b is the rate of the surface temperature increase, t is the time after the semi-equilibrium condition [15, 23], To is the surface temperature, TG is the general geothermal gradient, and U = υcoρo/cρ, in which υ is the vertical groundwater flux, coρo is the heat capacity of the water, and cρ is the heat capacity of the aquifer, α is the thermal diffusivity of the aquifer, and erfc is the complementary error function. The modeling is limited to semi-infinite layers with only vertical conduction and convection, and vertical groundwater flux is assumed to be constant with depth.
Land use has an effect on surface air temperature. Therefore, we modeled borehole temperatures under reclaimed desert land and old cultivated land under different surface air temperatures and geothermal gradients. The boreholes in the reclaimed desert belong to Wadi El-Natrun station, and those of the old cultivated land belong to Damanhour station.
TG values were 0.0198 and 0.0343°C/m for the Wadi El-Natrun and Damanhour stations, respectively, and To values were 24.0 and 20.37°C for these two stations, respectively. For the whole area, the thermal diffusivity (α) was 6 × 10⁻⁷ m2/s. For a t value of 50 years, the b values for Wadi El-Natrun and Damanhour were −0.03 and 0.044, respectively. Therefore, the modeled profiles of Wadi El-Natrun show a near surface cooling pattern, while those of Damanhor exhibit a near surface warming pattern. Temperature-depth profiles were computed using the above equation for different vertical groundwater flux values (U), according to Taniguchi et al. [63].
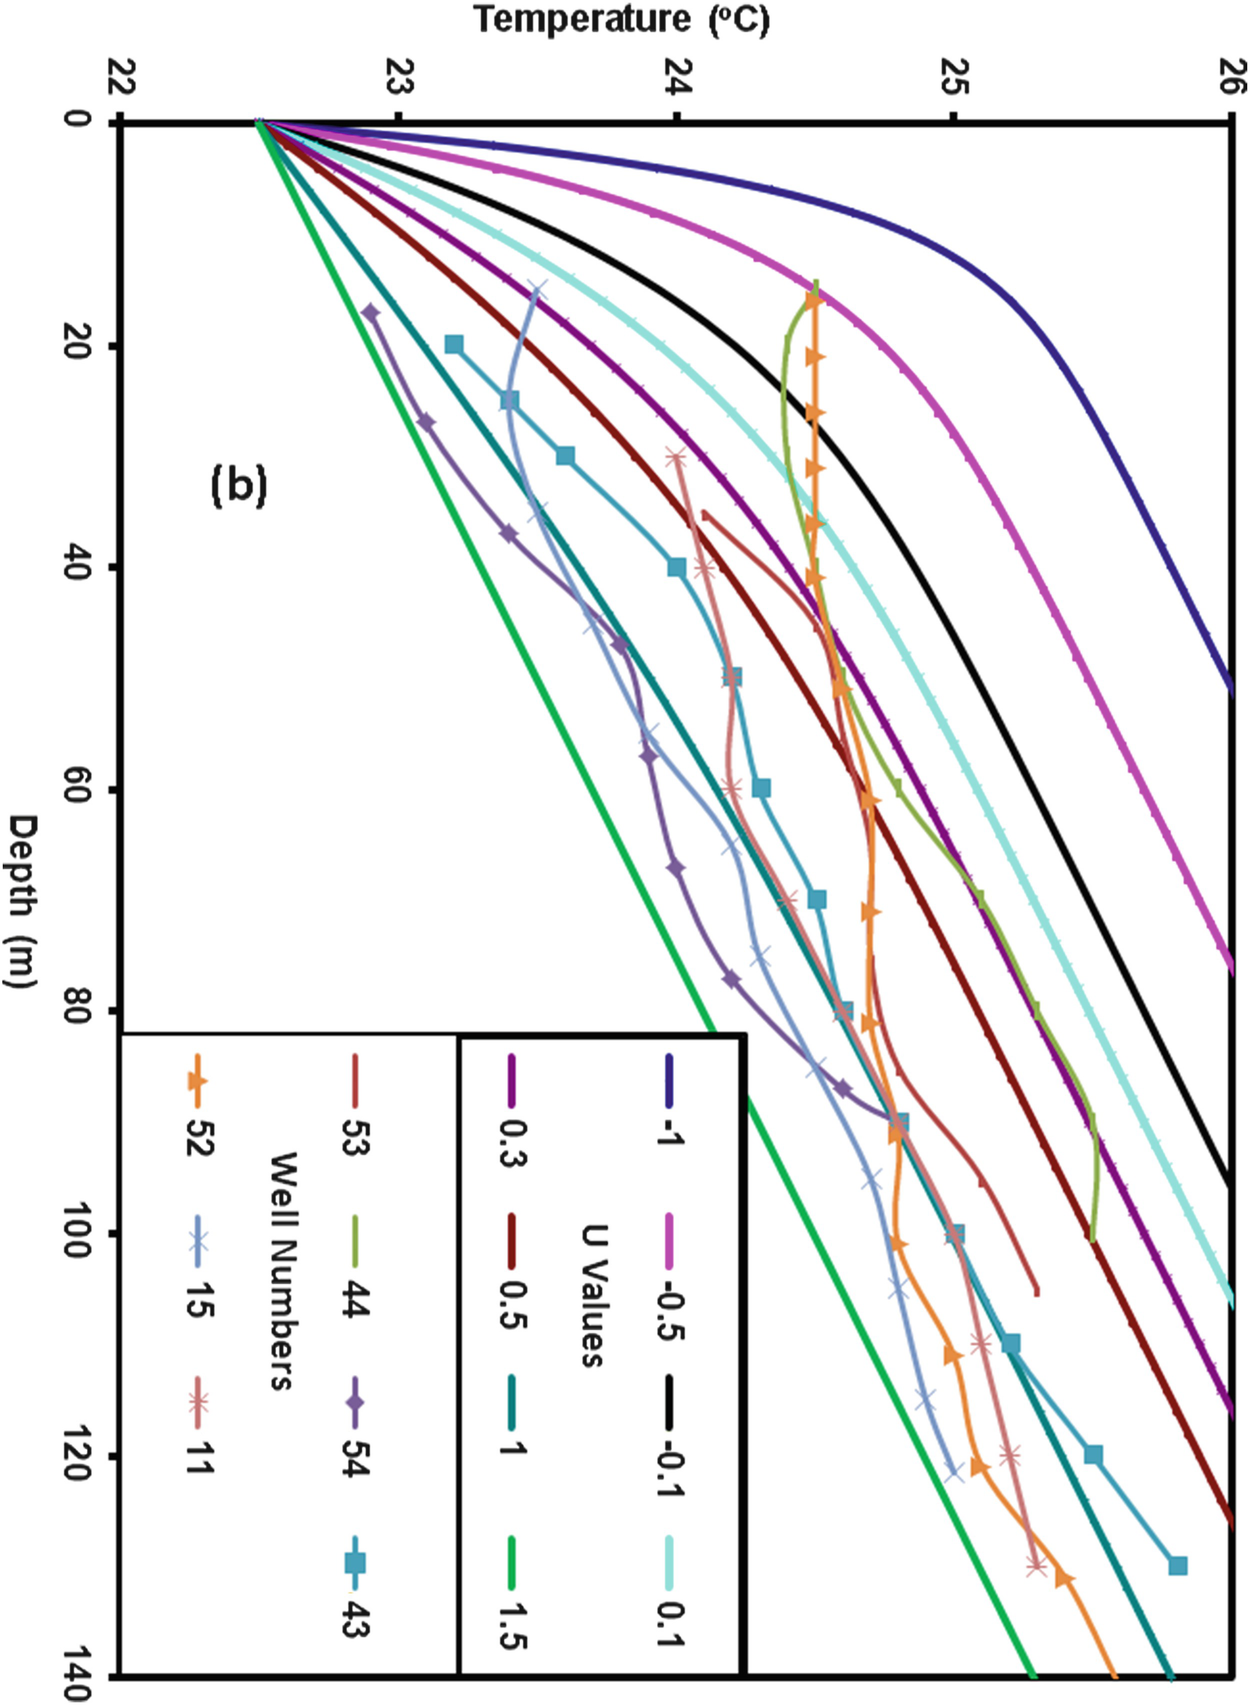
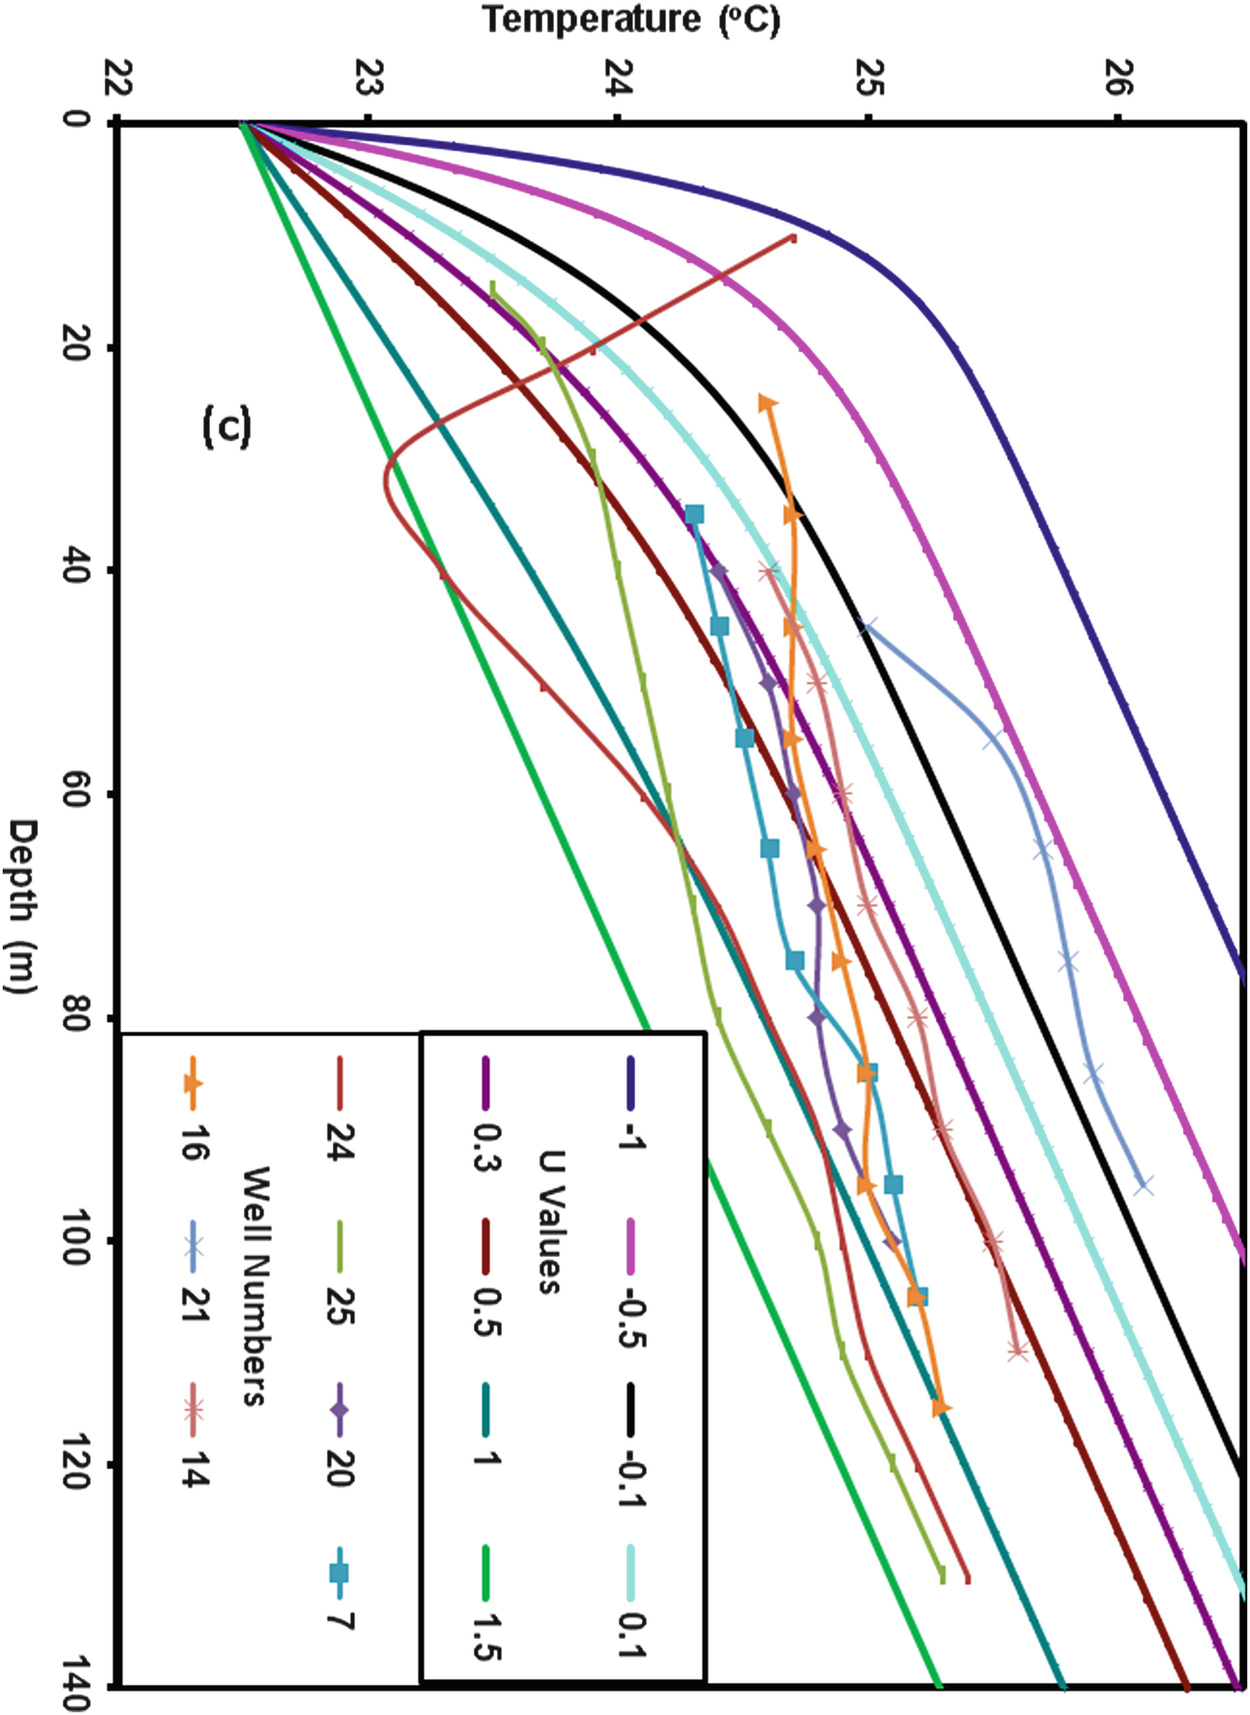
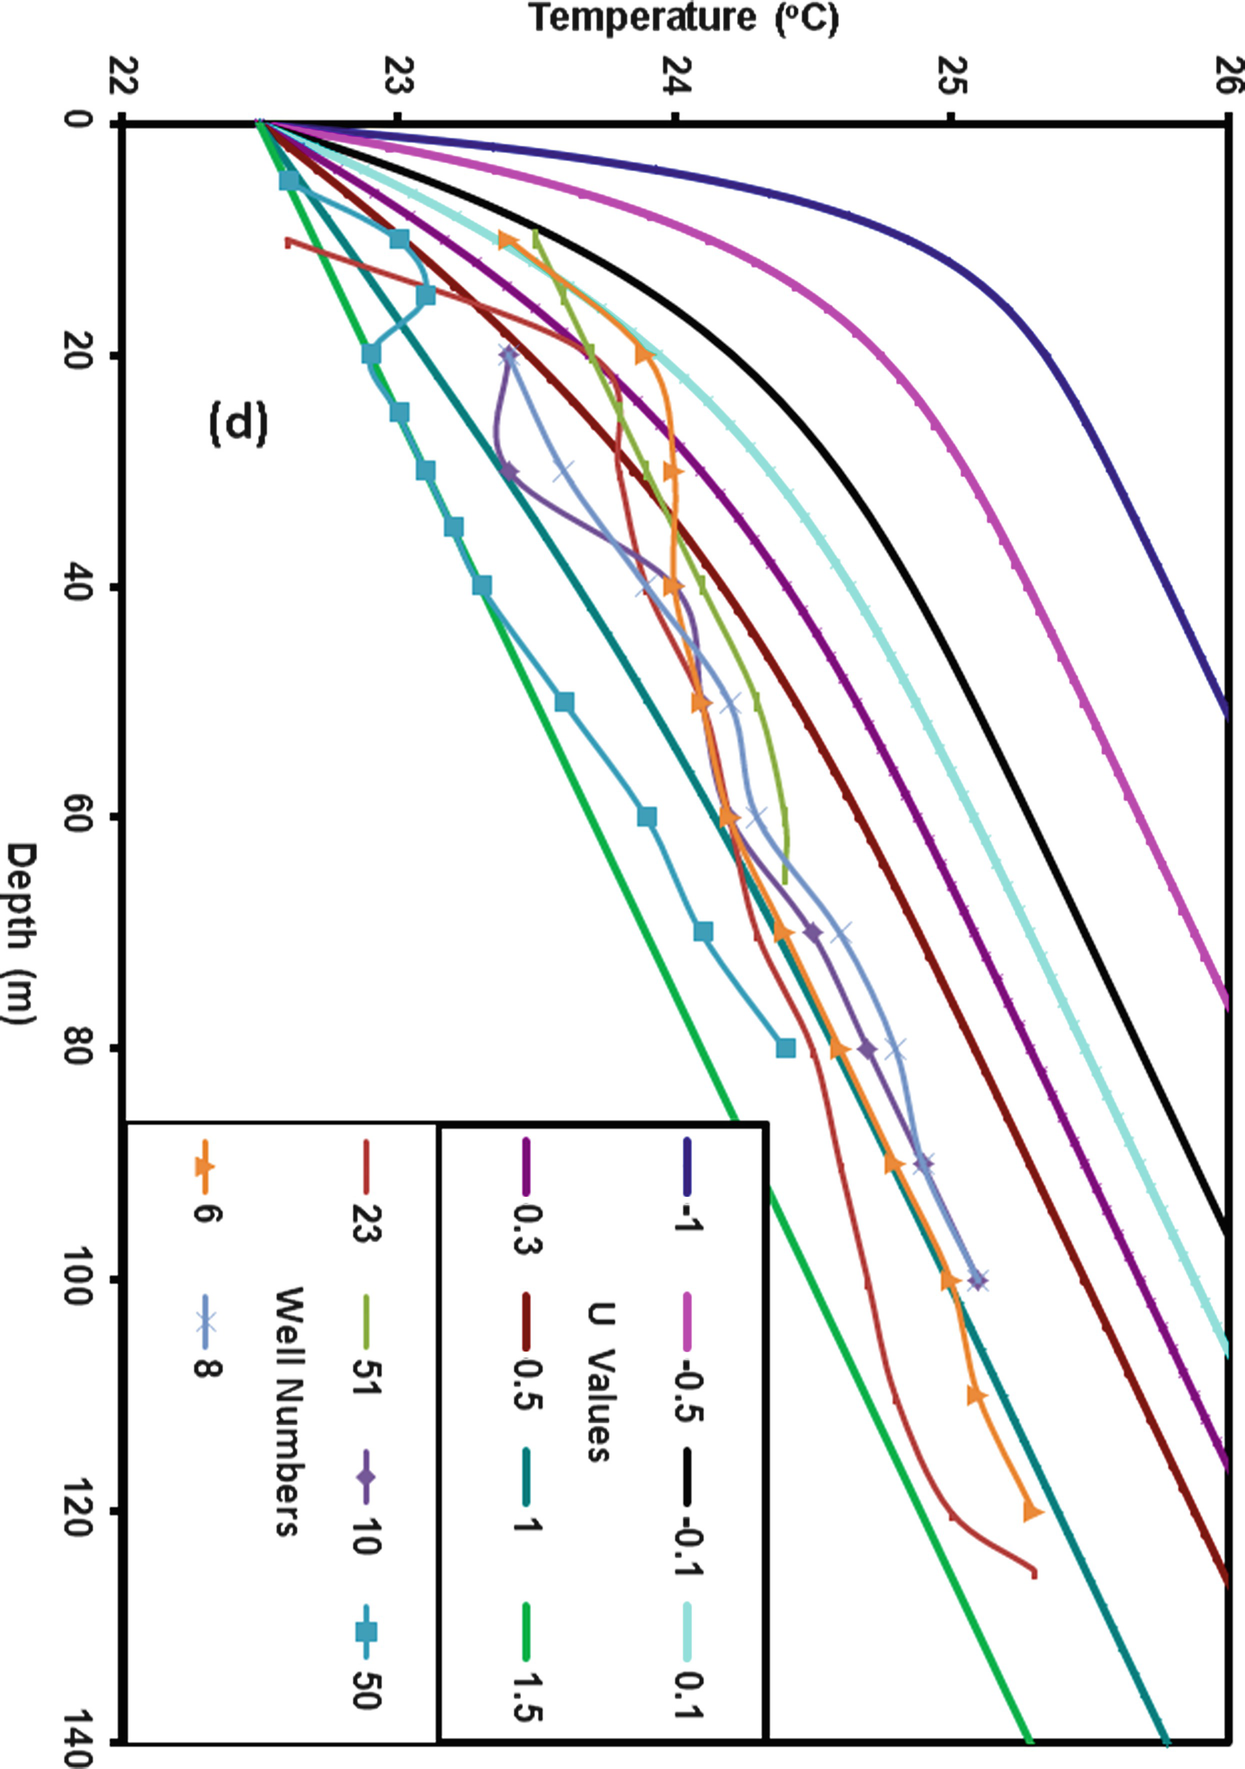
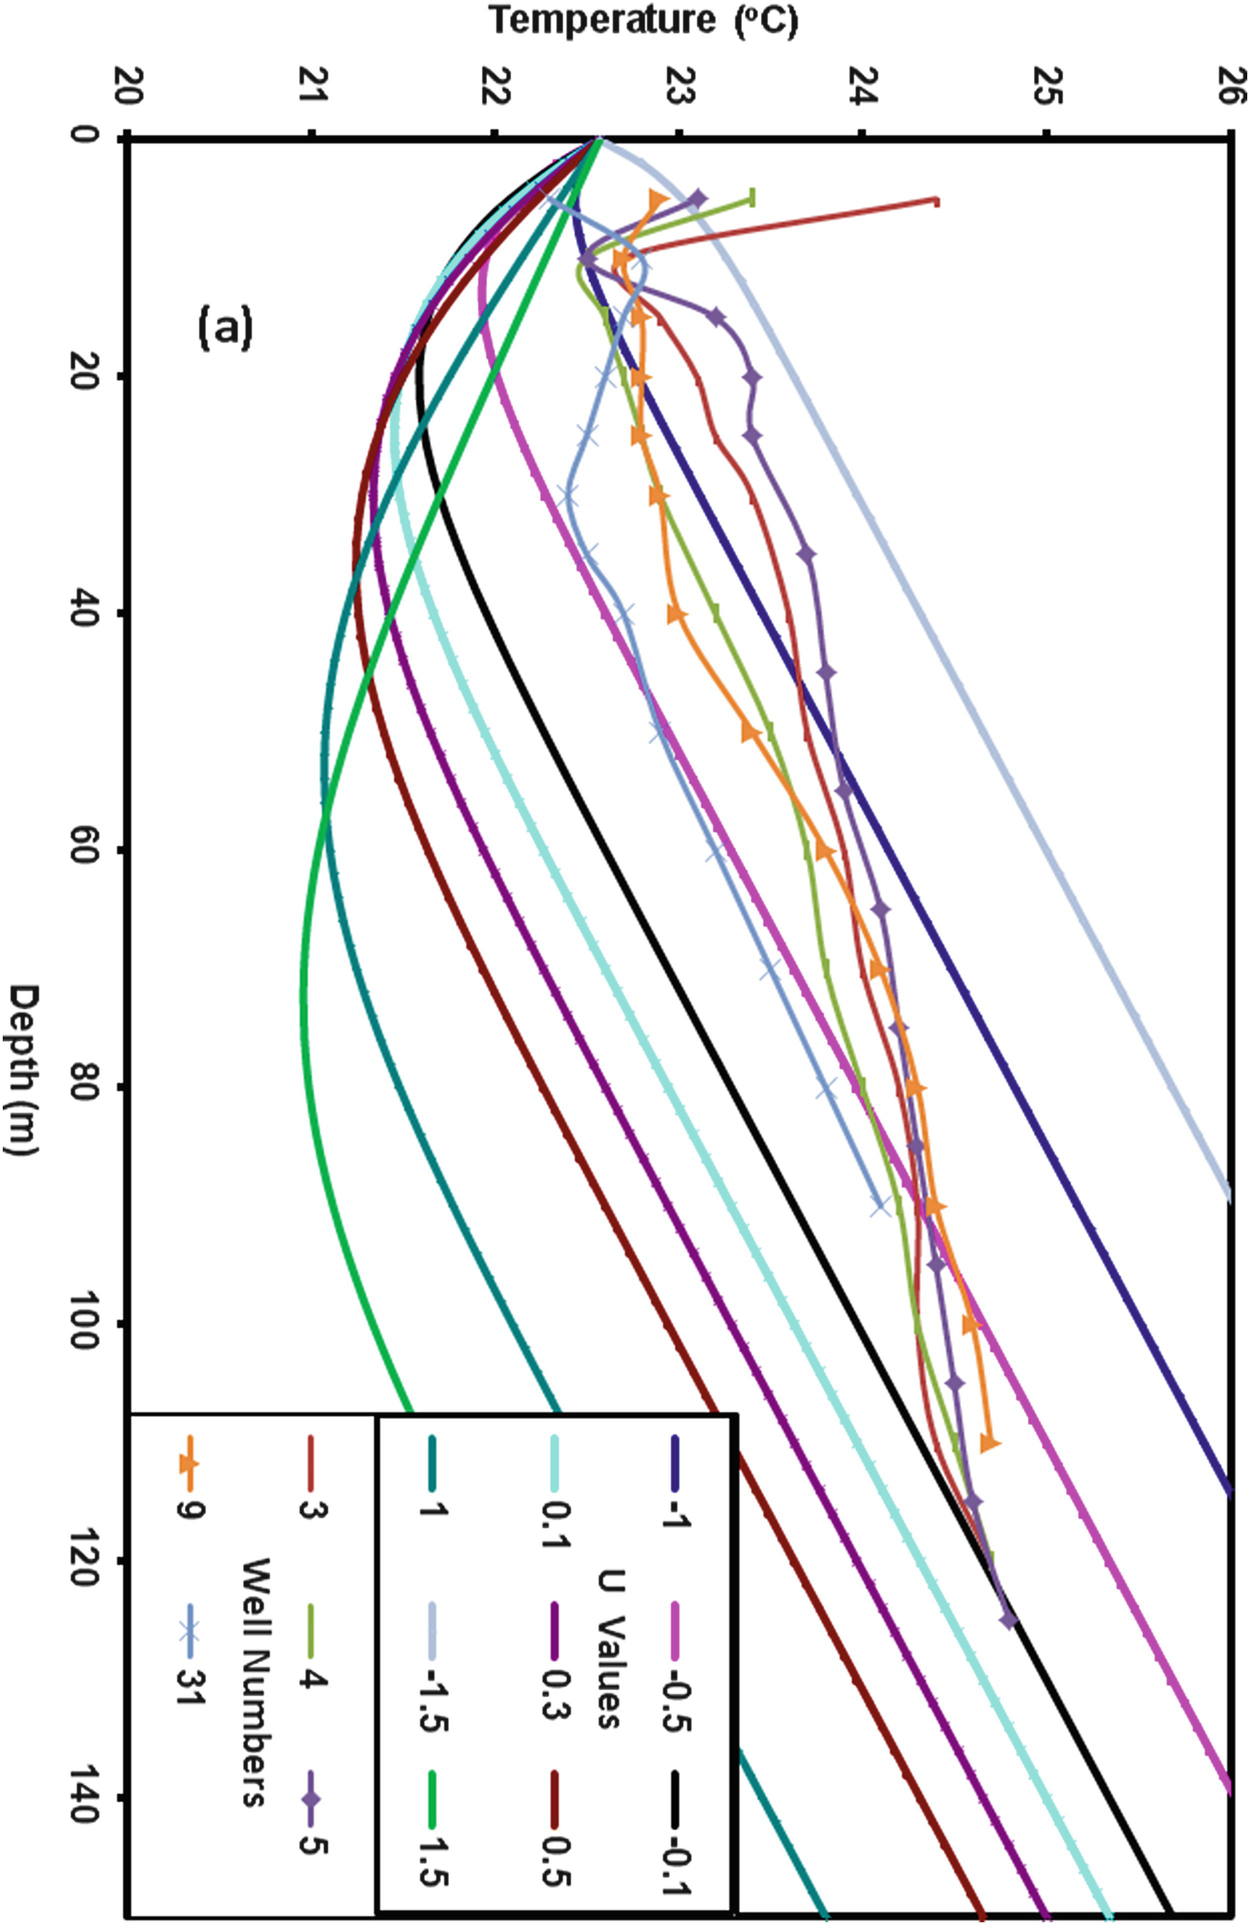
Evaluation of the vertical groundwater flux using the measured temperature profiles was done in relation to the nearest meteorological station. Wadi El-Natrun station climatic data were used for modeling the temperature profiles measured in the newly reclaimed desert, and those of Damanhour station were used for the profiles measured in the old agricultural land. A comparison between the modeled and observed profiles is shown in Figs. 17a–d and 18a–d.
Fig. 17
Comparison between the modeled 1D and the measured temperature-depth profiles for the newly reclaimed desert land. The modeled profiles show cooling trend due to present decrease in the surface air temperature at Wadi El-Natrun station as a result of agricultural reclamation activities
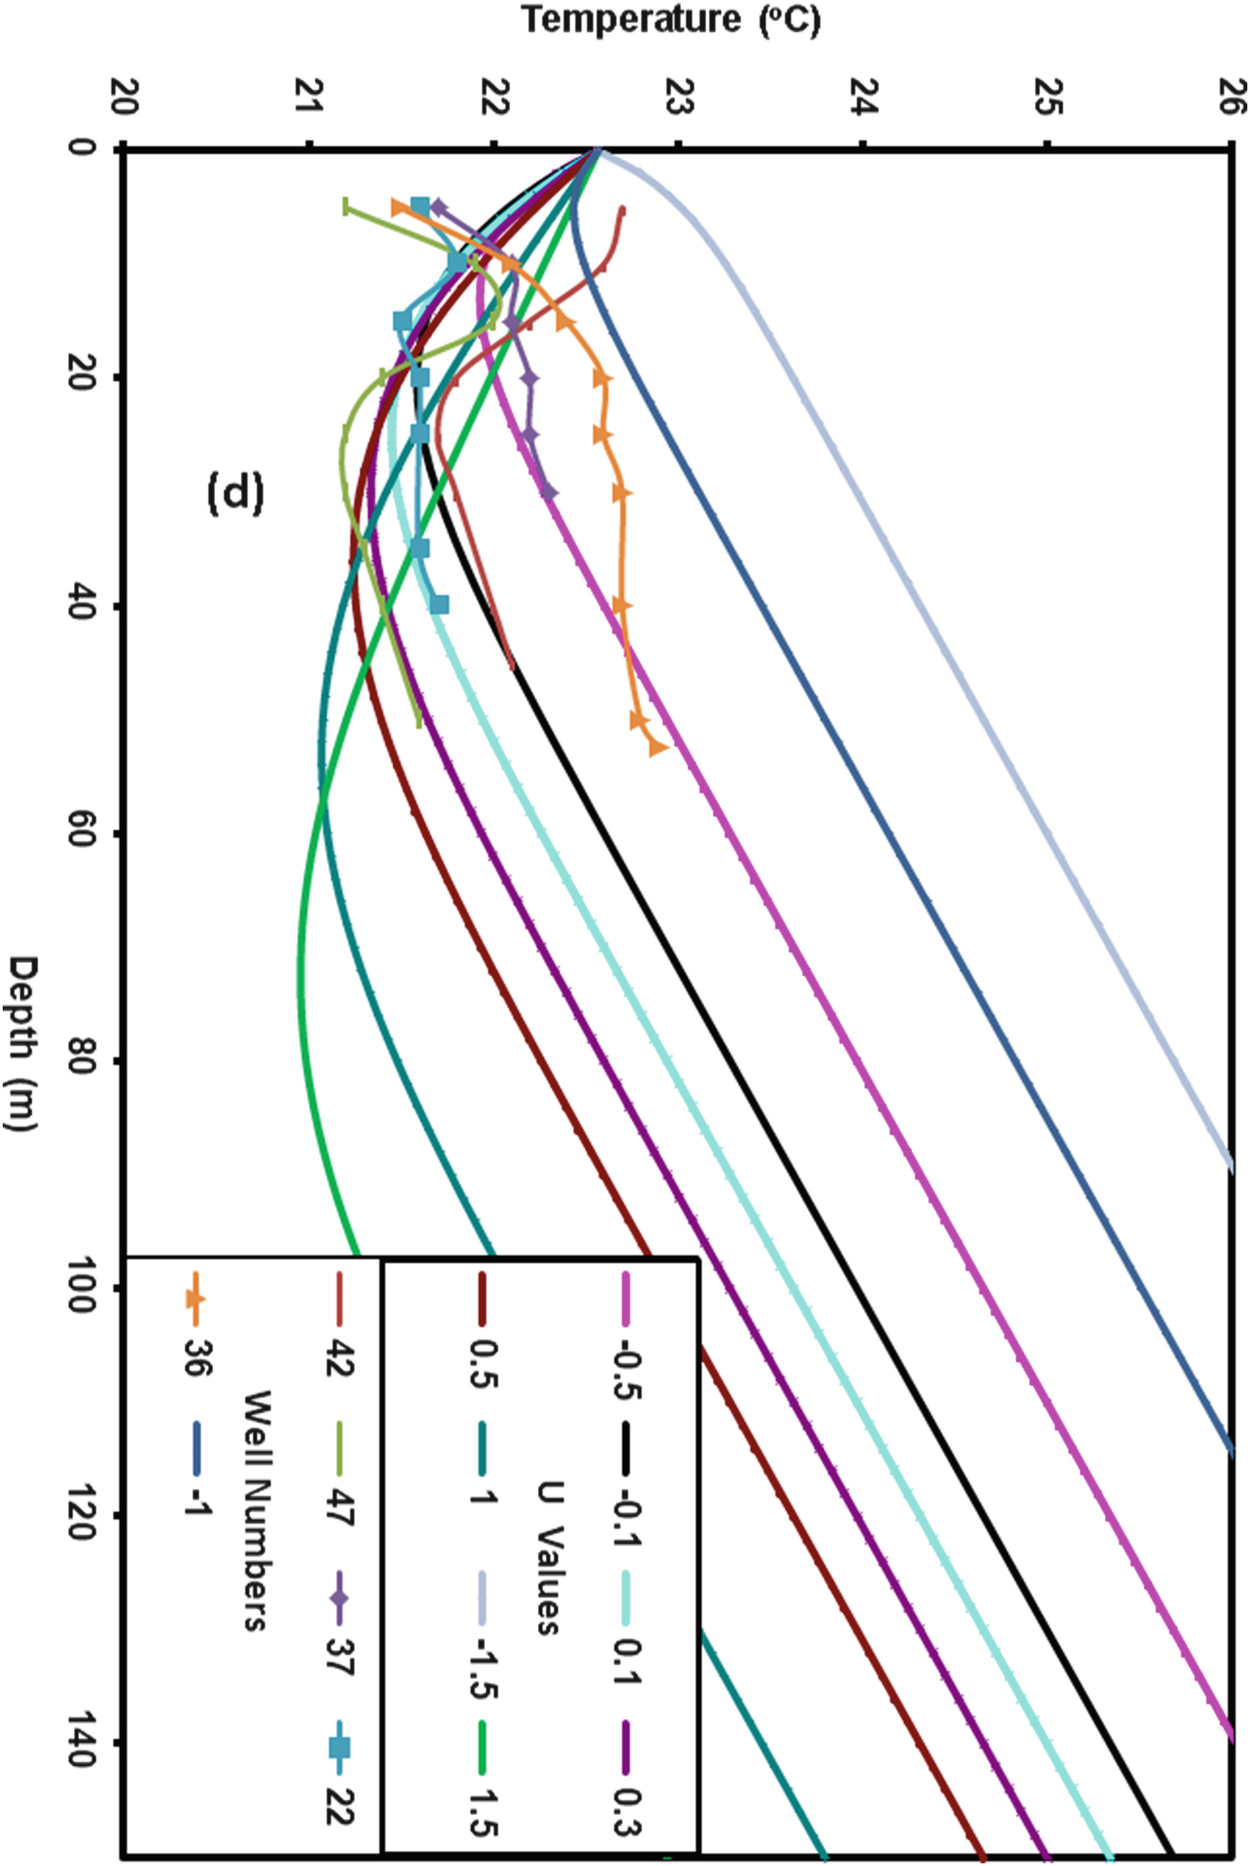
Fig. 18
Comparison between the modeled 1D and the measured temperature-depth profiles for the old agricultural land. The modeled profiles show warming trend due to recent increase in the surface air temperature as shown in Damanhour station
There were 26 temperature profiles related to the Wadi El-Natrun station. All these profiles were of the recharge type, except for one profile of the discharge type (well 21) (Fig. 17a–d). The recharge (downward groundwater flux) rates varied among recharge wells (Fig. 18a–d). The rates were 1.0–1.5 m/year in wells 11, 15, 24, 23, 25, 29, 50, 52, and 54; 0.5–1 m/year in wells 2, 6, 7, 8, 10, 12, 16, 18, 19, 20, 28, 43, 51, and 53; and 0.3–0.5 m/year in wells 44 and 14. The discharge (upward groundwater flux) rate in well 21 was −0.1 to −0.5 m/year (Fig. 19). It was noted that most of the wells showed cross-cutting of the modeled profiles in their shallower zones (Fig. 17a–d). This feature may be related to irrigation with groundwater, which is warmer than the surface water. The maximum recharge rate of the groundwater was 1.5 m/day, owing to water seepage from the irrigation canals, as the wells were mostly located in the area between the branches of the El-Bustan Canal (Fig. 19), where the land surface is covered by accumulations of sand deposits [64]. The minimum recharge value of the wells located in the reclaimed desert was 0.3 m/day, which was attributed to local geology or to a thin aquifer, as seen with well 14, which is located close to Wadi El-Natrun, where the Quaternary aquifer has its minimum thickness and rests on Pliocene clay-rich sediments.
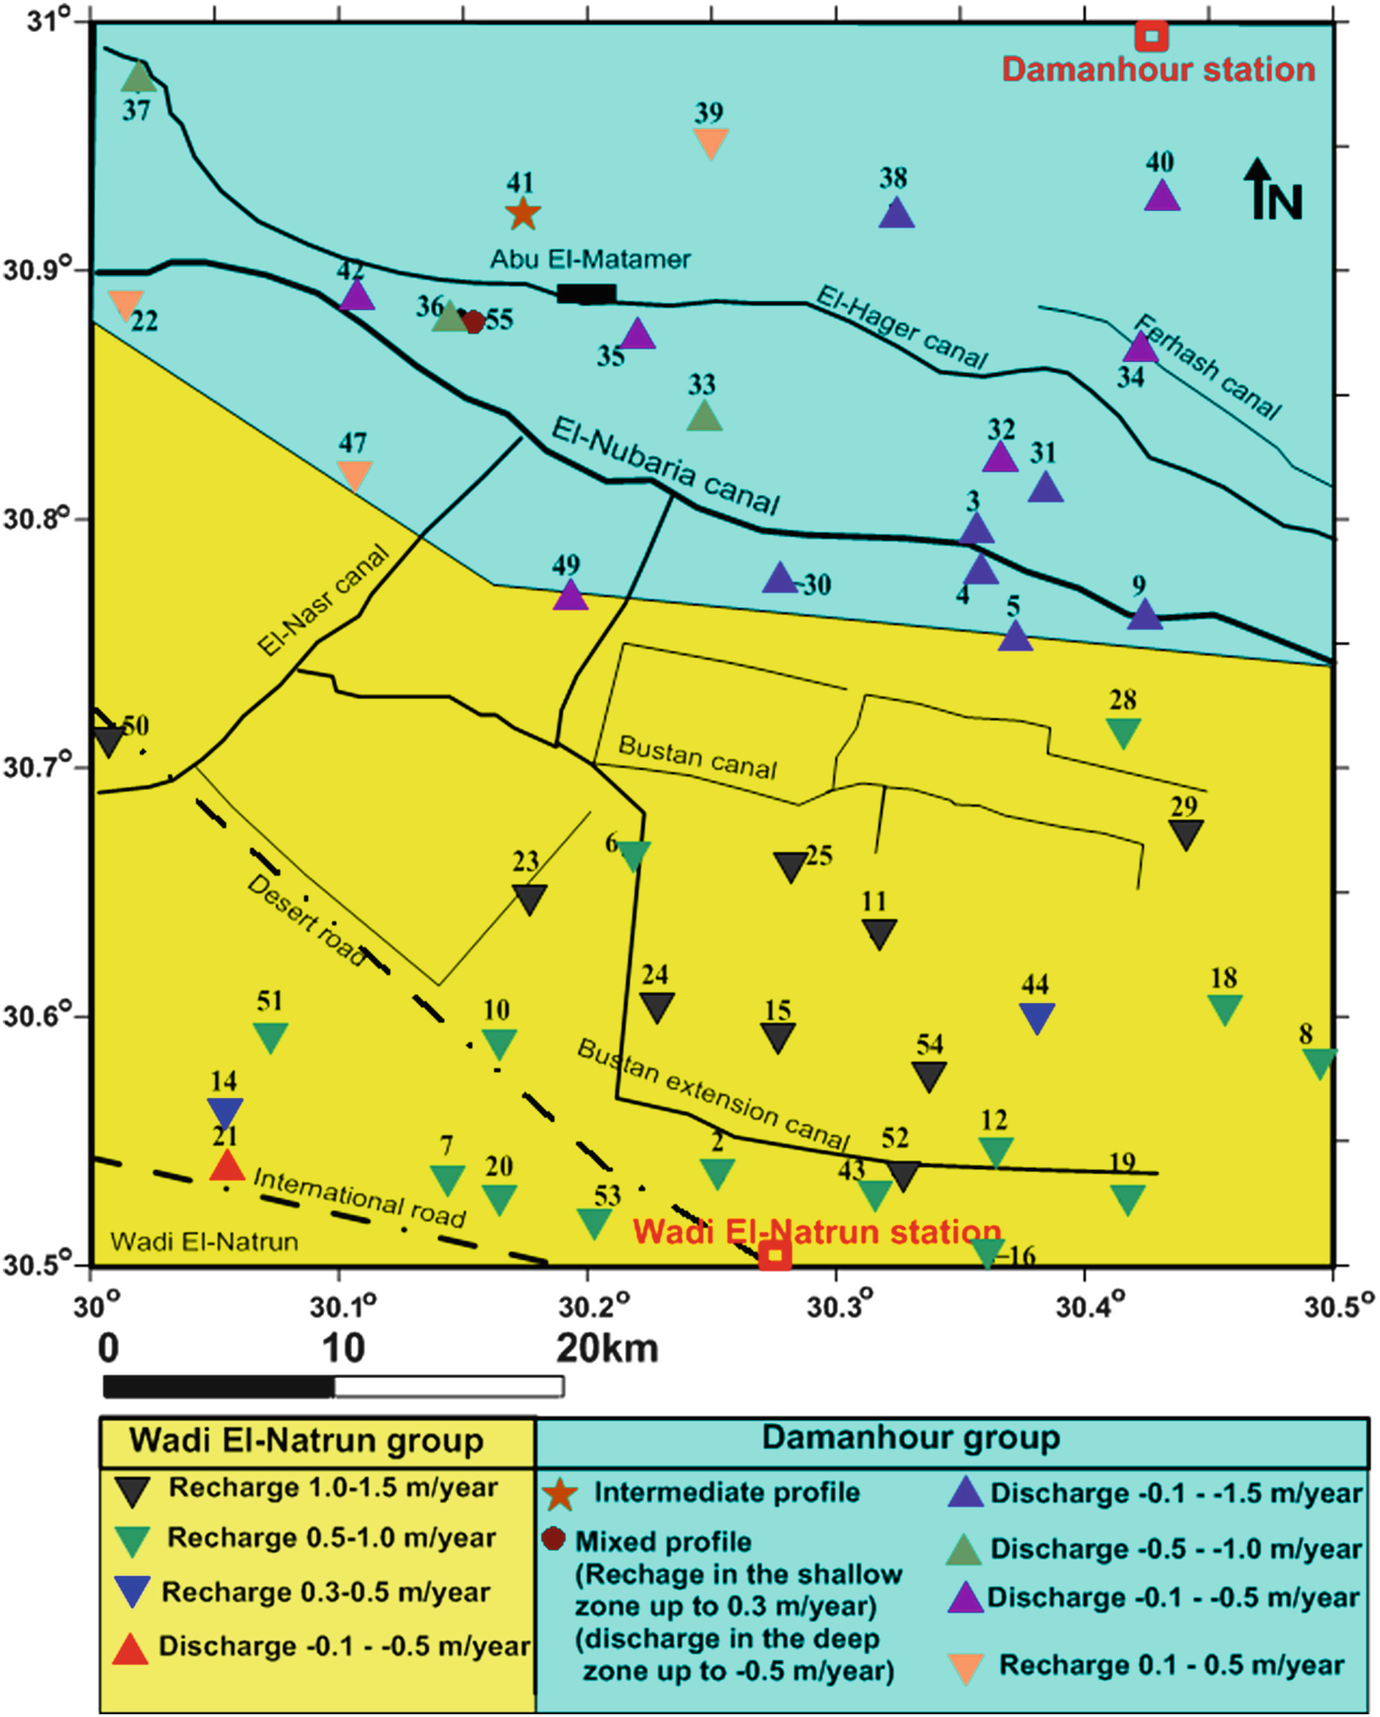
Fig. 19
Spatial distribution of the groundwater flux rates based on the data derived from Figs. 17 and 18
In contrast to the profiles of the Wadi El Natrun station, the 21 temperature profiles of Damanhour station were mostly of the discharge type (Fig. 18a–d). The discharge rates varied among the wells. The rates were −0.1 to −1.5 m/year in wells 3, 4, 5, 9, 31, and 38; −0.5 to −1.0 m/year in wells 33, 36, and 37; and −0.1 to −0.5 m/year in wells 32, 34, 35, 40, 42, and 49 (Fig. 19). A lower discharge rate of these profiles was recognized in the deeper zones and the rates increased to higher values in the shallower zones. As the discharge area is located near the Mediterranean Sea coast, such a vertical change in the discharge rate might be attributed to a low-salinity shallow water zone which lies over the seawater intrusion-related groundwater zone. These findings are consistent with the findings of geochemical and geophysical studies of the groundwater aquifer in the study area carried out by Osman [65]. Of note, the change from recharge type in the deeper zone for well 55 (up to 0.3 m/year) to a discharge type in the shallower zone (up to −0.5 m/year) could also be related to seawater intrusion. The maximum discharge rate (−1.5 m/year) was recognized around the southern part of the El-Nubaria Canal close to the region of contact between the old and the new agricultural lands (Fig. 19). The latter discharge process would make the southern part of El-Nubaria canal a gaining stream. The wells that had the minimum discharge rate (−0.1 m/day) are mostly located to the east of the El-Nubaria Canal (Fig. 19). Therefore, the reduction in the discharge rate of these wells could be related to eastward seepage from the El-Nubaria Canal. The temperature profiles in wells 22, 47, and 39 indicate that the recharge occurs either from irrigation processes or water seepage from the irrigation canals, with a variable rate ranging from 0.1 to 0.5 m/year. Well number 41 is considered to have an intermediate-type profile.
7 Discussion and Conclusions
In regard to the relationship between subsurface temperature distribution and the groundwater stream framework, we consider the area we investigated to show an abnormal thermal system. We analyzed land use and the groundwater stream framework, on the one hand, and the subsurface thermal regime (in light of 1D profiles, and vertical 2D thermal framework), on the other hand.. The subsurface temperatures in the reclaimed desert areas, where the recharge territory was found, were higher than those in the discharge region in the old agrarian land. This abnormal thermal system was ascribed to the surface air temperature, where the reclaimed deserts have a higher average annual temperature (23.15°C at Wadi El-Natrun station) than that experienced in the old agricultural terrains (20.37°C at Damanhour station). In contrast to this abnormal thermal regime, the geothermal gradient showed normal values; in the recharge areas it had low values (0.0145–0.0326°C/m; average, 0.0198°C/m), while in the discharge areas higher values were encountered (0.016–0.049°C/m; average, 0.0343°C/m). For this reason, the geothermal gradient is superior to the thermal system for following the groundwater stream framework in regions such as those we examined.
The connection between groundwater and surface water is obviously recognized from the subsurface temperature distribution. A warm zone is formed under a gaining stream because of upward movement of the groundwater, and a cool zone exists around a losing stream because of leakage descending from the surface water. The El-Nubaria canal is a gaining stream in its southern part, but a losing stream in its northern part. The El-Hager canal is viewed as a losing stream along its entire course. Water intrusion from the El-Bustan canal influences the groundwater temperatures, creating a subsurface zone of low temperatures, in contrast to the temperatures of the environs.
In this study, model 1D temperature profiles were compared with observed profiles. The recharge flow flux varied among the recharge profiles, ranging from 0.3 to 1.5 m/year in the main recharge area to the south and southwestern directions. Seepage from the irrigation canals (El-Nubaria and El-Hager) in the northwestern part of the study area produced a downward groundwater flux that ranged from 0.1 to 0.5 m/year. The groundwater discharge flux was also variable; in the main discharge area to the north and the northeastern direction it ranged from −0.1 to −1.5 m/year. On the other hand, the groundwater discharge rate toward Wadi El-Natrun was −0.1 to −0.5 m/year.
Seawater intrusion probably affected the thermal regime in the discharge area to the northern part of the study area. This opinion is based on the occurrence of a colder temperature zone in the northern parts of the area and a downward reduction in the discharge rate of the temperature profiles.
8 Recommendations
Determination of subsurface temperatures is a good method for tracing a groundwater flow system; this method can also be used for the quantitative determination of recharge and discharge rates, as well as for assessments of the spatial circulation of groundwater in an aquifer. Therefore, we recommend that borehole temperature be used widely in Egypt to help in solving some complicated groundwater problems.


![$$ {\displaystyle \begin{array}{l}T\left(z,t\right)={T}_o+{T}_G\left(z- Ut\right)+\left\{\left(b+{T}_GU\right)/2U\right\}\\ {}\kern3em \times \left[\left(z+ Ut\right){e}^{Uz/\alpha}\operatorname{erfc}\left\{\left(z+ Ut\right)/2{\left(\upalpha \mathrm{t}\right)}^{1/2}\right\}\right.\\ {}\kern3.2em \left.+\left( Ut-z\right)\operatorname{erfc}\left\{\left(z- Ut\right)/2{\left(\upalpha \mathrm{t}\right)}^{1/2}\right\}\right]\end{array}} $$](../images/437178_1_En_248_Chapter/437178_1_En_248_Chapter_TeX_Equ1.png)