1 Introduction
Well logs are used widely in the exploration of mineral and hydrocarbon resources because they provide detailed and reliable information about the geometrical and petrophysical characteristics of the geological structures [1]. They are applicable also for the investigation of shallow formations, for instance, in water prospecting and solving environmental and engineering geophysical problems [2]. In hydrogeophysics, the main target of well log analysts is to estimate the layer thickness, water saturation, groundwater salinity, effective porosity, clay content, and aquifer hydraulic conductivity accurately as possible.
Well logs can be basically used to distinguish the change of hydraulic conductivity along a well or between neighboring wells. All sorts of borehole-logging suites utilized as a part of hydrocarbon investigation can be used in groundwater prospecting. Gamma ray and SP logs are used for identifying lithology and determining the layer thickness [3]. Water saturation zones and invasion profiles surrounding the borehole could be detected by using high-resolution resistivity tools. Because freshwater has higher resistivity than salt water, traditional resistivity tests are reasonably used for groundwater investigation. While shallow resistivity devices determine the apparent resistivity of the zone invaded by mud, the deep resistivity tools measure the original formation resistivity. The resistivity readings should be corrected to estimate the true resistivity of groundwater formation which is significant for computing the aquifer water saturation [3]. Many researchers used geophysical well logs to calculate the aquifer petrophysical parameters; among them are Winslow and Kister [4], Paillet and Reese [5], Sloto et al. [6], Szabó [7, 8], Szabó and Dobróka [9], Szabó and Dobróka [10], and Szabó et al. [11]. As the Nile Delta aquifer is so important freshwater source for the highly populated area in Egypt, determining the spatial change in its petrophysical, hydrogeological, and hydrogeochemical characteristics is of great importance. This work aims to estimate the aquifer parameters as clay volume, porosity, clay thickness, permeability, TDS, and hydraulic conductivity for Bilqas and Mit Ghamr Formations.
2 Study Area
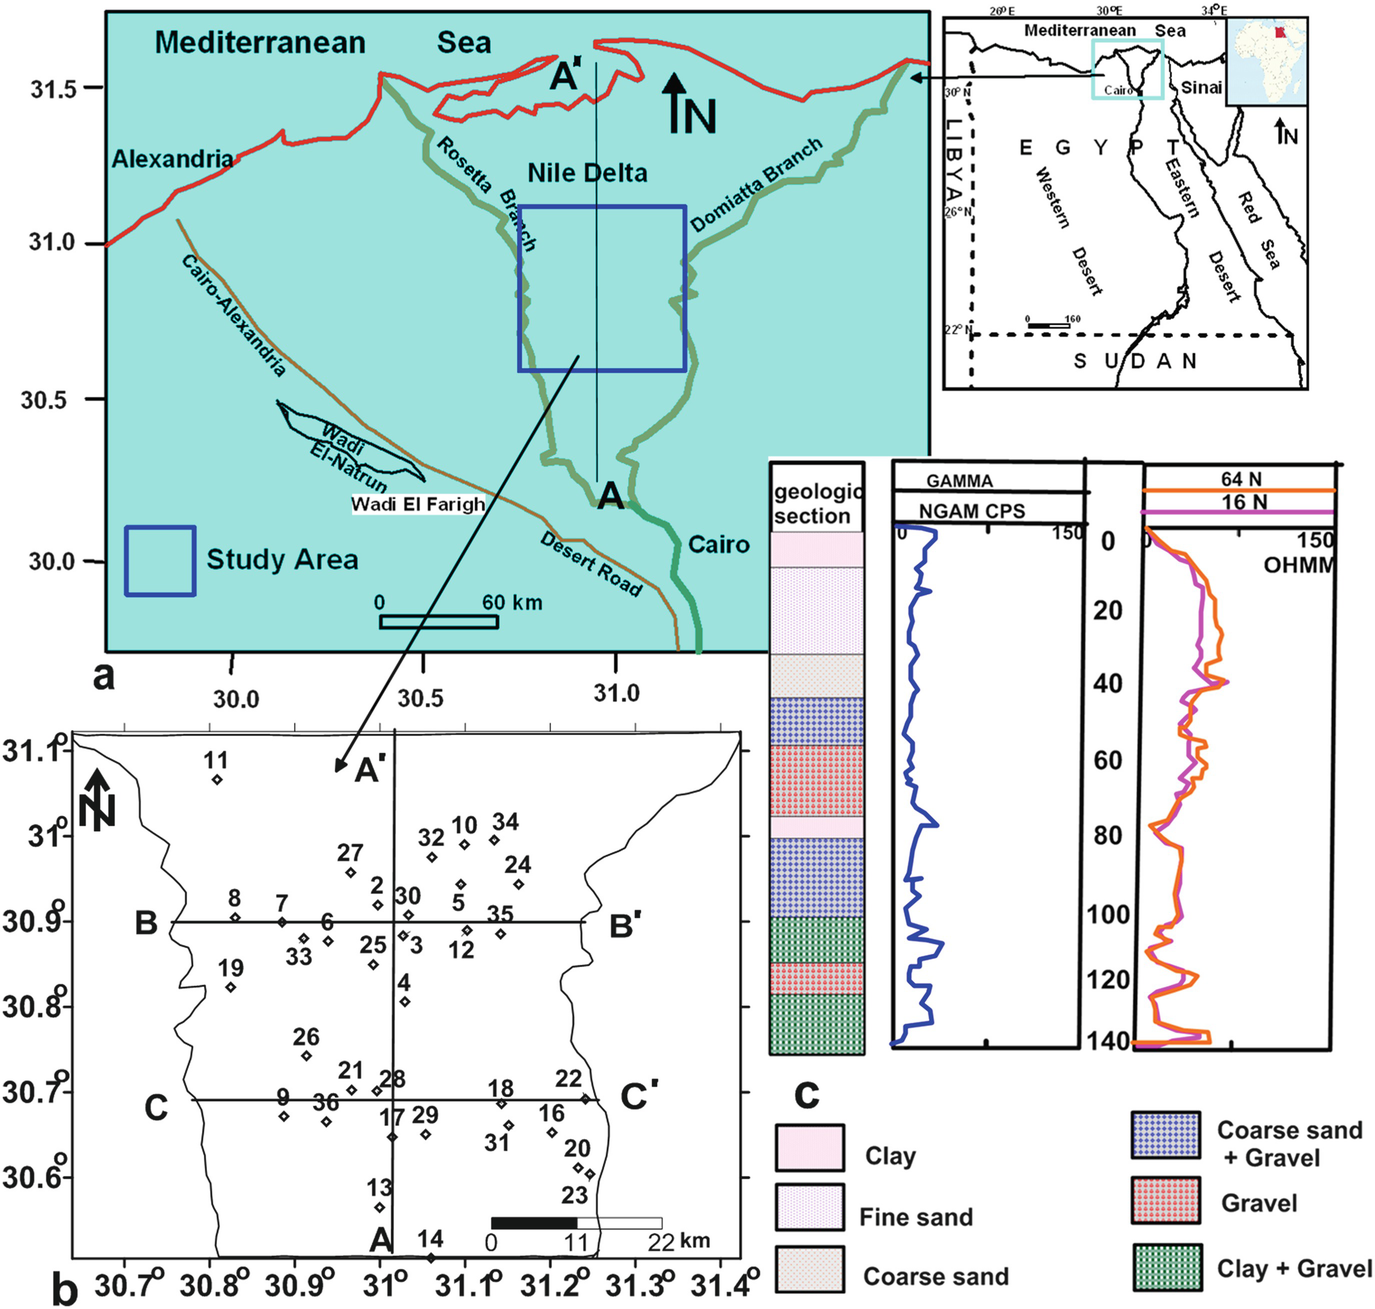
Location map of the study area (a), boreholes location map (b) and representative geophysical log of well 9 (c). AA′ is the location of the hydrogeological cross-section shown in Fig. 2
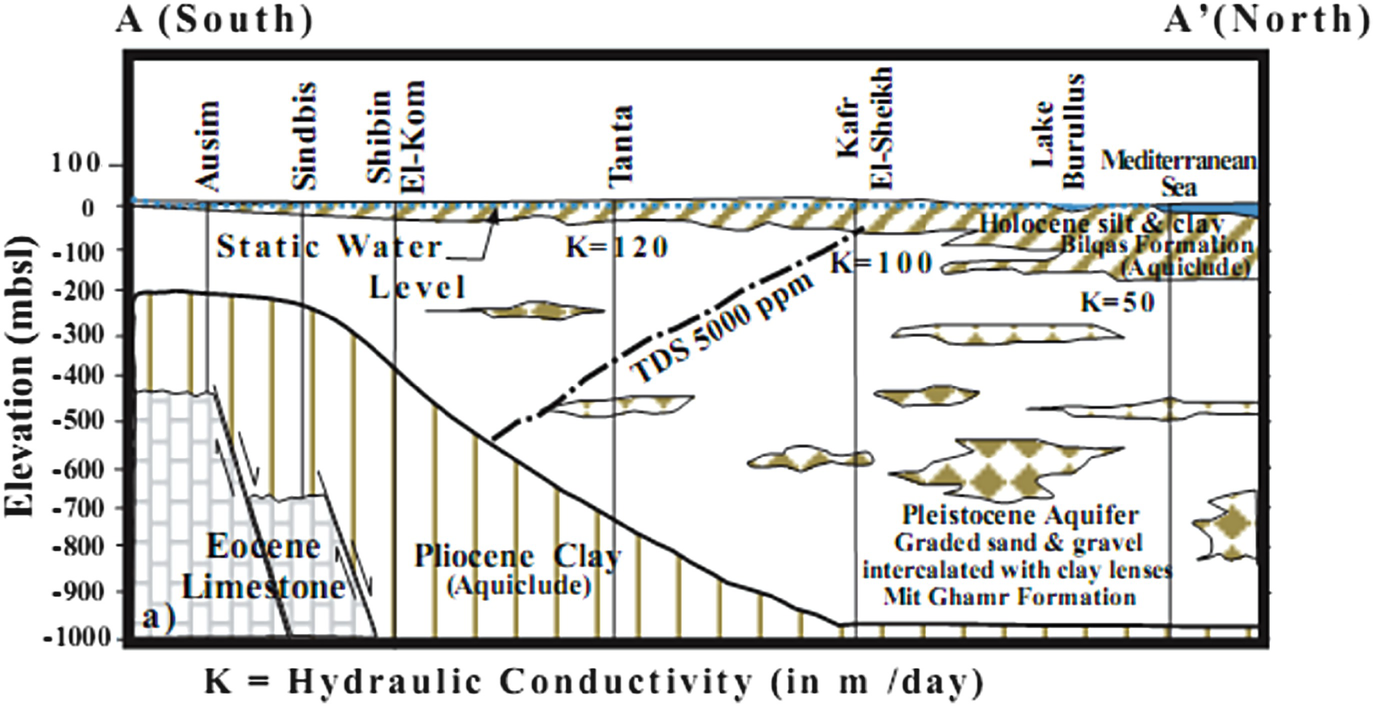
The hydrogeological cross section from south to north in the Nile Delta shows the framework groundwater regime
3 Methodology
Petrophysical data derived from 34 well logs with depths ranging between 80 and 140 m (Fig. 1b, c). Logging parameters collected included are gamma ray and resistivity logs. These logs were selected to estimate the spatial variability of the formation lithology, porosity, permeability, and water salinity. These logs were also used to estimate the hydraulic conductivity of the aquifer.
3.1 Shale Volume Estimation

I GR is the gamma ray index.
GRc is the corrected value of gamma ray at the interest intervals.
GRmin is the minimum value of gamma ray opposite clean intervals.
GRmax is the maximum value of gamma ray opposite shale intervals.
![$$ {V}_{\mathrm{sh}}=0.083\left[{2}^{3.7\mathrm{IGR}}\hbox{--} 1\right]\kern1em \mathrm{Larionov}\ \mathrm{equation} $$](../images/437178_1_En_75_Chapter/437178_1_En_75_Chapter_TeX_Equ2.png)
3.2 Formation Water Resistivity Determination
It is the water, uncontaminated by drilling mud that saturates the porous formation rock. The resistivity of the formation water (R w) is important interpretation since it is required for the calculation of saturation water from basic resistivity logs. Archie determined experimentally that the water saturation of clean formation could be expressed in the term of its true resistivity as:


R mf is the resistivity of the mud filtrate.
R o is the flushed zone resistivity which equals (LLS) short normal resistivity (R16″).
The formation water resistivity (R w) for the Nile Delta aquifer is computed using Archie Eq. (6) after correcting the LLD readings.
3.3 Formation Factor Determination

where R t is the true resistivity in Ω m and R w is formation water resistivity.
3.4 Porosity Determination
It is generally agreed that an empirical relationship exists between formation factor and porosity. The formation water factor is a function of porosity and also of pore structure and pore size distribution. Archie introduce this relationship in the following equation:

a is the pore geometry coefficient, dimensionless, generally, ranges from 0.6 to 2.
Ф is porosity in percent.
m is cementation factor, dimensionless, ranges from 1 to 3.
3.5 Permeability Determination
Permeability is one of the most important and least predictable fluid transport characteristics of materials. Permeability must be known to understand several natural phenomena, such as the basin-scale hydrogeological circulation [27], fault dynamics [28], the safety of waste repositories [29], and several other subsurface hydrology problems [30]. The used methods for calculating the permeability from the well logs are discussed as follows:
3.5.1 Clean Sand
Intrinsic permeability (K) is evaluated using the following equation:

K is the intrinsic permeability in millidarcy [31].
P is a porosity factor which represented by the following equation.

3.5.2 Permeability of Clay and Clayey Sand
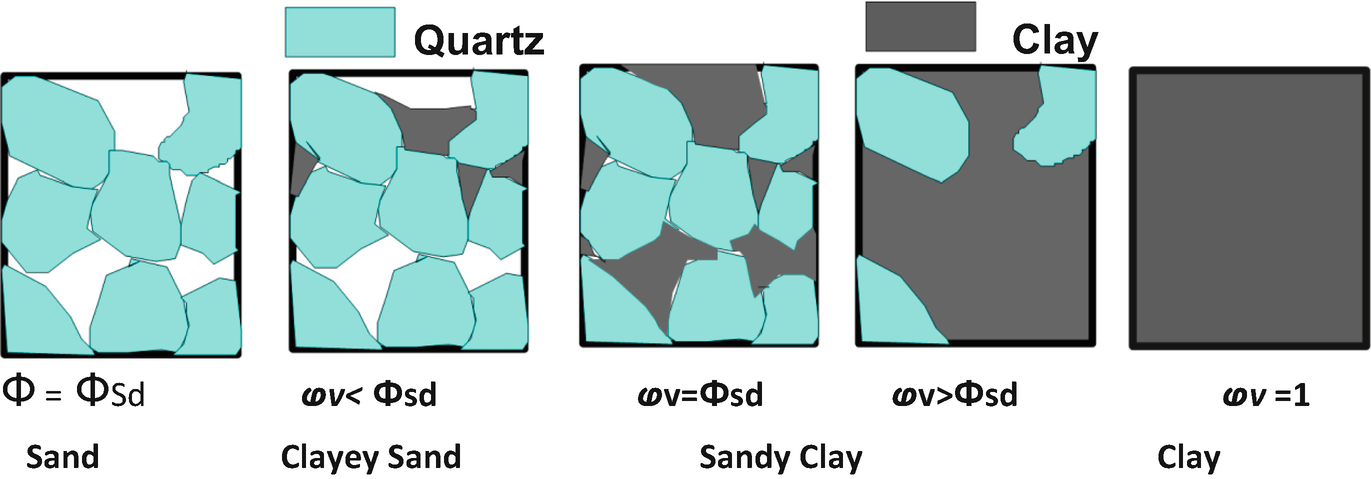
Sand-shale mixture for various shale contents. The shale content increases from the left to the right. For a clay-free sand (first end-member), the noncompacted porosity is equal to Фsd. For a clayey sand, the porosity decreases because of the presence of clay particles in the pore space. This decrease continues until the critical point where all the pore space of a clean sand is occupied by clay particles, i.e., when the shale content is equal to the porosity of a clean sand. After this point the rock is sandy shale, and an increase in shale content is only possible through replacement of quartz grains by clay particles, and the porosity increases with the shale content. The second end-member is pure shale with no quartz grains and with a porosity equal to Фsh (Note: this figure and its description are taken from [30])
Clay

Sand-Clay Mixture


![$$ K={k}_{\mathrm{sd}}{\left[1-\omega \upsilon \left(\frac{1-{\Phi}_{\mathrm{sh}}}{\Phi_{\mathrm{sd}}}\right)\right]}^{3\mathrm{mcs}}\kern1em \omega \upsilon <{\Phi}_{\mathrm{sh}} $$](../images/437178_1_En_75_Chapter/437178_1_En_75_Chapter_TeX_Equ17.png)
Clayey Sand-Sandy Clay Boundary

where

Sandy-Clay Domain

3.6 Formation Water Salinity Determination
Assessment of groundwater quality from well logs usually centers on values for total dissolved solids (TDS) and specific conductance (C w).

C w is conductivity in micromhos/cm.
R w is formation water resistivity.

3.7 Estimation of Hydraulic Conductivity

4 Result and Discussion
4.1 Spatial Horizontal Distribution
4.1.1 Bilqas Formation

Spatial distributions maps of average values of different petrophysical parameters for Bilqas formation
4.1.2 Mit Ghamr Formation
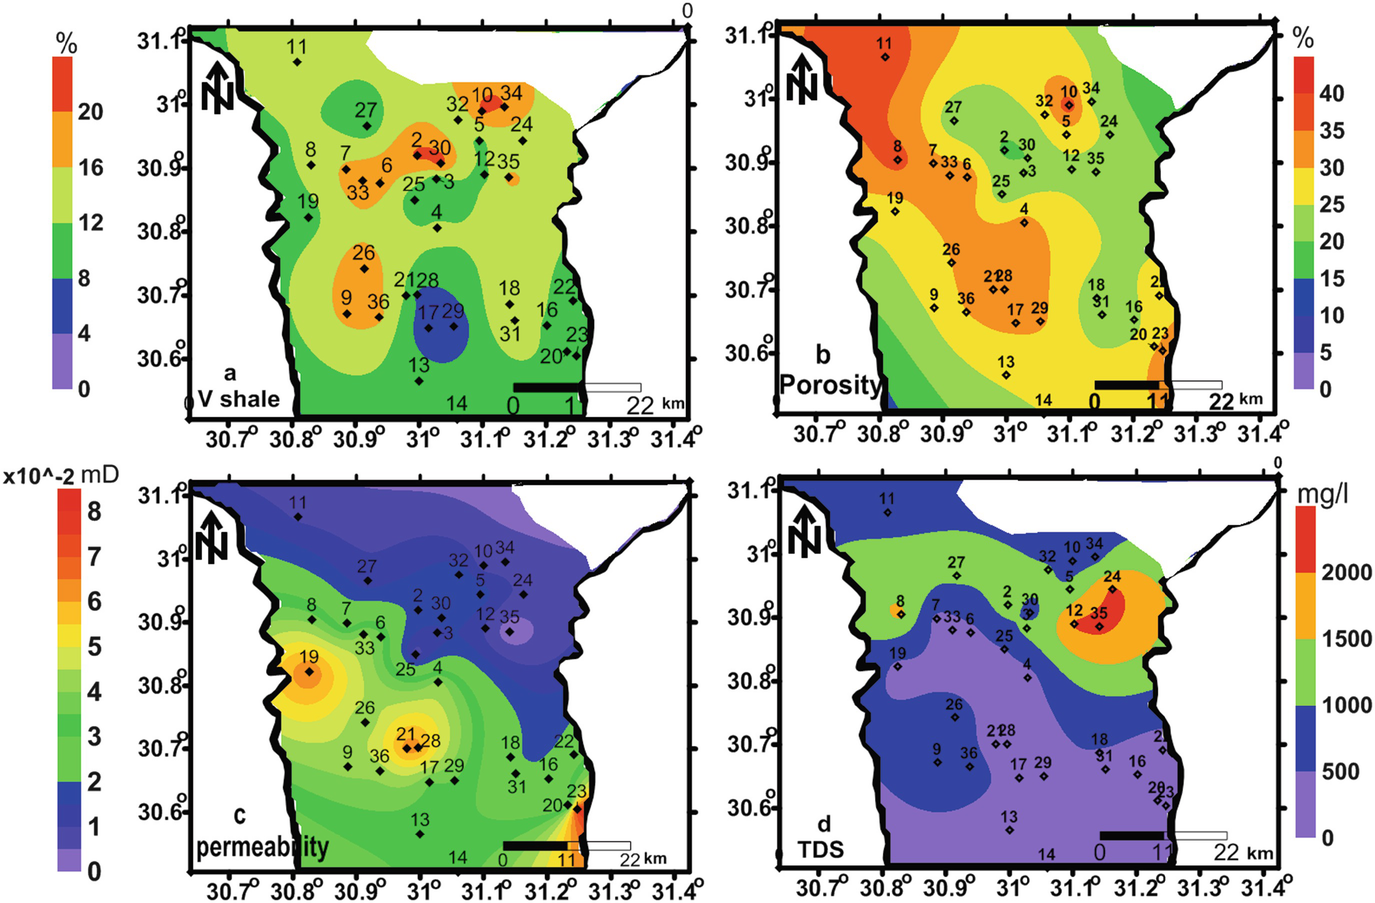
Spatial distributions maps of the calculated average values of different petrophysical parameters for Mit Ghamr formation
4.2 Vertical Spatial Distribution
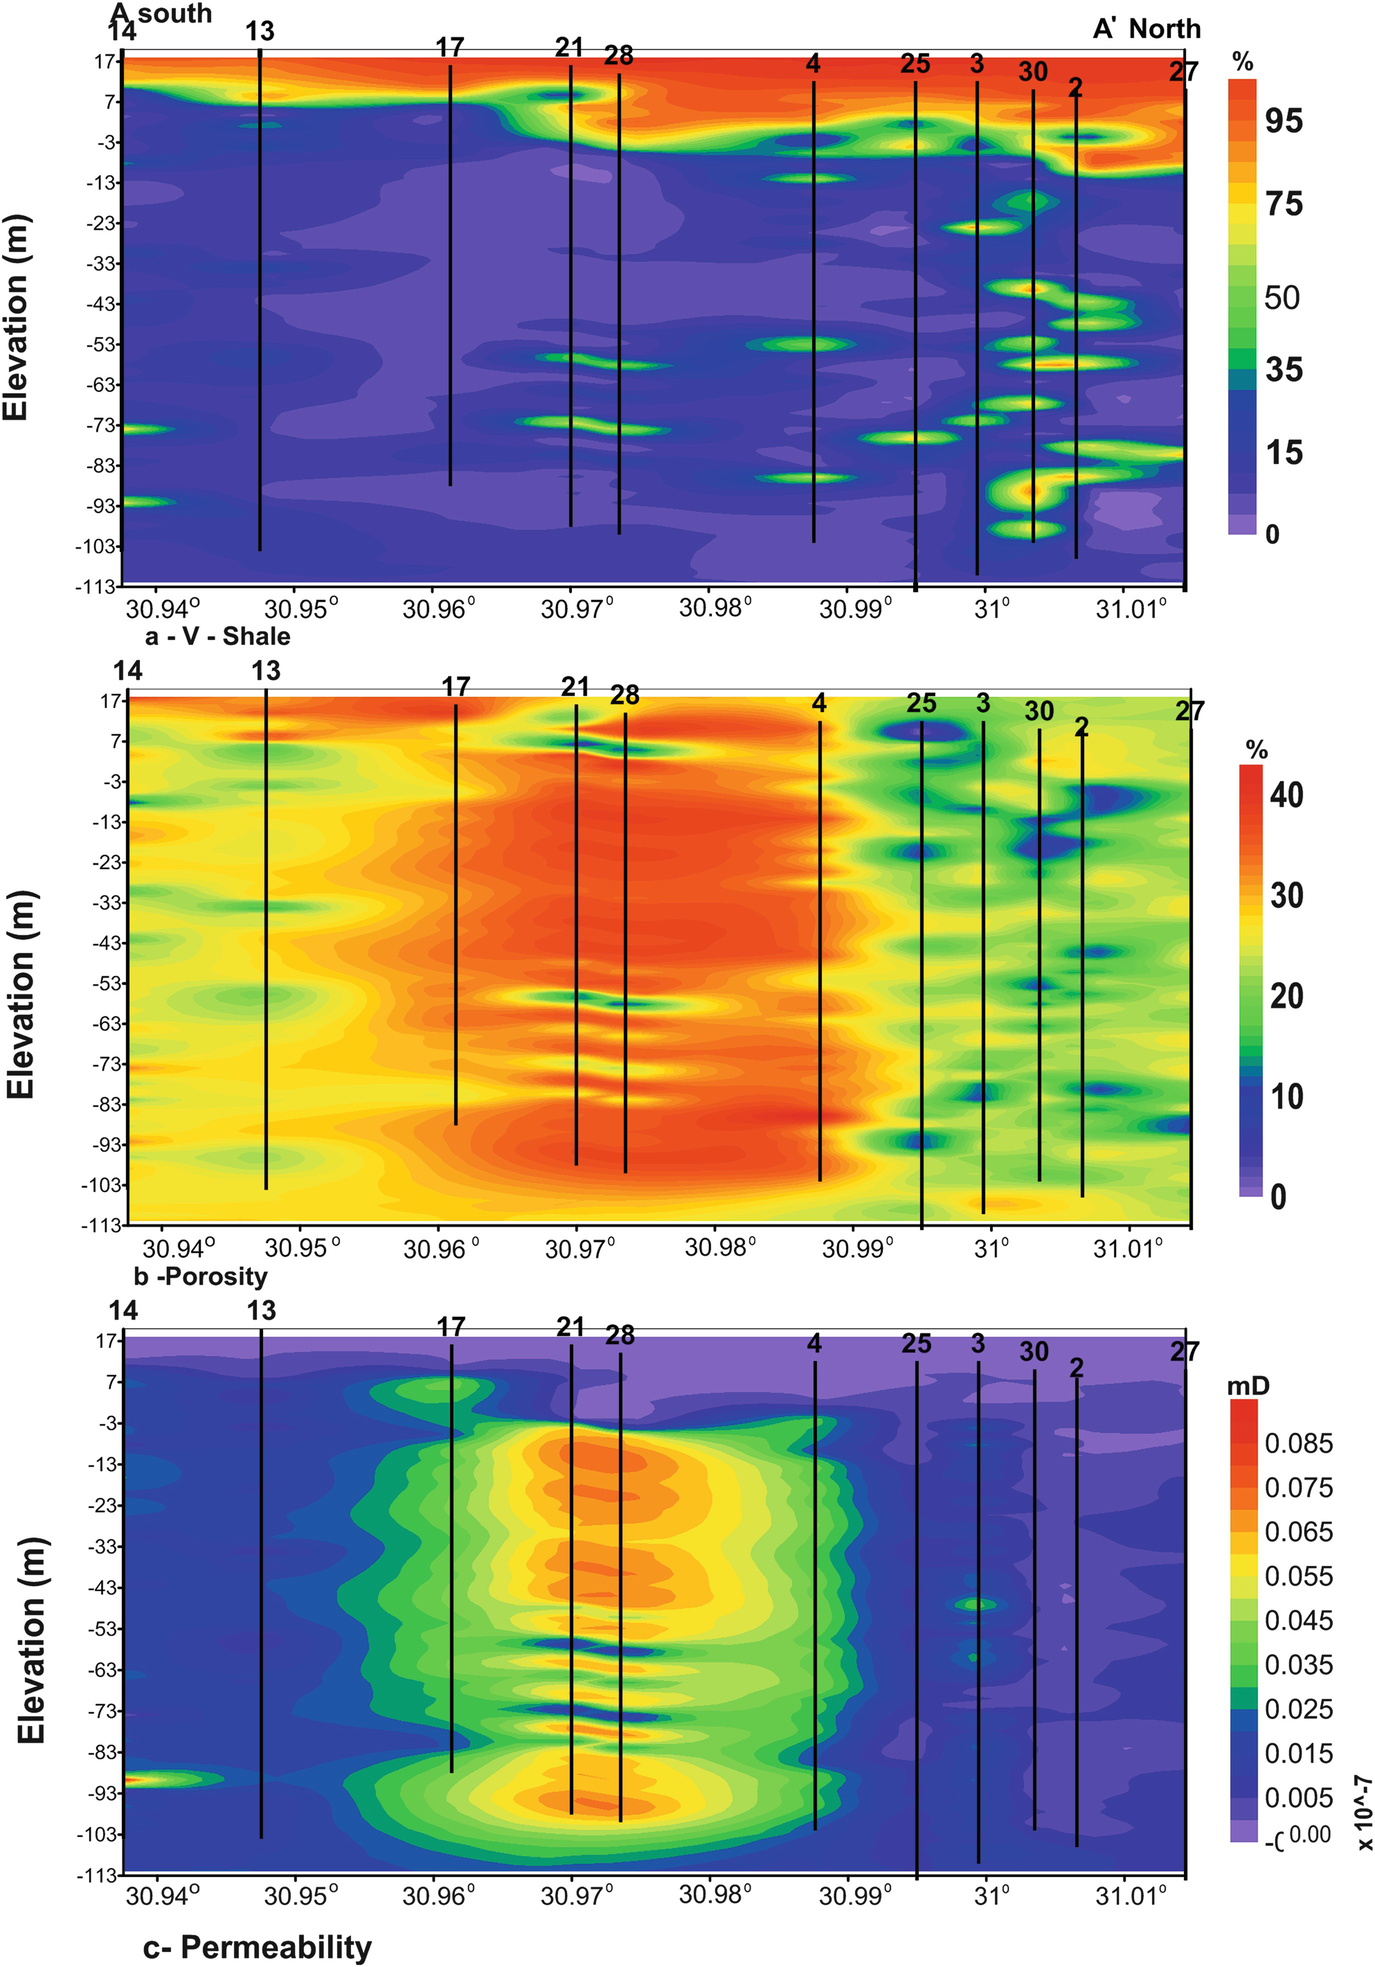
Vertical distributions of the calculated values of different petrophysical parameters along the cross section AA′
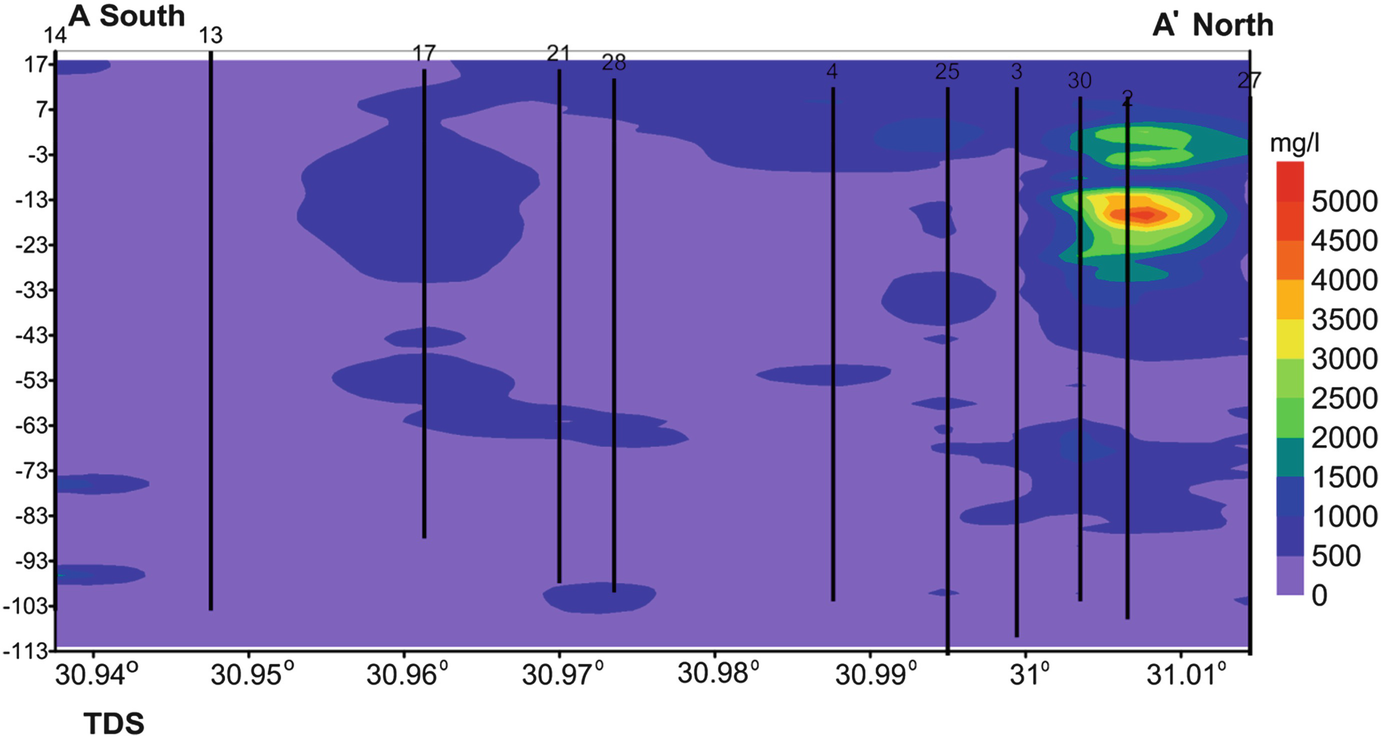
Vertical distributions of the calculated values of different groundwater salinity along the cross section AA′

Vertical distributions of the calculated values of different petrophysical parameters along the cross section BB′
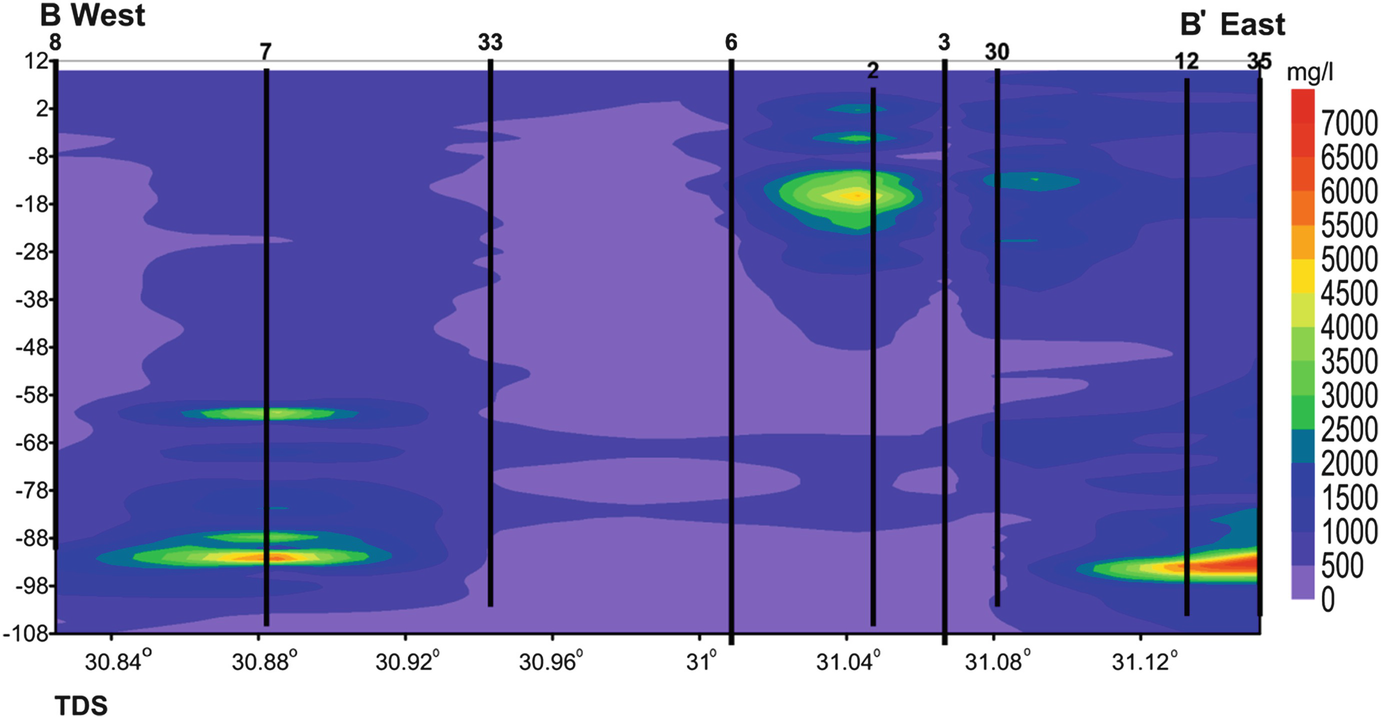
Vertical distributions of the calculated values of different groundwater salinity along the cross section BB′
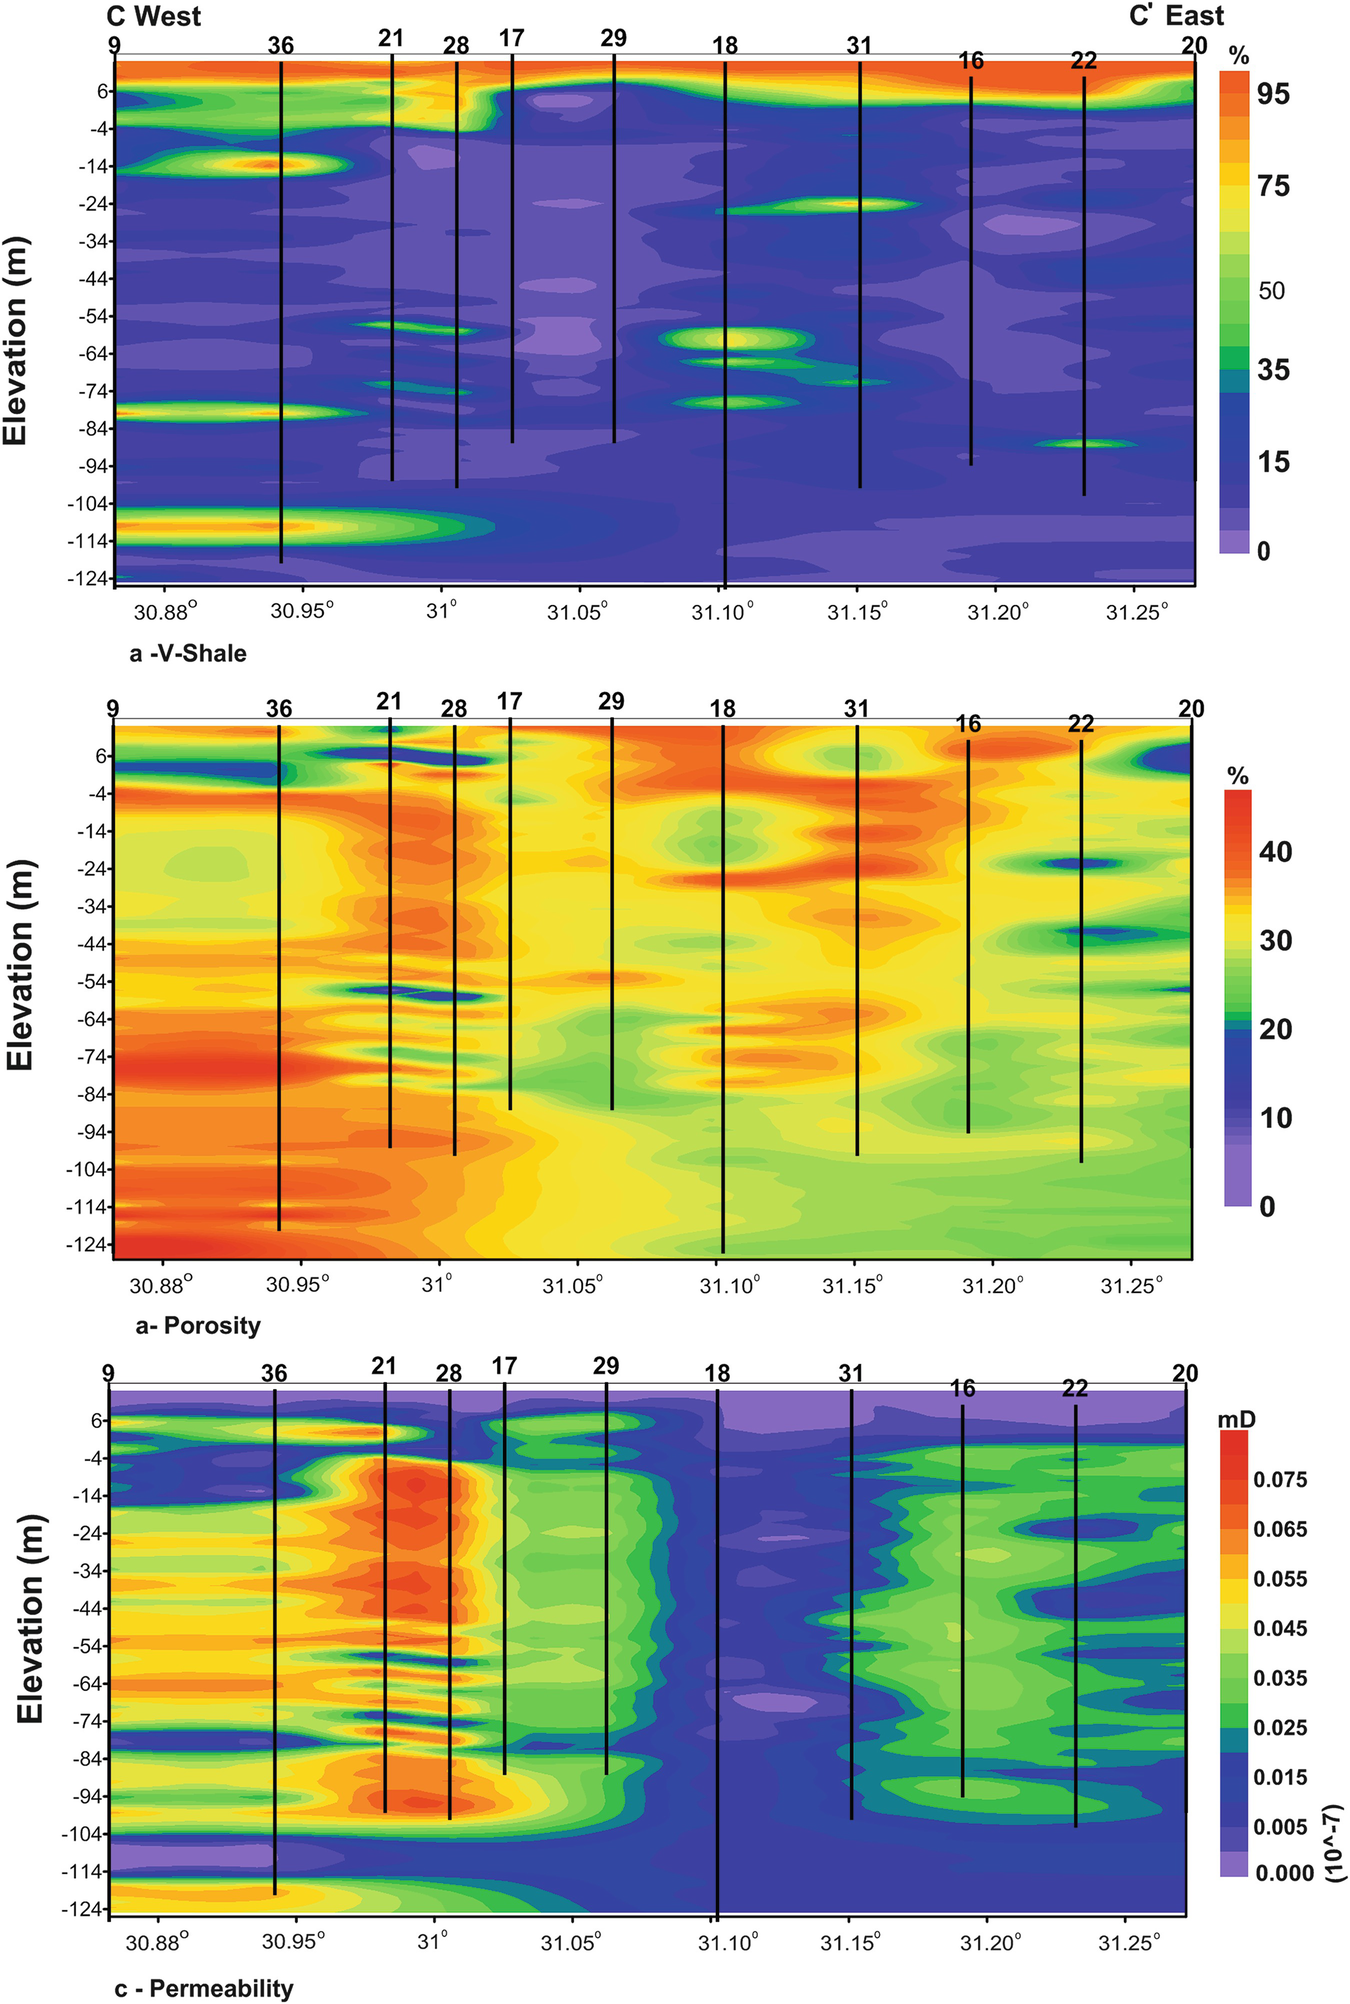
Vertical distributions of the calculated values of different petrophysical parameters along the cross section CC′
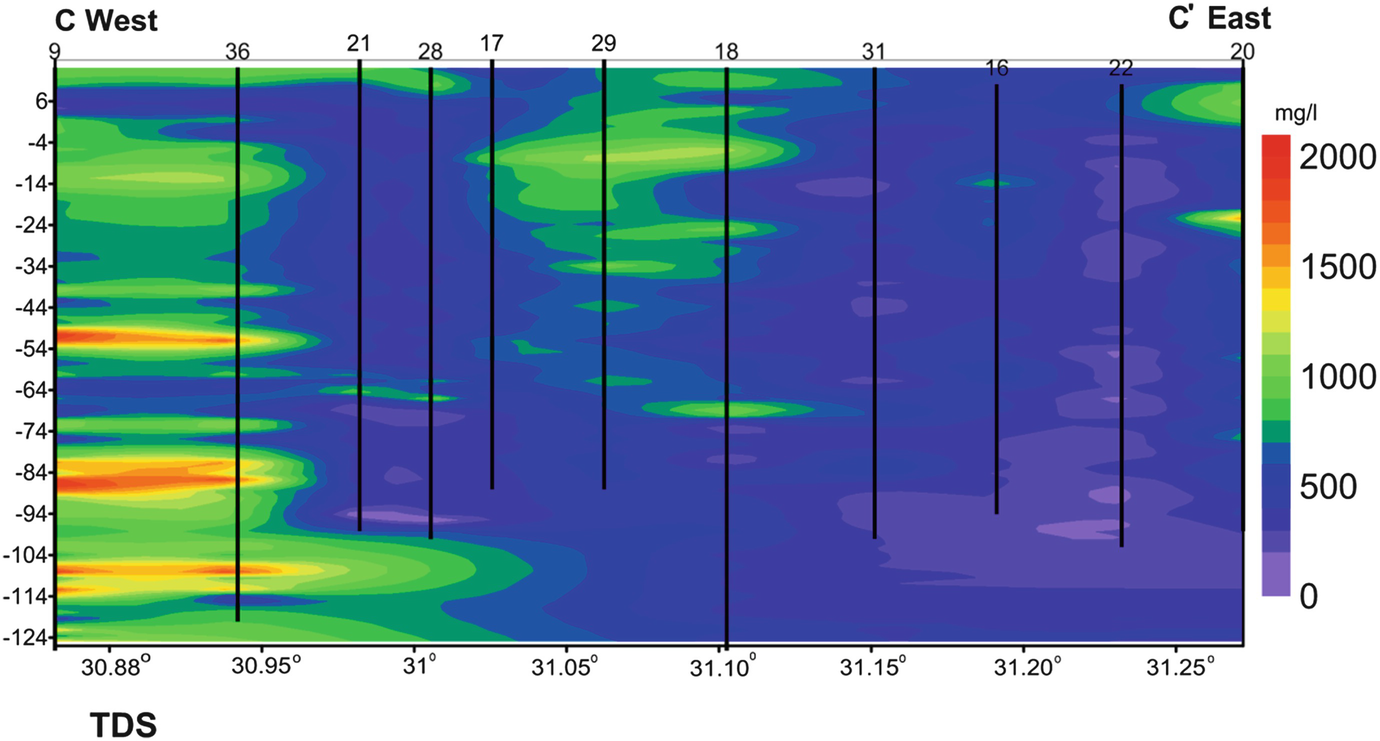
Vertical distributions of the calculated values of different groundwater salinity along the cross section CC′
4.2.1 The Clay Layer and Clay Content
The clay layer (V-shale is more than 75%) occupies the uppermost layer of the study area where its thickness increases gradually from the location of well 14 at the south to location of well 27 at the north and as lenses in wells 25, 30, 2, and 27 (cross section AA′, Fig. 6a), from location of well 8 at the west to location of well 27 at the eastern part (cross section BB′, Fig. 8a) and from well 9 at the south to location of well 22 at the eastern part (cross section CC′, Fig. 10a). The layers with V-shale ranging from 50 to 75% extends from well 14 at south to well 27 at north and as lenses in wells 25, 30, 2, 27, 3, 4, 21, 28, and 14 (cross section AA′, Fig. 6a), from location of well 8 at the west to location of well 27 at the eastern part and as lenses in wells 30, 2, 6, 33, 7, and 8 (cross section BB′, Fig. 8a) and from location of well 9 at the west to the location of well 20 at the eastern part and as lenses in wells 31, 18, 36, 9, 21, 28, and 22 (cross section CC′, Fig. 10a). As shown in the three cross sections, the sandy layer is interbedded with lenses of sandy clay and clayey sand.
4.2.2 Porosity
Porosity vertical distributions showed variable ranges in vertical and horizontal directions. Low values (0–20%) are recognized as lenses at different depths in wells, 25, 2, 3, 30, and 27 at the northern part (cross section AA′, Fig. 6b), well 7 at western part and wells 2, 3, 12, and 35 at the eastern part (cross section BB′, Fig. 8b), and wells 9, 36, 21, and 28 at western part and wells 22 and 20 at the eastern part (cross section CC′, Fig. 10b). Porosity with values ranging from 20 to 30% occupies most sections of wells 25, 3, 2, and 27 at the north and as lenses in wells 13 and 14 in southern parts (cross section AA′, Fig. 6b), most wells at the eastern part and in wells 7 and 8 at western part (cross section BB′, Fig. 8b) and most wells of the cross section CC′ (Fig. 10b). The porosity values higher than 30% were represented in wells 17, 21, 28, and 4 which occupies the central part of the study area and also found in the upper parts of wells 13 and 14 and extend toward south direction (cross section AA′, Fig. 6b), wells 33 and 6 at the central part and as lenses in well 7 and 8 at the western part (cross section BB′, Fig. 8b) and most of the wells of the cross section CC′ (Fig. 10b).
4.2.3 Permeability
Permeability vertical distributions showed variable ranges in vertical and horizontal directions. Very low values (>0.005 × 10⁻⁷ mD) are recognized at the upper most layer of the study area (upper clay layer of Bilqas Formation) which represented in the three cross sections (Figs. 6c, 8c, and 10c). Low permeability values of Mit Ghamr Formation ranging from 0.005 × 10⁻⁷ mD to 0.01 × 10⁻⁴ mD are shown in the northern part of cross section AA′ (Fig. 6c), in the eastern part of cross section BB′ (Fig. 8c), and in wells 18 and as lenses in wells 22, 31, 36, and 9 (section CC′, Fig. 10c). The permeability values generally increase to its highest values toward, the central part (wells 21 and 28) in cross section AA′ (Fig. 6c), the western direction (wells 7, 8, 33, 6) in cross section BB′ (Fig. 8c), and the eastern and western parts especially wells 21 and 28 in cross section CC′ (Fig. 10c).
4.2.4 Salinity
The salinity values (in term of the calculated TDS) distribution showed variable ranges in vertical and horizontal directions. TDS with values less than 500 mg/l occupy wells 13 and 14 and most parts of the other wells at depths more than 20 m (cross section AA′, Fig. 7), wells 8, 33, 6, 2, 3, 30, 2, and 30 as lenses at certain depths (cross section BB′, Fig. 9), and wells 22 and 31 and as lenses in wells 36, 21, 28, 17, 18, and 16 (cross section CC′, Fig. 11). TDS values ranging from 500 to 1,000 mg/l exhibit as lenses in wells 17, 21, 29, 2, 4, 25, 30, and 27(cross section A-A′, Fig. 7), wells 7 and as lenses in wells 2, 30, 12, and 35 at the eastern part (cross section BB′, Fig. 9), and wells 18, 29, 26, and 9 at the west and well 20 at the east (cross section CC′, Fig. 11). The highest TDS values (>1,000 mg/l) are represented in well 2 at the northern part of the study area (cross section A-A′, Fig. 7) and as lenses in wells 7, 2, 12, and 35 (cross section CC′, Fig. 11).
4.3 Hydraulic Conductivity
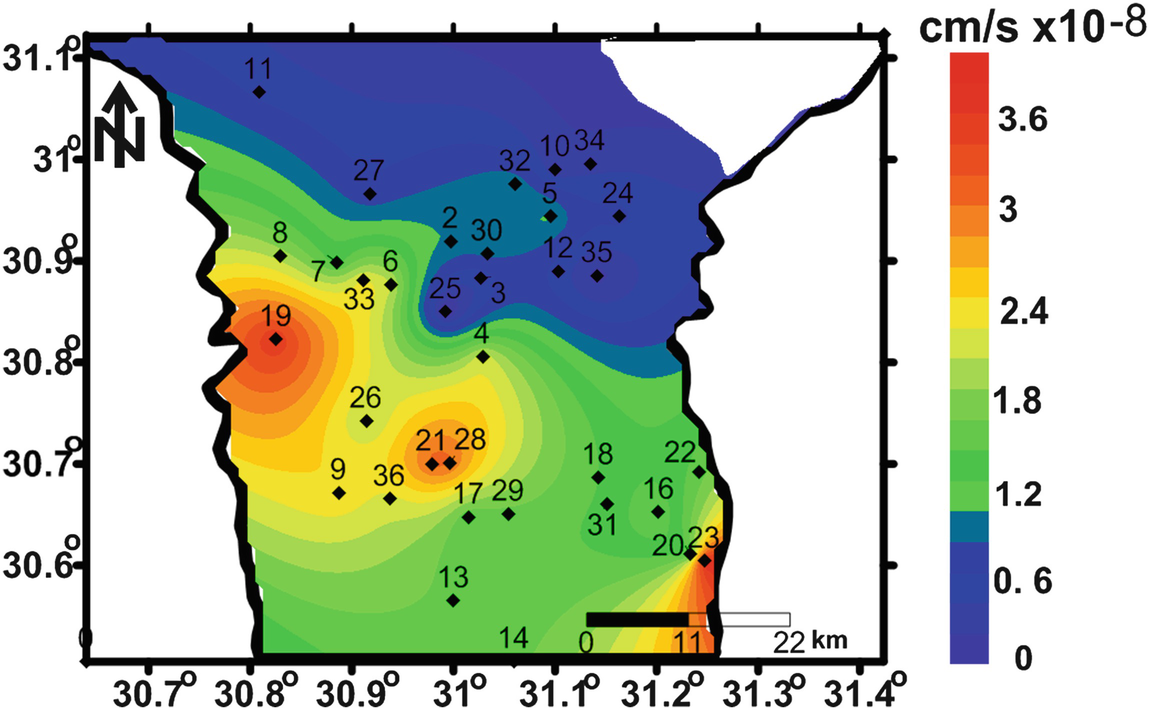
Spatial distributions of the calculated average values of the hydraulic conductivity of Mit Ghamr formation

Vertical distributions of the calculated values of the aquifer hydraulic conductivity along the cross sections AA′, BB′, and CC′
5 Conclusions
Electrical resistivity and gamma ray logs were used for 34 wells to identify the petrophysical, chemical, and hydrogeological characteristics of the Nile Delta aquifer due to its significant importance. The Nile Delta reservoir consists of two formations. The upper is the Bilqas Formation, which is of a clay nature and the lower formation is of a sandy nature and called Mit Ghamr Formation. According to the calculations used, the thickness of Bilqas Formation ranges from three meters in the southwest direction to 31 m in the northeast direction. The shale content ranges from 54 to 97%. The porosity ranges from 21 to 55% with an average of 24.71%. This layer has low permeability values ranged from 16 × 10−9 to 78 × 10−9 mD with an average of 30.71 × 10⁻⁹ mD. The calculations showed that the hydraulic conductivity of this layer is weak and less than 2 × 10⁻⁹ cm/s. The water salinity of this layer ranges from 200 mg to 1,600 mg/l. The increase in the thickness of this layer, the increase in porosity, the decrease in permeability and hydraulic conductivity, as well as the increase in the water salinity are to the north and northeast directions.
Mit Ghamr is the main aquifer in the region where its minimum value of the shale content is 4.5% and the maximum value is 22%. Lenses from the clay are scattered in different places and increasing in intensity in the northeastern direction of the region. Porosity ranges from a minimum of 19% to a maximum of 39%. The permeability recorded high values in this formation where it ranged from 0.1 × 10⁻² to 8.7 × 10⁻² mD. The calculations also showed that the hydraulic conductivity values for this formation ranged from 5.082 × 10⁻¹⁰ to 2.134 × 10⁻⁸ cm/s. In this layer, the increase in the shale content, the increase in porosity, decrease in the permeability and hydraulic conductivity, as well as the increase in salinity are to the north and northeast.
Acknowledgments
The authors are grateful to Tanta University for the financial support offered by the project number “TU-01-12-03” during the course of this paper.