Figure 10.1 Pyramid for Success
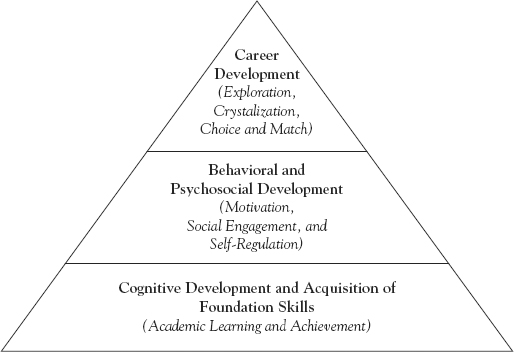
We have seen in the preceding chapters how academic achievement, psychosocial development, and career development each individually contribute to our understanding of student persistence and performance behavior. Our first goal in this chapter is to examine the interrelationship of these factors by proposing and testing a comprehensive model for understanding student success. In this model, we begin by stating that student cognitive development (achievement level) and acquisition of foundational skills are the cornerstone of college success. A student’s ability to do the tasks necessary for academic success (that is, coursework) is dependent on these skills. And we believe that academic success drives all other outcomes. Layered on top of these cognitive foundational skills are psychosocial development and career development factors. We call this stacked set of skills the “Pyramid for Success,” which is shown in Figure 10.1. The pyramid exists in the broader context of school and student social capital effects. In other words, all students must be understood within the unique institutional and personal circumstances that define who they are.
Figure 10.1 Pyramid for Success
The second major goal of this chapter is to connect our Pyramid for Success to institution intervention strategies as a robust way of understanding what factors promote or impede college student success. We provide two very different examples. The first is a specific institution demonstration project looking at student achievement and behavior on developmental class outcomes. The second is using meta-analytic techniques detailed in Chapter Eight to test the overall effects of different institution intervention strategies on student retention and performance behaviors. We also test how well interventions “work through” psychosocial factors to facilitate positive change and outcomes.
We believe academic achievement and college readiness are essential drivers to first-year academic performance (Allen & Robbins, 2010; Allen, Robbins, Casillas, & Oh, 2008). In turn, we have shown that first-year academic performance is the strongest predictor of retention and degree attainment. In Chapter Seven, we detailed academic achievement factors for college readiness by describing the importance of meeting benchmarks in Mathematics, Science, English, and Reading that correspond to the likelihood of obtaining a “B” or better in general education courses required to succeed in both two-year and four-year colleges. Put another way, the ability to master academic coursework is the foundation of all student success, including persistence behavior.
We also know that student academic readiness includes psychosocial attributes or behaviors as categorized through the motivation, social engagement, and self-regulation control factors we discussed in Chapter Eight. These factors are essential for student success. We believe behavioral and psychosocial development influence both persistence and performance behavior. For example, students who do not comply with their homework and other course demands are less likely to succeed. And those students who do not feel connected are less likely to persist or to transfer from a two-year to a four-year college institution. And finally, those students who are not able to manage daily hassles and support a sense of academic self-confidence are less likely to succeed in their courses and to persist into their second year.
We also believe that informed career decision making that allows students to match their interests, values, and abilities to college major and career choices result in greater congruence or career fit. As we have highlighted in Chapter Nine from both Theory of Work Adjustment (Dawis, Fruehling, Oldham, & Laird, 1989; Lofquist & Dawis, 1991) and Person-Environment (PE) fit models (Holland, 1997), the greater degree to which career fit occurs, the more likely it is we will see increased college grade point averages, retention rates, and graduation rates (Tracey & Robbins, 2006). In fact, we know that those students entering college with higher degrees of career fit are more likely to earn greater income 10 years after college graduation than those who demonstrate lower career fit (Neumann, Olitskey, & Robbins, 2009).
But we know that students do not operate in a vacuum. They exist in a real world where they have varying access to social support and to financial and other resources. We call this social capital (Wimberly, 2000). In many ways socioeconomic status (SES) is an important proxy of social capital because it reflects the financial resources available to a student. But beyond financial resources, social capital refers to a student’s exposure to and work with significant others who can model what college degree attainment and career success look like. Maintaining these goals are key determinants to building a commitment to college success and to sustaining a meaningful career path. Another demographic predictor, gender, may reflect another source of social capital given that women and men are differentially exposed to role models and other reinforcements that help them internalize and act on a broad range of measured interests and values when making college major and career choices. Social capital is not the only contextual factor. The postsecondary institution itself serves as a key variable in understanding student experiences, whether relating to the rigor of the courses, a sense of connection and belonging, or access to financial and other resources necessary for college success. Interestingly, drawing from recent research on student learning outcomes (Blaich & Wise, 2011), we know that student individual differences and variations in learning are as great within institutions as they are across institutions. In other words, institutional differences in learning are less critical than student Pyramid for Success factors. Nonetheless, we want to better understand individual student factors within the context of social capital and institutional features.
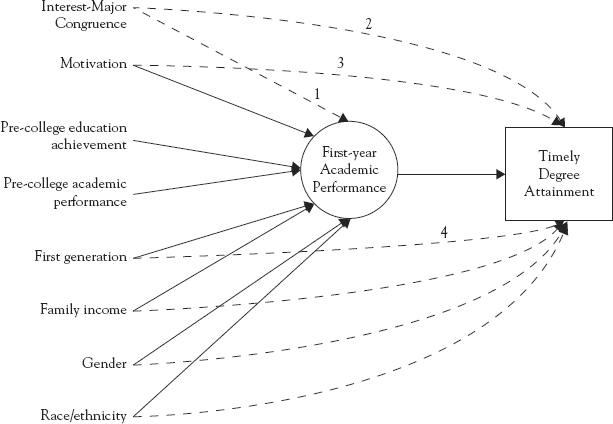
Allen and Robbins (2010) tested the Pyramid for Success model using a longitudinal database including 3,072 entering four-year college students in one of 15 institutions and 788 entering two-year college students in one of 13 institutions. The authors tested the direct effects of interest-major congruence, motivation, ACT score, high school GPA, gender, and SES on first-year academic performance. They then tested the direct and indirect effects of these predictors as they worked through first-year academic performance to predict timely degree attainment. They also controlled for institutional differences or institutional variation without necessarily understanding the reasons for this variation. We present this theoretical model in Figure 10.2, using solid lines for paths based on previous research that showed significant effects, and dashed lines for paths based on hypothesized relationships between antecedent factors and persistence or time to degree attainment.
Figure 10.2 Expected and Hypothesized Paths to Outcomes
Note: Solid lines represent established paths; dashed lines represent hypothesized paths.
In Figure 10.3, we present the result of these path analytic models, presenting the four-year and the two-year results side by side for each path. Turning to the four-year students, we see that interest-major congruence directly predicts time to degree attainment (.162). We also see a strong effect for first-year academic performance on timely degree attainment (1.027). We also observe a gender effect where women are more likely to graduate on time than men (−.270). We also observed that first-generation students are less likely to graduate on time (.068).
Figure 10.3 Results-Path Model
Note: Weights for estimated paths: four-year, two-year. Significant paths are marked with an asterisk (*).
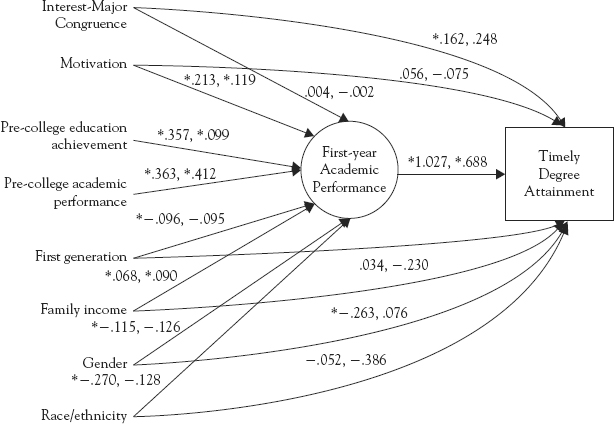
Turning to the two-year students, the only key driver of graduation from two-year colleges is first-year academic performance (.688). That is, given the many possible outcomes for two-year students (drop-out, transfer, complete), the one central success factor for persistence is mastery of the first-year coursework. Given the high remediation rates of entering community college students, this is a major barrier to success. We highlight a case study addressing this problem later in this chapter. It is clear that these direct effects underscore the importance of assessment and course placement (Chapter Twelve), developmental education and learning assistance (Chapter Thirteen).
We also observe the indirect effects of traditional predictors and student motivation as they work through first-year academic performance to influence timely degree attainment. Specifically, in both four- and two-year colleges student motivation (.213 and .119, respectively), student pre-college education achievement level (.357 and .099), and pre-college academic performance (that is, HSGPA at .363 and .412) are all critical determinants of first-year academic success. Within the four-year sample, we also see that first-generation status (.068), family income (−.115), gender (−.270), and African-American status (−.270) are predictive of first-year academic success.
To summarize, the research of Allen and Robbins (2010) tests the simultaneous effects of academic preparation and motivation and career interest-major congruence on first-year academic performance and timely degree attainment. They find that first-year academic performance is critical for long-term college success. They also find that academic preparation, motivation, and career interest–major congruence are all essential. Moreover, student demographic factors, including whether you are first-generation student, a man or woman, and black, are likely to affect first-year academic performance and whether you graduate on time. This research highlights the range of student individual difference factors we addressed in Chapters Seven through Nine; they are all important in understanding student academic performance, persistence, and timely degree attainment. Some factors work indirectly through academic performance, whereas other factors, such as career interest–major congruence, work directly to affect timely degree attainment behavior (and therefore persistence). These research findings are consistent with prior research on long-term college success and the need for students to be prepared for first-year college coursework. Allen and Robbins (2008) demonstrated the direct effects of career fit and college major stability and the centrality of first-year academic performance on time to degree attainment. Allen, Robbins, Casillas, & Oh (2008) modeled third-year retention and transfer behavior using academic performance and psychosocial predictors.
There are several implications of this research. Retention efforts must incorporate approaches that promote academic success through both academic and motivational strategies. Academic skills are critical, and we know that psychosocial factors such as motivation are key to identifying at-risk students unable to engage successively in coursework or to persist into their second year. Academic discipline targets behavioral compliance and course persistence behavior. It is a critical focal area that postsecondary institutions should address to maximize likely student success.
Programs geared toward first-generation students are likely to help support these students and these programs should continue after their first year. More controversial is whether to target men, who are at greater risk than women for sustaining conscientious and dedicated academic behaviors. We already know that there are a diminishing number of men seeking and finishing postsecondary education (ACT, 2010a). We also see that African American students are less likely to succeed than other groups, which is in part because on average they are less academically prepared (ACT, 2010d). Postsecondary institutions need to ensure that culturally sensitive and effective interventions tied to academic success are made available to at-risk students. We will talk more about what these interventions should focus on later in the chapter.
Effective career and educational planning for entering first-year and undecided students also offer an important means of improving student persistence and timely degree attainment. We know that career fit is related to college major stability (Allen & Robbins, 2008). The ACT, for example, includes a career assessment that helps plot an individual’s measured interest profile on a World-of-Work Map, which locates within a quadrant system tied to Data-Ideas and People-Things, the location of occupations and college majors. Postsecondary institutions can use individual student results from the ACT record to help map to their potential college and career choices to inform decisions, and to maximize career fit from the perspectives of cognitive ability and career interest.
The challenge, then, is to create multifaceted intervention programs that target key student factors highlighted in the Pyramid for Success and that promote both academic success and persistence behavior. For example, getting students into the “right” general education courses is only one step. Programs are also needed to help students overcome boredom and frustration, comply with demanding homework and class schedules, and manage multiple deadlines.
In the next section, we detail an institutional use case that highlights how to embed student interventions within an academic course context while seeking broad university ownership and resources. In this example, we target remedial education and student academic behavior.
It is a long-standing problem that students entering community college and other postsecondary education are not academically prepared for college-level coursework (Porchea, Allen, Robbins, & Phelps, 2010). Without the necessary prerequisite skills and knowledge, underprepared students are less likely to succeed in college courses or to return for a second year (ACT, 2005). The primary method for helping underprepared students to degree attainment is developmental instruction (see Attewell, Lavin, Domina, & Levey, 2006 for review), a topic we cover in detail in Chapter Thirteen. Due to their open enrollment policies, much of the remediation burden has fallen on two-year colleges. Between 2000 and 2008 the percentage of two-year college students taking at least one developmental course has risen from 39% to 44% (NCES, 2010d). In a study by the Community College Research Center at Columbia University (Biswas, 2007), the estimated percentage of students needing remediation was greater in math (70%) than in English (34%). Clearly, math instruction should be an area of concern at all levels of education.
As Adelman (1999) pointed out, mathematics preparation is the key to eventual postsecondary success. And we know that initial course placement is essential to putting students into classes where they are able to master the material aligned with eventual successful completion of college algebra. The dilemma of setting rigorous course placement standards was highlighted by Jacobson (2006), who pointed out that placing entering student in noncredit-bearing developmental mathematics courses increased their likely mastery of foundational skills needed for college algebra, but also resulted in reduced program completion due to high attrition rates. Bahr (2010) makes a similar point about student compliance and motivational behavior when highlighting the disparities in completion rates and differing levels of initial math ability. In other words, student persistence behavior was as critical in understanding course completion and success as the math “skill gaps” themselves.
Clearly, we want to place students into courses for which they are likely to succeed, but student attrition is a reality that must be also be addressed. Best practices for learning gap assessment and course placement are discussed in Chapter Twelve. The effectiveness of remedial math courses has been a topic for research for two decades. Golfin, Jordan, Hull, & Ruffin (2005) tried to answer the question of what approaches and strategies work best to strengthen adult students’ math skills to help them progress into college-level courses. They highlighted the importance of accurately placing students into the appropriate level math course. They further called for tailored instruction based on effective diagnostics.
The goal, then, is to combine effective course placement, diagnostic testing used to target curricular instruction, and student motivation and behavioral compliance factors to ensure effective completion of developmental mathematics instruction. In essence, we want to combine best practices in the individualized delivery of math developmental education with our knowledge of student motivation and academic behavior (Robbins et al., 2004; Robbins, Oh, Button, & Le, 2009).
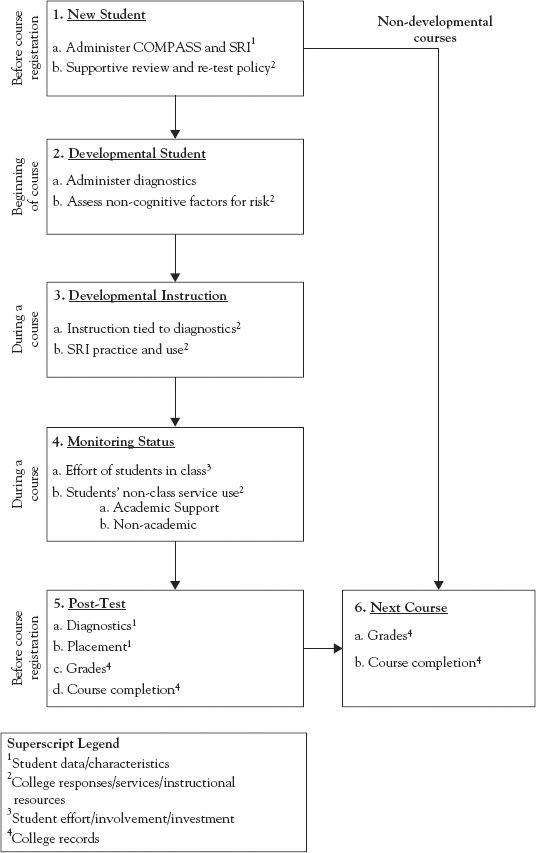
Wilbur Wright College created such a model, as shown in Figure 10.4, where they used both cognitive and psychosocial assessments to help place, diagnose, and intervene across academic and behavioral domains. They expected that entering student motivation would affect compliance behaviors during the course and that these behaviors would moderate post-course knowledge and course completion. This model allowed them to examine the extent that pre-course academic skills and course behaviors, separately and together, influence course success. Further, they expected that those students with high behavioral compliance will have much higher completion rates and knowledge gain than those students with low behavioral compliance, regardless of entering cognitive ability level.
Figure 10.4 College Developmental Course Best Practices
Not surprisingly, Wilbur Wright observed that entering students, on average, have large discrepancies in their skills across math content domains. For students across intermediate and precollege math course placement ranges there was a broad difference in mathematics proficiency. And just as important, the variability within key content areas within intermediate or precollege mathematics suggests that the typical student’s diagnostic score profile features at least one area of weakness and one area of strength (relative to other areas).
Faculty were asked to rate students on four behaviors, including homework compliance, attending class, class participation, and working with peers. These ratings were strongly related to one another (mean correlation = .75). A composite of the four ratings was highly reliable. Further, the average of the four individual ratings was moderately correlated with average post-test results across both math courses (mean correlation =.31), as well as average gain in pre- and post-test scores (mean correlation = .33).
Analyses were conducted using a combination of COMPASS mathematics diagnostic scores and student behavior ratings to predict achievement-based outcomes:
As highlighted in Tables 10.1 and 10.2, student effort rating levels were associated with whether students passed the class. In other words, our findings show that regardless of pretest mathematics knowledge, behavioral compliance was associated with success. This held for both foundational and elementary remedial mathematics classes.
Table 10.1 Success Rates Passing Foundational Studies Math (Spring 2009), by COMPASS Pretest and Behavioral Rating Levels.
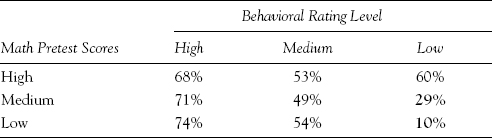
Table 10.2 Success Rates Passing Elementary (Precredit) Math, by COMPASS Pretest and Behavioral Rating Levels.

In fact, the moderation of behavior on outcomes is striking. Turning to Table 10.1, we see that those students with high behavioral compliance were likely to graduate at 68% to 74% whereas those with low behavioral compliance dropped down to 10% graduation! We see a similar pattern in Table 10.2. These findings suggest that behavior ratings can serve as a reliable and valid measure of student effort, as well as a useful predictor of student achievement in a course.
As can be seen in Table 10.3, there are dramatic differences in knowledge gains and in course completion rates depending on student effort or behavior compliance. Those students with higher entering knowledge are more likely to do well if they engage in appropriate classroom and homework activities while those students who do not comply have much lower probabilities of success. Conversely, those students at the lower end of the knowledge spectrum and who demonstrate low compliance behaviors are at high risk for failure.
Table 10.3 Mean Math Gain Scores for Elementary (Precredit) Math, by Math Pretest and Behavioral Rating Levels.

Results from this study reinforce the importance of understanding student motivation and behavior on developmental course success. Higher student effort ratings are associated with increased achievement at the end of a course (that is, higher posttest scores). And higher student effort ratings are associated with a much greater likelihood of persisting and passing the course. In other words, as important as effective course placement and diagnostic assessment and instruction are to knowledge gain and academic mastery, a student’s willingness to do the work is absolutely essential for course completion and success. Though an intuitive finding, it is not clear that institutions address student behavior as part of the core mission of classroom instruction. Within key gateway courses, our findings suggest this is imperative.
We highlighted the use of COMPASS diagnostic score profiles to show at least one area of weakness and one area of strength (relative to other areas) for most students. This profile of strengths and weaknesses can be used to more effectively target instruction/intervention. Not all students require remediation in all content areas, and helping instructors and students target class modal and individual profiles, respectively, may improve not only student learning but also student engagement in that learning.
And as we demonstrated with our contingency tables, it is the combination of cognitive ability and behavior that is associated with high rates of mastery and persistence outcomes. Students with high behavior rating levels and medium to high knowledge given the course placement band have on average a 70% chance of success. Conversely, those students with low behavioral compliance rapidly drop off, regardless of knowledge mastery (10% to 60% across knowledge pretest score, and 10% to 74% across behavior rating level).
Our findings lend credence to the Strategic Intervention Model for Developmental Math Education highlighted in Figure 10.3. In this model, each new student is assessed for both psychosocial risk and effective course placement. Based on extensive research (Robbins et al., 2004, 2009), we know that motivational components, including academic discipline and commitment to school, and self-regulatory components, including academic self-confidence and emotional stability, are critical to academic mastery and persistence behavior. Concurrently, effective course placement is used to ensure that students are placed in the appropriate band of coursework to move them toward fulfilling their college algebra requirement. Further, teachers are asked to use diagnostic testing to profile the class strengths and weaknesses and to target and monitor instructional gains accordingly. Finally, we promote a sense of shared responsibility by asking students to meet with an advisor to discuss their academic goals, review psychosocial and knowledge profiles, and match student needs to campus resources. Faculties are encouraged to refer students whose classroom behaviors are in the low to medium compliance range and who do not appear able to improve them.
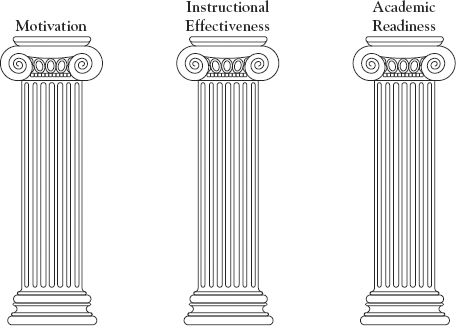
To summarize, we believe that institutions must rely on three pillars for success: Student Academic Behavior and Motivation, Instructional Effectiveness, and Academic Readiness. These pillars are illustrated in Figure 10.5.
Figure 10.5 Three Pillars of Success
Given the variation in student academic readiness and behavior, we must be prepared to:
As we highlighted at the beginning of this chapter, it is the “Pyramid for Success,” or the role of entering academic achievement, career fit, informed decision making, and motivation to succeed in college classes that drive academic performance, college major stability, and timely degree attainment (see, for example, Allen & Robbins, 2008, 2010; Allen et al., 2008). So what does this mean for postsecondary institutions? As we have asserted in several places, early risk assessment and targeting of interventions aimed first at academic success and then at informed career decision making optimize first-year academic success, college major stability, and timely degree attainment. This requires institutional coordination so that course placement, developmental education, academic advising, and first year transition programs complement each other by identifying, targeting and intervening with students who need help. It also increases the need for a comprehensive approach to student success that considers the full array of academic, psychosocial, and career factors that underlie student success.
In this section we highlight the results of a major meta-analytic study (Robbins, Oh, Button, & Le, 2009) of the effects of varying college interventions on both college performance and persistence outcomes as mediated by student psychosocial factors as described in Chapter Eight. Our focus is to highlight what research tells us about what works to affect college student academic success and retention behavior. Further, it is to better understand how student differences in motivation, social, and emotion control factors influence interventions.
In Chapter Eight, we discussed the use of meta-analysis and validity generalization as a standard practice to interpret the aggregation of multiple individual studies that allow for clear and interpretable findings leading to evidence-based practices. By correcting for measurement error and range restriction and by weighting multiple studies based on their sample size, we are able to calculate treatment effect sizes that are much more reliable and generalizable than would otherwise be found in any individual study (Hunter and Schmidt, 2004). In Robbins et al. (2009), prototypic college intervention strategies were sorted into four broad categories: academic skill, self-management, orientation, and First-Year Experience (FYE). These categories, as well as one representing a hybrid of academic and self-management characteristics, are listed in Table 10.4. The academic skill interventions were typically eight hours long, and reflected those programs geared toward improving skills and knowledge deemed critical for successful academic performance. These programs included study skill programs, learning strategy programs, and academically targeted time management programs. Self-management skill programs (typically six hours long) targeted emotional and self-regulatory behaviors including anxiety reduction, stress management and prevention, and self-control and self-acceptance interventions. The third type of intervention program, freshman orientation, which typically ranges over three days or 21 hours, was a short-term, intensive socialization approach to help students learn more about college and college life. The fourth intervention category, FYE, was distinguished from orientation programs in that such programs tend to occur after the school year began, lasted a minimum of eight weeks, and were frequently tied to formal classroom schedules whether credit-bearing or not. FYE programs typically covered 45 hours of face-to-face contact. And finally, hybrid programs combined academic skill and self-management activities and were 12 hours in modal length.
Table 10.4 Categorizing College Interventions.
| Orientation (21 hours)—summer, early fall, time-limited |
| Freshman Year Experience (45 hours) |
| Academic (8 hours) |
| 1. Study skills |
| 2. Learning strategies |
| 3. Note-taking |
| Self-Management (6 hours) |
| 1. Stress management |
| 2. Self-control |
| 3. Anxiety management |
| Hybrid of Academic & Self Management (12 hours) |
As highlighted in Chapter Eight, Robbins et al. (2004, 2006) also categorized individual difference mediators by showing that student educational success was associated with motivation, emotional, and social control factors. Emotional control refers to a student’s ability to manage the anxieties and stresses associated with daily college life. Motivational control refers to a student’s ability to stay goal-directed, act on the tasks and demands of academic coursework, and sustain energy to successfully fulfill these academic task demands. Social control refers to the feelings of being connected to others and to feeling actively engaged and participating in college life.
Robbins et al. (2004, 2006) constructed the Student Readiness Inventory (SRI) to measure facets of these three domains. These categories as well as the related SRI scales are shown in Table 10.5. Academic discipline and commitment to college were salient for motivation, emotional control, and academic self-confidence in the emotional control domain. In addition, social connection and social activity were salient in the social control domain. The researchers tested longitudinal prediction and intervention efficacy models using these facets to understand GPA and retention outcomes.
Table 10.5 Categorizing Psychosocial Factors (PSFs) & SRI Scales.
| Categories | SRI Scales |
| Motivational Control | Academic Discipline |
| Commitment to College | |
| Emotional Control | Emotional Control |
| Academic Self-Confidence | |
| Social Control | Social Connection |
| Social Activity |
As highlighted in Figure 10.1, Robbins et al. (2009) hypothesized that different intervention strategies would be mediated by different control factors to understand academic performance and academic retention behavior. More specifically, they proposed that academic skill interventions would work through emotional and motivational control to affect academic performance and that academic performance would directly affect retention behavior. They also proposed that self-management interventions would work through motivational control factors to affect both academic performance and academic retention. And finally they believe that FYE and orientation would work through social control and motivational control to affect academic retention behavior.
By testing the model hypothesized in Figure 10.1, we can fully understand several critical questions: first, which intervention strategies have direct and indirect effects on both performance and persistence behavior? Second, which of these interventions are improved by working through mediation of control factors to increase student persistence and performance outcome behaviors? And third, how central are academic mastery and performance to academic retention behavior? Answering these questions is quite important to illuminating which key institutional intervention strategies will have positive student outcomes.
Robbins et al. (2009) found that academic skill–based interventions have the strongest effects on academic performance and success. These interventions work directly to predict performance, but they also work through motivational control factors. Motivational control, in turn, is predictive of both performance and retention behavior. We highlight these findings in the meta-analytic path models found in Figure 10.2. Put another way, the combination of academic skill interventions and motivational control optimize the likely positive influences on student performance and student retention. We see this by observing a direct effect between ASI and academic performance (path = .13), and also that ASI works “through” motivational control (path = .27) when affecting academic performance (path = .14).
We also see that academic skill interventions work through emotional control factors to understand academic performance. This last finding suggests that increasing students’ emotional control, such as their internal regulation of academic self-confidence or reduced anxiety around academic tasks, will improve academic performance outcomes. This is highlighted by the significant paths between academic skills intervention on emotional control (.34) and EC on academic performance (.20).
Self-management interventions also play a positive role in understanding academic performance and retention behavior, as illustrated in the path meta-analytic models shown in Figure 10.3. These interventions directly affect emotional, motivational, and social control factors, and work through them to affect either academic performance (see motivational and emotional control) or academic retention (see social control) factors. These robust findings were somewhat surprising and point to the importance of targeting student self-management when trying to improve performance and retention behaviors. Those intervention strategies directed towards a student’s sense of motivation and social engagement are likely to optimize performance and retention. These findings highlight the potential payoff that self-management interventions have in increasing student motivation and on improving retention.
A surprising finding from this exhaustive meta-analytic study was the limited influence that first-year experience (FYE) interventions have on academic performance and retention behaviors. In fact, Robbins et al. (2009) found no direct effects of FYE on these outcomes. Rather, they found that FYEs only indirectly work through motivational and social control to influence performance and retention behavior, respectively. These findings are illustrated in Figure 10.4. The authors did not test specific orientation interventions because there were not enough studies to derive or test these meta-analytic path models, but they did have similar weak bivariate effects on student outcomes. Given how FYE strategies are so common and are embedded in a significant portion of institutional practices, these findings suggest that postsecondary institutions need to seriously rethink how to focus resources directly tied to improving academic performance and retention. These findings are also an interesting comparison to institution perceptions of important retention practices.
To summarize, academic skill interventions have the strongest effects on academic performance. Self-management interventions have the strongest effects on academic and retention outcomes, whereas socialization interventions directly affect retention. These findings make sense given that academic skill interventions directly attack those skills necessary to be successful in first-year academic performance. And it is critical to understand that academic success is the driving engine of long-term retention behavior. To a lesser degree, self-management interventions directly affected performance and retention. In retrospect this is not a surprising finding given that focusing on academic performance is tied to improving emotional control functions.
It is surprising how many comprehensive FYE programs are listed as critical to institutional practices influencing student success—and yet, we found weak to negligible effects on student outcomes. There is a significant disconnect between institutional practice and evidence of success. It may be that FYE programs are too broad-based. They neither target specific at-risk students or critical academic performance or psychosocial dimensions. And they may be tailored to affect student satisfaction and knowledge dimensions rather than targeted toward the critical academic skill and performance behaviors that we have found are essential for long-term retention.
Surprisingly, we found academic skill interventions work through both motivational and emotional control factors. This suggests that those students who feel better equipped to handle academic coursework are likely to succeed. That is, these two control factors play important mediating roles between academic skill and motivational-based interventions to optimize student success. The goal, then, is to promote interventions that boost motivational and emotional control factors to directly and indirectly improve academic performance
The disconnect between evidenced-based practices and outcomes suggests the criticality of evaluating institutional practices and of relying on evidence based models to promote theories of action. It is clear that colleges and universities must evaluate the cost-effectiveness of commonly held practices and must emphasize and prioritize those interventions that are most likely to promote positive outcomes given the central role that academic mastery plays on retention.
We have presented an exhaustive research study to highlight which interventions are most effective and how they work through student control factors. Certainly, we have called into question the efficacy of the FYE model if the goal is to improve student academic performance and retention behavior, and we have argued that those strategies driving first-year academic success are most beneficial. We now turn to the importance of determining whether the benefits of institutional practices outweigh the costs. We believe institutions should be engaging in ongoing evaluation of their strategies and monitoring outcomes to design the most cost-effective interventions possible and to ensure that improvements are made to optimize student success across multiple stakeholder groups.
To accomplish what we propose, institutions must integrate three essential strategies: adopt informatics technology (Educause for information, at http://www.educause.edu/) to capture student service use, systematically assess student risk and assign services based on particular needs, and create a feedback and evaluation system that evaluates the relationship between service use and risk on student academic and retention outcomes.
Every institution is unique, but it is also true that effective institutional retention practices require buy-in from multiple stakeholder groups, including faculty, central administration, academic and support services, advising at both central and college level, information technology, and management information units. A change management process is required that effectively articulates institutional goals to adopt evidence-based practices driving clear student success outcomes. This process requires collaboration across units, the willingness to decentralize resources the adoption of a common language, and a basic understanding of student risk and student success.
We present a use case of how one four-year college went about a systemwide change management process to affect student academic performance and retention behavior. This study is highlighted in Robbins et al. (2006), which details the innovative approach taken to assess student risk, resource and service use, and monitor student outcomes.
Northern Arizona University is a public comprehensive four-year institution with approximately 800 faculty serving 22,000 students. They historically witnessed 30% dropout rates after the first year. Through institutional leadership, they committed to a broadscale change-management process, including the implementation of a card swiping system to monitor resource use, the systematic use of a student risk assessment for all entering first-year students (the SRI), and the coordination and implementation of strategic intervention model based on student risk models derived from the SRI.
Institutional goals included early identification of and contact with at-risk students, the collaboration but not duplication of services, a systematic model that addressed the whole student, and the reliance on the framework theory of action based on research. The creation of a network of academic and social resources is a major undertaking. A vice president identified a group of staff to spearhead this effort. The working team identified target populations at risk, services linked to student needs, campus collaborators including FYE and first-year advising center, and a process for sending students to the most appropriate office based on risk assessment. This process is outlined in Table 10.6.
Table 10.6 One-on-One Meetings in Student Affairs.
| Assign students to programs/office according to service populations |
| Look up student schedules and set appointment times |
| Send postcard home with appointment time |
| Send postcard to campus address with appointment time |
| Personal e-mail with appointment time |
| Appointment time/date placed on student’s web calendar |
| Reminder phone call 1–2 days before appointment |
| Facebook contacts and text reminders |
| If miss scheduled meeting, protocol for rescheduling at least two more times. |
Assigning students required early administration of the Student Readiness Inventory (ACT, 2008) and an agreement that any student identified as at risk would be required to come in for an initial appointment at an appropriate location before being allowed to sign up for classes. In essence, this intrusive advising approach was adopted by all stakeholder groups based on a belief that many of the most needy and at-risk students would be least likely to seek services. A waterfall approach was used where summer programs targeted disadvantaged students first, but student academic advising staffs were made available for all other students. One-on-one meetings reviewed results of the Student Readiness Inventory, acknowledging student strengths and challenges, and students were referred to campus activities and resources. A student portal was built that allowed students to follow up in understanding their assessment results and also in pursuing campus resources.
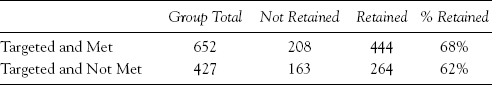
After a year of tracking entering students, an evaluation of these intervention efforts was conducted by the multiple stakeholder groups. From an outcome perspective they saw that the number of students on academic probation dropped from 32% to 18% for those students who met an initial counselor or advisor. Not surprisingly, nontargeted students did about the same as previous years, with over 74% retaining one year later. These percentages as well as the percentage of the targeted students retaining one year later are reported in Table 10.7. Targeted students who had a meeting with a counselor or advisor were more likely to return the following year. Targeted students also fared better than in past years both in terms of cumulative GPA and academic probation and second-year retention.
Table 10.7 2007 Retention in 2008.
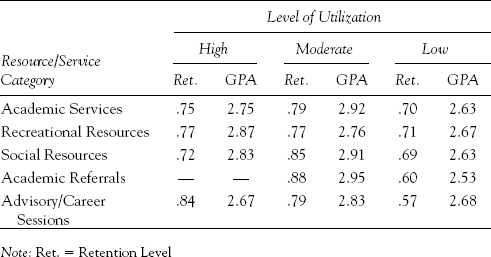
As interesting as these overall findings are, perhaps more important was an analysis of the relationship between student service use by risk level and outcome. As highlighted in Table 10.8, we summarize different service use categories ranging from academic services to recreational services, the level of use of each service, and average retention and GPA rates within each cell. As can be seen, students in the moderate use category had the best overall outcomes. This was not true for those students seeking advising and career sessions where average outcomes for retention were greater in high use categories than moderate use.
Table 10.8 Resource and Services Utilization.
Focusing specifically on academic service use and psychosocial risk level, we present in Table 10.9 a breakdown of service use based on number of sessions and risk level. You can see in this table that those students at highest risk were most likely to benefit with proportionate improvements in both retention and GPA greater than those students least at risk. This does not mean that those students least at risk did not have higher GPA and retention rates, but the proportional changes were greatest for the higher students. This finding emphasizes the benefits of targeting resources to those most at risk, especially given that they are the least likely to seek them out!
Table 10.9 Association of Risk Level & Academic Service Use on Retention & First-Year GPA.
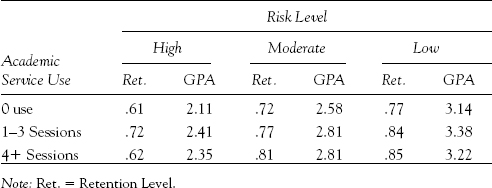
Another interesting finding observed in the Table 10.9 is that those students who use services for four or more sessions saw a drop in their cumulative GPA and the overall rate of retention. This finding suggests that there is an optimal threshold of service use and that once it’s crossed, outcomes diminish. Without understanding fully the reasons for this, NAU put in a flagging system so that when students reached a four-session threshold, service providers were asked to evaluate student status and to consider alternative actions to ensure student needs were being met.
We believe this is an exciting demonstration of the integration of informatics to evaluate the impact of a wide-scale retention initiative; the critical ingredients included the systematic use of a risk assessment, institution-wide leadership and coordination of change management, and effective evaluation or monitoring of student outcomes (Robbins et al., 2006). To summarize several of the key findings, we offer the following:
NAU is putting into place many of the practices that Robbins et al. (2009) highlighted in their integrated meta-analytic path analysis. They are treating academic preparation and performance as the hub of student success. They are clear on their learning goals. They are strategic in the use of resources. And they’re not afraid to reach out to those students least motivated and in greatest need of service.
We end this chapter by emphasizing that those practices focused on academic success, and which take advantage of student strengths in motivation, social, and emotional control domains, are most likely to result in increased academic mastery and retention behavior. Our focus was primarily on four-year institutions, but we believe the same determinants of student success (for example, readiness to master college-level material, psychosocial risk, and effective institutional practices) apply to two-year-institutions (see Porchea, Allen, Robbins, & Phelps, 2010, for research on the key predictors of community college success). In essence, our Pyramid for Success model is a robust organizer for creating comprehensive and strategic intervention strategies that affect multiple student success outcomes. Although individual institutions, and students, each have unique characteristics, we believe that rational risk assessment tied to optimal interventions across the array of institutional central and college-level resources will increase retention behaviors and academic success. And ultimately, these practices will increase the likelihood students will achieve their postsecondary goals consistent with career aspirations.
1NOTE: The Student Readiness Inventory (SRI) which was the instrument cited in much of the research in this chapter, is now known as ENGAGE.