THE INCOME TAX OVER TWO CENTURIES
The income tax is among the most important policy tools that modern governments use to raise revenue. The choice to have an income tax at all, and at what rates to tax different incomes, is also among the most important policy decisions affecting inequality. The income tax is often the policy instrument that dominates conflict about redistribution and the role of government more generally. Studying it is the natural place for us to begin the empirical investigation. In this chapter we ask when governments have used the income tax to tax the rich heavily. In so doing it will become apparent that this doesn’t happen just because universal suffrage has been achieved or because income inequality is high. Governments have primarily used the income tax for this purpose during and in the wake of mass mobilization for war. The interpretation of this war effect will then be considered in later chapters.
Prior to the nineteenth century, states had little experience with an income tax. Modern income taxes are marked by the assessment of individual or household income and comprehensive taxation of most, if not all, forms of income. For centuries, the assessment of income was considered either impractical or an unnecessary violation of individual privacy. When states wanted to tax income and wealth, they typically taxed property or the income that was assumed to have been produced by property. Some of these taxes had features that resonate with an income tax. The idea was to tax earnings, but there was usually no attempt to assess actual income, and the taxes were aimed at specific sources of income.
Edwin Seligman notes two important exceptions to this pattern: Renaissance Florence and eighteenth-century France. In each case, an attempt was made to assess and tax many forms of income. In both settings, norms about treating citizens as equals played a role in the adoption of the tax. It was evident in each polity that there were new sources of income and wealth that were not tied to land. Part of the motivation for an income tax was to ensure that these new sources of income and wealth were also taxed. In practice, the assessment and general application of these early income taxes proved difficult. It turned out that sources of revenue that were easier to assess were more likely to be taxed. This led both taxes to becoming more like property taxes than actual income taxes. These problems of assessment were magnified by widespread and arbitrary exemptions. Neither set of income taxes survived into the nineteenth century.1 Consequently, the story of the modern income tax is primarily one that begins with the adoption of an income tax in the United Kingdom in 1799. The remainder of this chapter will focus on determining from this date when states adopted income taxes and in particular income taxes with high top rates.
TOP MARGINAL RATES 1800–2013
To make this assessment systematically, we, along with Federica Genovese, constructed a new dataset that records yearly data on the top marginal income tax rate levied by the national government for an individual in twenty countries from 1800 (or independence) to 2013.2 The top marginal rate is the rate applying on the highest income category. A country is considered to have adopted a modern income tax system if an independent national government levies taxes annually on comprehensive and directly assessed forms of personal income.
We wish to provide a picture of the burden of income taxation on wealthy citizens across time and countries. The top statutory marginal rate is an indicator of this burden that can be collected for a large set of comparable countries over a very long time period. Moreover, these top statutory rates are often the focus of political debate. These data improve on many previous analyses by measuring not just when a country adopted an income tax, but also the rates of taxation on high incomes. It allows us to see how factors such as expansion of the franchise, democratization, the rise of labor and socialist parties, and war influenced the taxation of high incomes. This is not possible with datasets focused on only the last several decades.
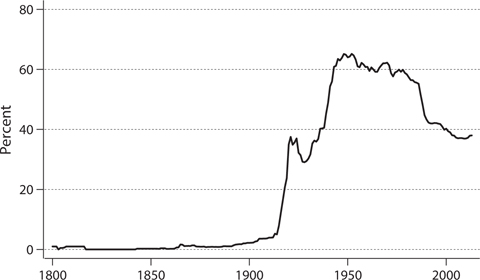
Figure 3.1 presents the average top marginal income tax rate for the twenty countries in the sample from 1800 to 2013. This view of the data reveals several interesting patterns. For one, there is tremendous variation across time. The average top income tax rate ranges from 0 in the two and a half decades after the end of the Napoleonic Wars to 65.2 percent in 1952. In addition, although the income tax had been implemented by the United Kingdom in 1799 and proven to be a good source of revenue, elsewhere the tax was either not adopted or adopted with very low rates throughout the nineteenth century. The highest rate adopted during the nineteenth century was 10 percent in the United Kingdom during the Napoleonic Wars, the United States during the Civil War, and Italy during the last five years of the century. Finally, the average top rate during the twentieth century exhibits an inverted u-shape, with rates increasing from single digits to more than 60 percent in mid-century, holding steady until the early 1970s, and then declining thereafter to 38 percent in 2013. It will be essential for us to explain both the rise and fall of top income tax rates over the course of the twentieth century.
From the late nineteenth century onward, the average top rates in Figure 3.1 mask significant differences between individual countries. Figure 3.2 presents the top marginal income tax rate for each country in the sample for selected years between 1900 and 2000. The first thing to notice is that although there is significant cross-country variation, most countries exhibit the inverted-u-shaped pattern of rising rates for most of the first half of the twentieth century, followed by declining rates after the middle of century. Switzerland is one departure from this pattern.3 A second important pattern in this figure is that not only do the rates change significantly over time, the ordering of the rates between countries changes as well. In 1900, only seven of the fifteen countries in the sample for that year had an income tax, and Italy led with a rate of 10 percent, with Austria, Japan, and New Zealand next with rates around 5 percent. By 1925, eighteen of the nineteen countries in the sample had a national income tax and the country leaders had completely changed identity, with France at 60 percent and Canada, Norway, and the United Kingdom at 50 percent.
Figure 3.1. Average Top Rates of Income Taxation, 1800–2013. This figure reports the average top marginal income tax rate for the twenty countries in our sample (each country entering the sample in 1800 or first year of independence).
What political and economic factors drove this variation?
Before addressing this question, we should ask whether our focus on national-level statutory rates paints an informative picture. Many countries in the sample adopted local income taxes levied by municipalities or other subnational governments. To address this issue, we also collected data on local income taxes for each country. These data can highlight any important differences that arise from also considering these taxes, but it turns out that there are relatively few.4
A second potential concern is that the top rate may measure income tax burdens on the wealthy, but it may not be a good indicator of overall progressivity. However, since countries often do not tax individuals with low incomes, the top marginal rate is a good linear approximation of progressivity. To check this claim more closely, we collected statutory rates across the income distribution for selected countries. Although there is interesting variation in rates by income, the top rate is a reliable indicator of the overall progressivity of the income tax.
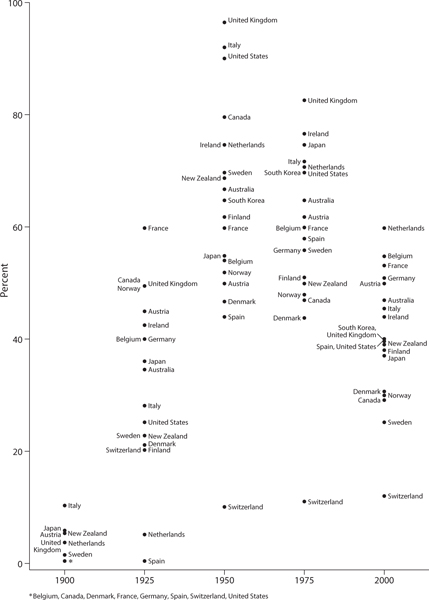
Figure 3.2. Top Rate of Income Taxation, Selected Years. This figure reports the top marginal income tax rate for the twenty countries in our sample (each country entering the sample in 1800 or first year of independence) for selected years. Germany is missing for 1950 because taxes were set separately in each occupation zone.
Figure 3.3 presents the full schedule of statutory income tax rates for France, Germany, New Zealand, Sweden, the United Kingdom, and the United States for selected years from 1875 to the present.5 We report not the raw schedules but the schedules in terms of multiples of gross domestic product per capita. This allows us to compare across time and across countries what the marginal tax rate would have been for individuals with incomes at various places in the income distribution. We use multiples of GDP per capita rather than percentiles in the income distribution because we do not have reliable information on income percentiles for all countries in all years. The multiples we select are based on the income thresholds in France reported in Piketty (2001).6
Figure 3.3 reports a rich array of information about the evolution of marginal rates across the income distribution over time. For purposes of validating our focus on top marginal rates, two patterns stand out. First, statutory rates are non-decreasing with income in all country years except New Zealand in 1925.7 Keeping this minor exception in mind, figure 3.3 clearly indicates that countries enact higher statutory rates on higher incomes. Second, one simple measure of the progressivity of these tax systems is the difference between the top marginal rates—in figure 3.3, these are the rates on incomes for the 100 times GDP per capita multiple—and the marginal rates for low-income individuals—in figure 3.3, the rates on incomes for the 0.5 times GDP per capita multiple. Top marginal rates are highly correlated with this difference. The overall correlation across all country-years in the figure is 0.93. Four of the six cases have individual country correlations over 0.9. This suggests that top rates can be studied not only as an indicator of income taxation on the wealthy, but also as an intuitive, simple measure of the overall progressivity of the income tax system.8
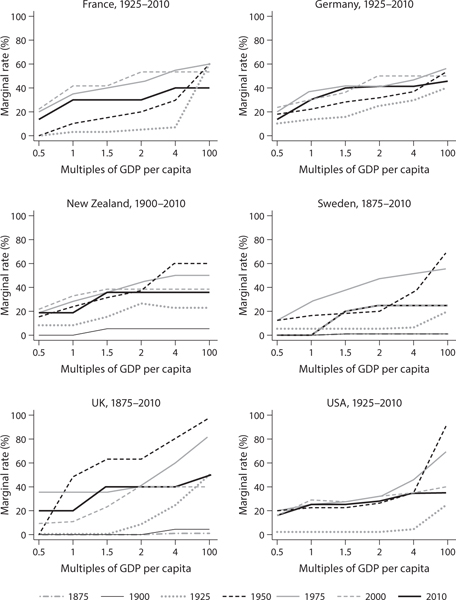
Figure 3.3. Full Schedules of Statutory Income Tax Rates. This figure reports the full income tax schedules for six countries for the years 1875, 1900, 1925, 1950, 1975, 2000, and 2010 if a modern income tax had been adopted. See text and endnotes for sources and methodology.
A third potential weakness of using top statutory rates is that modern tax codes are multidimensional. They contain a myriad of tax deductions that influence the effective tax rate paid by citizens. Some countries tax income from capital gains at lower rates than other sources of income. Other countries link wealth taxes with the income tax by limiting the total percentage of income from the combination of these taxes. This effectively lowers the top marginal rate of income taxation. Wealthy citizens are often the biggest beneficiaries of these policies. Certain types of tax compliance can also influence the effective rate. The potential difference between effective and statutory marginal rates varies across the income distribution and can be substantively quite important. Fortunately, for selected countries, we are able to evaluate the correlation between the statutory top marginal rate and effective rates paid by high earners over very long time periods.
Figure 3.4 presents the statutory top marginal income tax rate and the effective income tax rate on incomes in the top 0.01 percent of the income distribution for Canada, France, Sweden, and the United States and the top 0.05 percent for the Netherlands and the United Kingdom for most of the twentieth century. The bulk of the data on effective rates derives from authors who have produced papers for the top incomes project.9 The six panels in figure 3.4 provide several important lessons. Consider first the panel for the Netherlands. The solid line plots the top statutory rate and the dashed line indicates the average effective rate for individuals in the top 0.05 percent of income earners. The first thing to notice about the plot is that the two series move closely together over time with a correlation of 0.91. This indicates that the top statutory rate is an extremely good proxy for the effective income taxes paid by very high earners in the Netherlands if the primary goal is to understand how these taxes varied over time. Another important insight from figure 3.4 is that there is a clear wedge between statutory and effective rates, and the magnitude of this wedge varies over time. For example, it was relatively small in the 1940s but expanded in the 1950s and '60s. Further, the effective rate is below the statutory rate, indicating that other aspects of the tax code work to reduce the taxes citizens pay. The statutory rates also change less frequently than the effective rates. These patterns show that legislation and behavior combine to produce changes in the effective rate even without a change in the statutory rate.
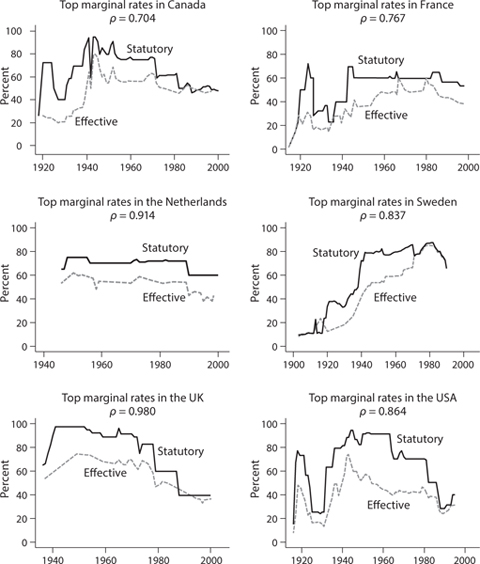
Figure 3.4. Statutory and Effective Income Tax Rates. This figure reports the statutory top marginal income tax rate and the effective income tax rate on incomes in the top 0.01 percent (0.05 percent for the Netherlands and UK). ρ is the correlation coefficient for the two series by country. See text and endnotes for sources and methodology.
An obvious question to ask is whether the statutory top rate is a good proxy for the effective taxes paid for individuals further down in the income distribution. The answer to this is almost surely no if one considers much smaller incomes. The effective tax rate on the poor and middle class departs substantially from top rates of income taxation. Not only is there a large wedge between the rates, but also they do not necessarily move together over time. Political and economic forces that push states to adopt lower top rates may very well push rates on lower incomes higher to generate a flatter overall tax schedule. That said, in some countries, like the Netherlands, the top statutory rate is correlated with effective rates on income in the top 10 percent of the income distribution despite the fact that the wedge between the statutory and effective rate is larger than for incomes in the top 0.05 percent.
Overall, the data presented in figure 3.4 suggest that the top statutory rates are highly correlated with effective rates on very high earners in the top 0.01 (or 0.05) percent of the income distribution. Since the objective of this book is to identify the factors that have driven the taxation of the rich over the last two centuries, this evidence provides considerable confidence in our use of statutory rates in a great deal, though certainly not all, of the analysis. That said, the figure also clearly highlights that the top rate is a better proxy in some countries, for example the UK, than others, say Canada. The same caution should be made with respect to different time periods. In the United States a very substantial gap between the top rate and the effective rate opened up after 1945 and did not close until 1980. Projecting ahead, this characteristic of U.S. rates means that there is clear evidence that both the statutory top marginal rate and the average effective rate for the top 0.01 percent increased significantly during World War II, but the statutory rate remained very high for much longer.
Because effective rates in five of the six countries tracked statutory rates closely, we feel confident in using statutory rates for the analysis in this chapter. However, the results for the United States do imply that we need to be very careful before assuming that a top statutory rate exceeding 90 percent, as was true for much of the postwar period, meant that the rich were being taxed extremely heavily. Thomas Piketty and Emmanuel Saez have considered this question in detail in an analysis beginning in 1960. They have suggested that by 1960 a very substantial gap had emerged between the top marginal rate of income taxation and the effective rate for the top 0.01 percent in the United States. This is consistent with our own findings, and they attribute this result primarily to the classification of much income for this group as capital gains.10 However, they also suggest that when one considers the additional burden on the top 0.01 percent posed by corporate taxation and estate taxation, then the rich in the United States during this era were in fact very heavily taxed. They also conclude that by the end of the twentieth century the top 0.01 percent in the United States were taxed much less heavily than had been the case in 1960.
CHANGES IN TOP RATES: A ROLE FOR DEMOCRACY?
The dominant narrative of the politics of redistribution in political science and economics highlights the role of electoral democracy and political parties that mobilize working-class groups. As we discussed in chapter 1, this story can be applied to income tax policies in a straightforward way. When voting is limited or a country is nondemocratic, the poor and middle class lack influence, and the wealthy generally choose tax policies that favor their interests. This should imply no income taxes or income taxes with low rates. Governments under these conditions would instead depend more on indirect taxes, such as trade and excise taxes. When countries expand the franchise or democratize, it is the middle class and poor citizens who become voters, and they are more likely to support the adoption of income taxes and especially income taxes with higher rates on the rich. One version of this story emphasizes how the rise of electoral democracy influences the policies chosen by all political parties. With an expanded suffrage, parties of the right would face an incentive to shift left in order to remain electable. Other versions suggest a partisan account in which policy change takes place only once labor and socialist political parties gain power.
The logic of the preceding argument is clear. Voters have every reason to adopt public policies consistent with their economic interests. Poor and middle-class voters should plausibly have a greater interest in high income taxes on the wealthy. Carrying this logic to its extreme, however, quickly leads to an obvious empirical problem. In democracies around the world, the poor generally do not expropriate the rich. In the context of income tax policies, the data in figures 3.1 and 3.2 show that democracies do not often choose to tax high incomes at very high rates. By 1900, a number of countries in the sample had been democracies for many years and had near universal suffrage, but none of them had adopted income tax rates above 10 percent. By the end of the twentieth century, national top marginal rates ranged between 11.5 percent and 60 percent with an average of 40 percent. These rates, while clearly higher than at the beginning of the century, are well short of those adopted in the middle of the twentieth century. They are also well short of what would be expected if the poor and middle-class majority were voting to expropriate the rich.
Even if the more extreme predictions of the democracy hypothesis have not been borne out, democratization and the expansion of the franchise may still have had an effect on the income tax. There are a number of ways to look at the data to try to learn the impact of democracy on the top rate of income taxation. A natural place to start is to compare average top rates among countries with and without universal male suffrage in selected years. Focusing on suffrage as the measure of democracy makes sense. It captures the feature of democracy of most direct interest—the eligibility of poor voters to participate in elections.11 In 1900, countries with universal male suffrage had an average top income tax rate of 1.4 percent (seven countries) while those countries without universal male suffrage had an average rate of 2.9 percent (eight countries). This difference is small in magnitude and in the opposite direction of that predicted by the democracy hypothesis. By 1925, nearly all the independent countries in the sample had adopted universal male suffrage, and so cross-country comparisons for later periods do not shed light on this hypothesized relationship. That said, it should come as no surprise that if one pools all the data in the sample, the average top income rate in country-years without universal male suffrage is substantially lower than in country-years with universal male suffrage (4.5 percent versus 40.7 percent).
This sort of cross-country evidence is generally not compelling in determining whether and to what extent democracy leads to heavy taxation of the rich. For cross-country comparisons within a given year, it is not clear whether the lack of evidence for the democracy hypothesis is because the hypothesis is wrong or because there were other factors that influenced income tax policies. There are many reasons why Italy might have higher income taxes than Canada. Moreover, democracy itself may be determined by other factors that also influence tax policies. In other words, correlation may not imply causation. Combining all the data across all years does not help much either. We would still be using these cross-country comparisons as well as introducing new sources of potential bias from common secular trends. By this we mean that all countries in 1950, for example, might have been different than all countries in 1900 for reasons specific to these two time periods and not specific to the presence or absence of democracy.
An alternative way to use the data is to look at the relationship over time within each country. For example, are the top rates of income taxation higher or lower in the ten years before and after a country reaches full universal male suffrage or before and after democratization? What is this difference, on average, for all the countries in the sample? This approach allows us to “control” for all the factors that do not change over time that make a country like Italy different from a country like Canada.12
Figure 3.5 plots the top marginal income tax rate for the fifteen countries in the sample that transitioned from less than universal male suffrage to universal male suffrage in the ten years before and after the transition. The light gray lines plot the top marginal tax rate for each country and the thick black line plots the average. Australia, Germany, Ireland, Norway, and South Korea are excluded from this analysis because universal male suffrage already existed at independence or very soon thereafter. The black line plotting the average tells a mixed story for the democracy hypothesis. Universal suffrage does not appear to lead to a significant increase in the top marginal rate. The average is just below 20 percent prior to the first year of universal male suffrage and remains at approximately 20 percent for the ten years after this transition. Given that there are only fifteen countries in this analysis, it is worth considering whether these averages are being driven by extreme cases. However, if we consider the median top marginal rate, the picture looks very similar.
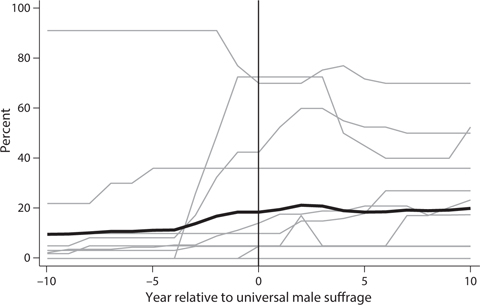
Figure 3.5. Universal Male Suffrage and Top Rates of Income Taxation. This figure reports the top marginal income tax rate for the fifteen countries in our sample that transitioned from less than universal male suffrage to universal male suffrage. The light grey lines plot the top marginal tax rate for each country and the thick black line plots the average. Australia, Germany, Ireland, Norway, and South Korea are excluded because universal male suffrage already existed at independence or very soon thereafter.
The light gray lines do raise questions about potentially important cases. The top light gray line is for the United States, which in practice did not have universal male suffrage until 1965.13 The United States displays a pattern of decreasing rather than increasing rates around this date. There are also two light gray lines that appear to increase substantially in the years near the transition to universal male suffrage. Canada is one of these cases. The increase, however, is prior to the adoption of universal male suffrage. The top rate increases from 0 in year −4 to 25.9 in year −3 followed by increases to 48.9 in year −2 and 72.5 in year −1. As we discuss, these policy changes were made during Canada’s mobilization for World War I. There was no additional increase in 1921 after universal male suffrage was adopted. The second case is the United Kingdom, and it seems consistent with the democracy hypothesis. Higher top marginal rates were adopted in 1919 and 1920 following the transition to universal male suffrage in 1918. This case highlights some of the limitations of single-country before and after comparisons. Top marginal rates were already beginning to increase in the United Kingdom before universal male suffrage was adopted. They rose from 8.3 percent in 1914, four years before universal male suffrage, to 42.5 percent in 1917, one year prior to the transition. Moreover, the before and after comparison suffers from the fact that it is implausible to assume that had universal male suffrage not been adopted, rates would have remained the same.14 As we discuss in depth later in this chapter, the top rates of income tax in both these countries cannot be understood without considering the impact of mobilization for World War I.15
One potential objection to the evidence is that if countries are slowly expanding the suffrage over time, then the final achievement of full universal male suffrage may not impact tax policy. We considered this possibility by measuring partial expansions of the franchise, specifically estimating the years at which 25, 50, and 75 percent of men were eligible to vote. We failed to find evidence that these partial expansions of the franchise had an effect on the top rates of income taxation that countries adopted.16 The United Kingdom provides a useful illustration of this result. It slowly expanded the franchise over the course of the nineteenth and early twentieth centuries.
Figure 3.6 plots the top marginal rate of income taxation for the United Kingdom between 1800 and 1925 along with key reforms that expanded voting rights. Generally, this graph shows mixed evidence at best for the argument that expansion of the franchise had an impact on income tax rates. The Reform Act of 1832 reduced and standardized income and property qualifications, leading to a small but important expansion of the franchise. The Reform Act of 1867 further reduced these requirements for England and Scotland. The Third Reform Act in 1884 introduced uniform franchise requirements in all of the United Kingdom and again reduced the income and property restrictions. At this point a majority of adult males, including the urban working class, were eligible to vote.
Income taxes in the UK were eliminated after the Napoleonic Wars. In 1842, Robert Peel’s Conservative government introduced a new income tax law with a top rate of 2.9 percent. For the remainder of the nineteenth century, the income tax remained between 0.8 percent and 5 percent. The most important legislative change before World War I was the adoption of a “Super Tax.” This was a graduated system with higher-income groups bearing a heavier burden than other taxpayers as part of the “People’s Budget” in 1909/10. The super tax set a higher rate of 8.3 percent on high earners. In sum, the franchise expanded steadily over time reaching very high rates of eligibility, but there were only modest increases in the top rates of income taxation.
Even if rates moved little, it is still likely that granting voting rights to middle- and working-class citizens influenced the tax choices of UK governments. For example, Peel’s 1842 budget reinstating the income tax also reduced a substantial number of customs duties. This made the overall tax system more progressive. This may have been part of an effort to court the growing number of middle-class voters following the Reform Act of 1832.17 Peel’s reinstatement of the income tax was also an example of compensatory fairness arguments at work. A salient argument in these debates was that trade and excise taxes had become too burdensome on the poor and that the income tax could compensate for these other taxes. In a similar fashion, the name of the 1909 “People’s Budget” indicates that it was an effort to improve the Liberal government’s standing with working-class voters and to respond to the electoral threat from the Labour Party. That said, the franchise was constantly expanding during the nineteenth century, but the top marginal rate of income tax hardly changed. This prior expansion of the franchise further undermines any association between the adoption of universal male suffrage in 1918 and the higher rates of income taxation thereafter. Universal male suffrage increased the fraction of males that had the vote, but the suffrage had already been significantly widened by prior reform acts.18 If the extension of the franchise was driving the setting of income tax rates in the UK, we should have observed increases during many, if not all, of the significant expansions highlighted in figure 3.6, but we do not.
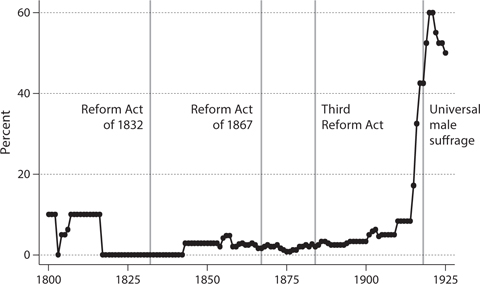
Figure 3.6. Suffrage Expansion and the UK Income Tax. This figure plots the top marginal income tax rate for the United Kingdom from 1800 to 1925 along with key reforms that expanded voting rights.
While suffrage is central to arguments about democracy and income taxation, other features of democratic government could also be influential. One possibility is that competitive elections, with or without a full expansion of the franchise, will lead to greater taxation of high incomes. We also evaluated the democracy hypothesis using a measure of competitive elections. We coded a country as having competitive elections if the legislature is elected in free multiparty elections, if the executive is directly or indirectly elected in popular elections and is responsible either directly to voters or to a legislature elected according to the first condition, and finally if at least 50 percent of adult males have the right to vote.19 All the patterns, or lack thereof, that we have discussed for universal suffrage also hold when using this competitive elections measure.20
A closely related argument to the democracy hypothesis is that the impact of the inclusion of poor and middle-class voters is only fully realized when political parties of the left actually lead governments. This partisan hypothesis predicts that left governments will lead to higher income taxes on the wealthy. But this argument is somewhat incomplete. Knowing that labor and socialist party governments tend to tax high incomes at higher rates does not really explain the underlying reasons why such governments are elected at some times and not others. Parties of the left have often pushed for higher top tax rates. It would not be surprising if they tended to implement them more frequently than do governments of the right. That said, it is still useful for us to know if left parties are associated with higher rates in practice. Given that these parties had no chance at leading governments before the franchise was expanded, observing a correlation between left parties and income tax policies would provide some evidence that political inclusion and democratic institutions do contribute to taxing the rich.
We can also use the data to learn about the relationship between partisanship and the top rate of income taxation. The cross-country evidence is rather mixed. In 1925, there were only two countries with left governments, and they had an average top rate of 21.8 percent, compared to an average top rate of 33.4 percent among the seventeen countries in the sample for that year that did not have left governments. If we move to 1950, there were more left governments, and rates were higher, but there was not a substantial difference between countries with left governments (68.3 percent) and without (66.5 percent). Nor is there evidence of higher rates in countries with left governments in 1975 or 2000.21
This cross-country evidence is again not particularly convincing in deciding whether governments of the left enact higher tax rates on top incomes. In any given year, there are many characteristics of these countries that might lead them to enact different tax policies. This could account for why there is little evidence for the partisan hypothesis in these comparisons even if such a relationship was prevalent. A more compelling use of the data is to once again look at what happens within a country before and after left parties take control of government.
Figure 3.7 reports the top marginal income tax rate for each time that a country transitioned from a non-left to a left party in control of the government.22 We plot the rate up to five years before to five years after the transition with the exact duration depending on the term of the non-left and left governments before and after the transition. We include only transitions for which the period of non-left government before the transition is at least three years and the period of left government is at least three years. The light gray lines plot the top marginal tax rate for each transition. The thick black line plots the average. The figure suggests that on average, left governments have been associated with a higher top rate of income taxation, but this increase takes a couple of years to occur and is small in magnitude. The average top rate in the five years preceding transitions to left governments is 48 percent and constant across all five years (years −5 to −1 in the figure). The average in the year of transition (year 0) is also 48 percent, but then the average top rate rises to 49 percent in year +1, 51 percent in year +2, 54 percent in year +3, and 55 percent in year +4 before dropping back to 52 percent. The median top rates in the years preceding transitions are 50 percent and then rise to 51 percent in year +2, 52 percent in year +3, and 53 percent in year +4 before returning to 50 percent in year +5. This suggests that left partisan governments were associated with a small increase in the top marginal tax rate, which is broadly consistent with the partisan hypothesis.
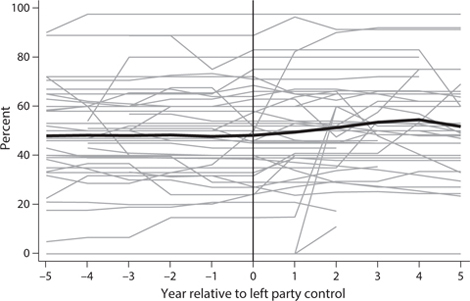
Figure 3.7. Left Partisanship and Top Rates of Income Taxation. This figure reports the top marginal income tax rate for each time that a country transitioned from a non-left to a left party in control of the government. We plot the rate up to five years before to five years after the transition with the exact duration depending on the term of the non-left and left governments before and after the transition. We include only transitions for which the period of non-left government before the transition is at least three years, and the period of left government is at least three years. The light grey lines plot the top marginal tax rate for each transition and the thick black line plots the average.
This partisanship result comes with several caveats. It should be remembered that this is an average pattern in the data. Inspection of each individual case reveals substantial heterogeneity. For some countries, there are clearly important partisan patterns. In the United Kingdom, left governments raised top rates in the 1930s and right governments significantly lowered top rates in 1979 and 1988. However, there are also important cases like Sweden that pose difficult questions for the partisanship hypothesis. The left was in power in Sweden for decades starting in 1932, and the top rate of income taxation rose from 24 percent to a high of 70 percent at mid-century. But the left was also in power as the top marginal rate was cut to 25 percent during the second half of the twentieth century. There are also many transitions for which there seem to be no changes in the top rate at all. Another problem, discussed earlier, is that the time series evidence requires us to believe that had a country not transitioned to a left party government, tax policy would not have changed and that left party governments came to power for reasons unrelated to other factors influencing the top rate of income taxation.23 Finally, left partisanship raises the more general possibility that countries implemented higher income taxes when they feared the rise of Communist parties either through election or revolution. While in individual cases there may be something to this argument, like democracy, the threat of communism often preceded substantial increases in income tax rates by many years. Further, if one takes the view that the threat was commonly shared by most of the countries in our sample, it cannot explain the substantial variation in rates that we observe across countries within time periods.
INEQUALITY AND TOP MARGINAL INCOME TAX RATES
Inequality is another potential driver of income tax policy. As we discussed in chapter 1, this argument comes in several variants. Citizens may find it in their self-interest to tax the rich more heavily as inequality grows. Citizens may also feel that rising inequality is a sign of unequal opportunity, and therefore it is fair that the rich should be taxed. Finally, citizens may want heavy taxes on the rich when inequality is high because they fear for the democratic political order.
Evaluating the preceding arguments is difficult because we need to keep in mind that top rates of income taxation may influence the distribution of income, but inequality may also influence tax rates. In what follows we first consider static correlations; that is what the relationship is between today’s level of inequality and today’s top tax rate. We then consider a dynamic relationship, asking whether recent inequality affects subsequent tax choices and whether recent tax choices determine today’s level of inequality. Examining how past values of one variable influence future values of another (and vice versa) helps move us one step toward saying which way the arrow of causality runs.
We measure inequality using the share of pre-tax income earned by individuals at various percentiles of the income distribution. Though the most obvious effect of top income tax rates on inequality would be via the difference between pre-tax and post-tax income, there are also reasons to believe that high top income tax rates can lower pre-tax inequality.24 The top incomes shares data, based on income tax returns, is from The World Top Incomes Database and is the work of a wide number of scholars led by Tony Atkinson, Thomas Piketty, and Emmanuel Saez.25
We start by considering correlations between inequality and top rates across the twenty countries at different moments in time. In 1925, one of the first years for which at least a handful of countries have top income share data, the correlation between the top 0.01 percent share and the top rate was 0.22. By 1950, this correlation strengthened considerably to 0.65. Higher top rates prevailed in high-inequality countries. This relationship completely reversed itself later in the twentieth century. In 1975, the correlation for the top 0.01 percent share was −0.05 with a similar pattern holding in 2000. We also examined the cross-country correlations between the top 1 percent share and the top rate and found a similar pattern.26 In short, there has been no stable static correlation between top shares of income and top rates of income taxation over the course of the twentieth century.
Our next step was to consider the static relationship between inequality and top rates in individual countries over time. Figure 3.8 reports the income share going to the top 0.01 percent of the income distribution and the top marginal income tax rate for Canada, France, the Netherlands, Sweden, the United Kingdom, and the United States for the years that we have comparable income share data. We selected these cases to match the data that we show in figure 3.4 for the relationship between statutory and effective rates, but the patterns are similar for the other countries for which we have data. The over-time correlation between the top 0.01 percent share and top marginal income tax rates is consistently negative. Figure 3.8 reports correlations between −0.13 for Canada and −0.90 for the United Kingdom. We also examined these same trends and correlations for the top 1 percent, and although the magnitude of the negative correlations was smaller, they were still negative for all but one country.
Our final step was to consider the dynamic relationship between inequality and top marginal rates of income taxation. To do this we performed what is known as a “Granger causality” test. The name of this test is misleading because in the test a “causal” relationship is one where past values of one variable influence current values of another. However, it may still be possible that some third factor determines both the variables being tested. To at least partially control for this latter possibility our test included controls for fixed characteristics of countries in addition to factors common to all countries in a time period.27 In performing the Granger test we ask first whether past top tax rates are negatively correlated with today’s level of inequality. This makes sense because behavioral responses to tax rate changes may take some time. We asked, second, whether past levels of income inequality influence current tax rates. This too makes sense because levels of income inequality are only learned with some delay. When we pooled data for the twenty countries and performed these tests we found only very weak evidence that past levels of income inequality determine current tax rates. This was true irrespective of whether we used the top 1 percent or top 0.01 percent measures of income inequality. In contrast, we did find that current top tax rates influence future levels of inequality.28
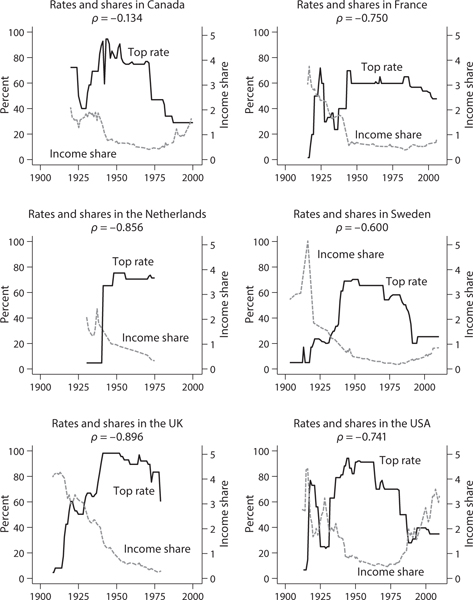
Figure 3.8. Inequality and Top Rates of Income Taxation. This figure reports income share going to the top 0.01 percent of the income distribution and the top marginal income tax rate for Canada, France, the Netherlands, Sweden, the United Kingdom, and the United States for the years that we have comparable income share data.ρ is the correlation coefficient for the two series by country.
Overall, there is very little evidence in the data consistent with the claim that increasing inequality leads countries to adopt higher taxes on top earners.29 What we do see are clear indications that high top rates reduce income inequality. This fits with other recent research on this question.30 This second finding also helps to suggest that the data are not so noisy that it is impossible to find any relationship at all. Given the difficulty of disentangling the effect of inequality on income tax rates and vice versa, we should treat this conclusion with caution. We will revisit it in the next chapter on the inheritance tax. There we find a similar pattern.
WAR MOBILIZATION AND TOP INCOME TAX RATES
Countries have gone the farthest in taxing the rich when there have been compensatory arguments for doing so. The most important context for this has been mass mobilization for war. We will now begin to evaluate this argument empirically by focusing on war mobilization and income taxation during the twentieth century. Our objective in this section is to establish that major increases in the taxation of high incomes coincided with mass mobilization for war. A full assessment of why war had this effect is left for later chapters.
Our discussion focuses on the period prior to and around the time of World War I. This conflict was the first war in which a significant proportion of the countries in the sample mobilized large armies that constituted a substantial share of their populations.31 It is critical to note that the war effect that we hypothesize requires mass mobilization. Strategically important and expensive wars, such as recent U.S. conflicts in Afghanistan and Iraq, and many conflicts in the seventeenth and eighteenth centuries, are not expected to have the same impact on tax politics. World War I is also a natural place to begin because the descriptive statistics in figures 3.1 and 3.2 show that the first big increase in top income tax rates took place around this time.
To evaluate the impact of the war, we first need to set the context for income tax policy on the eve of the war. As we have already noted, the United Kingdom reestablished the income tax in 1842, but rates were kept extremely low by modern standards. Even with the introduction of the “super tax” in 1909, the top marginal rate in the UK was just 8.33 percent. During the nineteenth century, the possibility of establishing an income tax also became a subject of debate in numerous other European countries, in no small part because of the perceived success of the British innovation. During periods of significant unrest some individuals even proposed graduated tax systems with top rates that resembled modern rates.32 By all accounts, however, the idea that up to half of an individual’s income might be drawn away in taxes was seen by most observers at the time as what the Economist called a “preposterous system of finance.”33 In the decades leading up to World War I, a number of states joined the UK by creating an income tax, including Sweden in 1862 (with a more fully modern law in 1903), Italy in 1865, Japan in 1887, New Zealand in 1892, the Netherlands in 1893, Austria in 1897, and Denmark in 1903. The United States first adopted a federal income tax in 1862 in connection with the Civil War, but after 1872 Congress did not renew the tax. A federal income tax was not reinstated until 1913, though Congress passed income tax legislation in the 1890s that was struck down by the U.S. Supreme Court.
These developments seem to indicate that there was a general trend toward the adoption of an income tax. It was also the case that a graduated income tax became the norm. These developments were significant and may have been a consequence of an expanding franchise and of labor and socialist parties influencing political competition.34 However, what is most striking is that even after the adoption of graduated income taxes, top earners prior to World War I paid only a small portion of their income in the form of tax. These low rates are consistent with the evidence that we have presented so far. Democracy, partisanship, and inequality generated a lively debate about taxing the rich, but this had relatively small effects on policy. One might wonder whether the failure to adopt higher rates of income taxation was attributable to limits on state administrative capacity. However, we show in chapter 4 that the same pattern of low rates also prevailed for inheritance taxes, and at the time these required far less administrative capacity to collect. The lesson then is that in the early months of 1914, it may have appeared that the income tax was the wave of the future, but it would have been considered unlikely that within a matter of a few years, some countries would adopt taxes that saw the richest members of society pay as much as half of their income in taxes.
World War I placed substantial financial demands on the countries participating in the conflict. Governments needed to respond to this demand by some combination of an immediate tax increase and increased issuance of debt, which implied future tax commitments. What was new about this conflict was that heavy burdens were placed on top-income groups. Debates about top marginal tax rates also took on a new political salience. Either during or soon after the end of the war, participant countries adopted steeply graduated rate schedules with top rates that the Economist had previously deemed “preposterous.” In the UK a series of war budgets saw the top rate of income tax increase from 8.33 percent in 1914 to 60 percent by 1920. Observers at the time also suggested that in a country such as the UK, the changes in the tax system had an important effect on the distribution of both income and wealth.35 In the United States the top marginal rate of income tax rose from 7 percent at the outset of the war to 77 percent by the end.36 A similar pattern of events took place in Canada, which first established a federal income tax in 1917 with a top rate of 25.9 percent and which subsequently raised this rate to 72.5 percent by 1920.37 In France, a national income tax was first implemented in 1915 with a top statutory rate of 2 percent. By 1920 the top rate had risen to 50 percent. Germany’s policy choices differed from these cases in that it did not adopt a national income tax during the war. Also, the rates of income taxes at the local level, at least for Prussia (for which we have data), did not increase. That said, this departure was a temporary one. After the war, Germany created a federal income tax with a high top marginal rate of 60 percent in part to help pay for the war and war reparations. Moreover, as we discuss in greater detail in subsequent chapters, Germany, like other participants, adopted war profits taxes.
The top income tax rates that we refer to certainly applied to a small percentage of households, and more generally only a small fraction of households in these countries were liable for any income tax at this time. In the case of the UK the super tax was initially paid by something on the order of 0.1 percent of households.38 In other countries, such as France and Canada, the fraction of households liable at the top rate of income tax was even smaller, on the order of 1,000 households and 500 households, respectively.39 While the revenues generated by this top rate were certainly too small to solve France’s postwar fiscal problems, the move to a high top marginal tax rate obviously had major implications for the large fortunes to which it applied.
One important aspect of the World War I period is that at the same time that we observe the evolution of tax systems in countries that mobilized heavily for the war, we can also observe what happened in those countries that remained neutral. The Swedish and Dutch cases are particularly interesting for our purposes, because Sweden and the Netherlands were subject to many of the same political developments that occurred in war participants such as France and the UK. In both Sweden and the Netherlands universal male suffrage was adopted around this time.40 In addition, in both of these countries parties of the political left first gained a significant share of parliamentary seats at this time, and both countries experienced episodes of working-class unrest and a fear of Bolshevism similar to those in war mobilization countries.41 However, despite these shared political conditions, outcomes with regard to top tax rates were very different from what happened with war mobilization countries. Dutch national top income rates remained in the single digits and although Swedish national rates increased, they remained around 20 percent until the 1930s.42
Figure 3.9 presents the available information on top tax rates between 1900 and 1930 for the ten sample countries that were heavily mobilized and participated in World War I and in the seven sample countries that were either neutral or that did not mobilize heavily. To code a country as mass mobilized for the war, it had to be a participant and had to mobilize at least 2 percent of the total population in the military. Japan was the only participant in the sample that did not reach this threshold at some point in the war. Finland, Ireland, and South Korea are excluded because they were not independent during most of the time period. It is apparent in figure 3.9 that in mobilized countries the war was accompanied by a huge shift toward taxing the rich. While there was also an increase in top rates in non-mobilization countries, it was much smaller. For purposes of estimating the effect of the war, it is useful to think about the nonmobilization countries as a counterfactual. Absent the war, we would expect the differences between the mobilization and nonmobilization countries to have remained approximately the same. Since prior to World War I the mobilization cases had slightly lower top rates, we would expect this difference to continue even if other factors led rates to increase in all countries. The fact that this difference was relatively constant in the years leading up to the war strengthens the plausibility of this assumption. The “difference in differences” before and after the war between the mobilization countries and nonmobilization countries is our best estimate of the effect of the war on top income tax rates. Figure 3.9 shows that in 1920 this difference was about 34 percentage points. The magnitude of the difference attenuated over time but remained large many years after the end of the war.
A potential concern about this approach to determining the impact of World War I is that countries may have selected into the war based on their ability to raise income taxes once the war had begun. A few considerations suggest this was unlikely. First, a large literature on entry into World War I suggests that few initial participants expected the long costly war that ensued. They instead anticipated a short and decisive conflict. Second, with the partial exception of the United States, the war mobilization countries in the sample did not select into the war at all. It was forced upon them. The event that precipitated the war was of course a political assassination. The participation of France, the UK, and Canada was not certain until Germany decided to follow the Schlieffen Plan for a general European war that started with a Western offensive.43
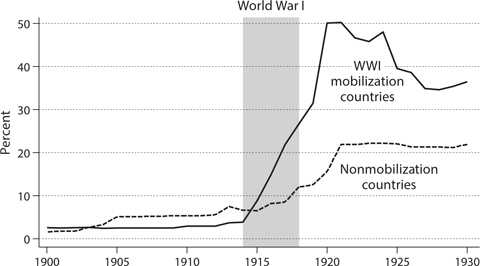
Figure 3.9. World War I and Top Rates of Income Taxation. This figure reports the average top marginal income tax rate for the ten WWI mobilization countries and the seven nonmobilization countries in our sample. Finland, Ireland, and South Korea are excluded because they were not independent during most of the time period.
The evidence in figure 3.9 supports our argument that states began to tax high incomes heavily when they mobilized for World War I. The question of why the war had this effect will preoccupy much of our discussion in the remainder of the book. While most of the analysis on this question will appear in subsequent chapters, here we want to consider two important questions for interpreting the impact of the war: Did income tax rates become more progressive, or did they simply increase across the board? Was the impact of World War I on top rates the same across all countries or did it vary by political regime?
To address the first question we examined changes in progressivity within the top 10 percent of income earners for a subset of four mobilization and four nonmobilization countries in the sample.44 Table 3.1 reports the changes in mobilization and nonmobilization countries in average marginal income tax rates for individuals at the 90th, 99th, and 99.9th percentiles and in top rates before and after World War I.45 The table shows that the war was associated with increased taxes in mobilization countries compared to non-mobilization countries at all of these high income levels but that these differences increased as incomes increased. For example, marginal taxes at the 90th percentile increase by 3.8 percentage points more in mobilization than nonmobilization countries compared to a difference of 20.6 percentage points at the 99.9th percentile (51.8 percentage points for top rates). The tax rates reported here show that the increases in income tax rates adopted as a result of World War I involved the rich being asked to pay a much larger fraction of their incomes than was the case with individuals who merely had incomes within the top decile. This increase in progressivity is anticipated by our argument about the effect of war mobilization on beliefs about tax fairness but not with a pure revenue maximizing account.
Table 3.1. World War I and Progressive Income Taxation |
|||
Prewar |
Postwar |
Difference |
|
90th percentile |
|||
Mobilization countries |
0.0 |
4.3 |
4.3 |
Nonmobilization countries |
2.8 |
3.3 |
0.5 |
Difference-in-differences |
3.8 |
||
99th Percentile |
|||
Mobilization countries |
1.4 |
12.1 |
10.7 |
Nonmobilization countries |
3.7 |
5.0 |
1.3 |
Difference-in-differences |
9.4 |
||
99.9th Percentile |
|||
Mobilization countries |
2.6 |
25.0 |
22.4 |
Nonmobilization countries |
5.7 |
7.6 |
1.9 |
Difference-in-differences |
20.6 |
||
Top rate |
|||
Mobilization countries |
4.3 |
63.0 |
58.7 |
Nonmobilization countries |
9.7 |
16.5 |
6.8 |
Difference-in-differences |
51.8 |
||
Note: The table reports pre (1913) and postwar (1920) average marginal income tax rates for the 90th, 99th, and 99.9th percentiles in mobilization and nonmobilization countries. See Scheve and Stasavage (2010) for sources. |
|||
To address the second question, we compare the average top marginal income tax rate in democracies that mobilized for World War I with non-democracies that also mobilized. The seven countries in the first category are Australia, Belgium, Canada, France, New Zealand, the United Kingdom, and the United States, and the three countries in the second category are Austria, Germany, and Italy. Figure 3.10 reports these averages on an annual basis from 1913 to 1919. Here we look at a small window immediately before, during, and after war because both Germany and Austria democratized after the war. In both sets of countries, top rates of income taxation increased on average during the conflict. However, the rates rose much more dramatically in the democratic war mobilization countries than in the nondemocratic ones. In the democracies, the average top rate was 3 percent in 1913 and grew to about 39 percent by 1919 (and would continue to increase after the war) while in the nondemocratic countries, the average rate grew from about 5 percent to 14 percent over the same period. Importantly, after democratizing, both Austria and Germany subsequently adopted high top rates that looked very much like those in the democratic mobilizing countries.
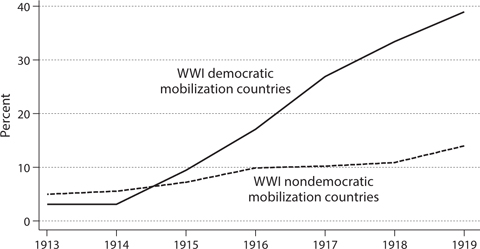
Figure 3.10. World War I and Top Rates by Political Regime Type. This figure reports the average top marginal income tax rate for the seven WWI mobilization countries that were democracies and the three WWI mobilization countries that were not democracies in our sample.
What should we conclude from this difference between democratic and nondemocratic countries? Leaders in both types of countries have an incentive to maintain public support for their governments and commitment to the war effort. One way to do this is to adopt compensatory tax policies that enhance a sense of equal sacrifice in the war effort. That said, the incentives to do this are clearly stronger in democracies where treatment of citizens as equals is part of the bedrock of the political system. The pattern of data in figure 3.10 is therefore consistent with our proposed mechanism for the war effect.46
Did mass mobilization for World War II also lead to higher top income tax rates? The simple answer to this question is yes. In 1938, the average top income tax rate among the eleven countries in the sample that mass mobilized for World War II was 47.9 percent. Note that this relatively high rate reflected two facts. First, most of the countries that mobilized for World War II had previously mobilized for World War I, and the positive impact of that conflict persisted. Second, there is some evidence that in responding to the budget deficits created by the economic crises of the interwar period, countries that had participated in World War I were more likely to increase top income tax rates to try to balance their budgets than countries that did not mobilize for World War I. Interestingly, tax debates during the Great Depression returned to some of the language of equal sacrifice that was so prevalent during World War I to meet the new national emergencies of the early 1930s. Despite this somewhat high starting point, the World War II mobilization countries increased their income tax rates during the war and had an average top marginal rate of 75 percent in 1946.
While this “before and after” evidence is striking and consistent with our core arguments, it assumes that rates would have remained the same absent the war. This assumption is somewhat difficult to justify. In the eight countries in the sample that did not mass mobilize for World War II, average top rates increased from 30.5 percent in 1938 to 49.4 percent in 1946. This means that the difference-in-differences estimate of the effect of World War II participation is 8.2 percentage points. This is a substantial effect and is consistent with our argument, but it is smaller in magnitude than the effect of World War I.
The smaller estimated effect of World War II needs to be understood in context. First, most of the countries had already mass mobilized for a war. With rates still high from the previous war, it is logical that another mobilization would have a smaller absolute effect on rates. Second, the quality of the difference-in-differences estimate for World War II is not nearly as strong as that for World War I. The sample of nonmobilization countries includes four countries—Belgium, Denmark, the Netherlands, and Norway—that were occupied during the war and were substantially affected by it. Among the four remaining countries in the nonmobilization sample, Sweden and Switzerland—though not combatants—mobilized a substantial proportion of their population (more than 6 percent in Sweden and more than 12 percent in Switzerland). Further, the timing, scope, and expense of the conflict did not provide the surprise that World War I did. At least some of the already high rates in 1938 were in part due to efforts to rearm in anticipation of future conflict. All of these factors would contribute to attenuating our estimates of the effect of World War II on top income tax rates. It bears repeating that despite these issues, we still see evidence of a large effect of the war on the taxation of high incomes.
Given the evidence that we have presented for the early and mid-twentieth-century mass mobilized conflicts, it is useful to briefly consider what the data have to say about the overall impact of mass mobilization on top rates of income taxation. We have data recording whether a country fought in an international conflict and the extent it mobilized its population from 1816 to the present. This evidence, combined with the inverted-u shape of average top rates presented in figure 3.1, is broadly consistent with our argument that mass war mobilization played a central role in the trajectory of taxation of high incomes. Prior to 1900, rates were low and there was only a single conflict—the Franco-Prussian War—for which at least 2 percent of the population was mobilized to fight.47 After 1970, no countries had any conflicts with mobilization above the 2 percent threshold. As we have already noted, top income tax rates slowly but surely decreased from this point to the present. In chapter 8 we turn to a more detailed examination of the decline in top income tax rates in the second half of the twentieth century. In regression analyses employing a wide variety of econometric specifications and reported in the online appendix, we find clear evidence that mass mobilization wars are associated with an increase in top rates of income taxation and that it is plausible to give this relationship a causal interpretation.
There is a final feature of the effect of war mobilization; it may have eventually also led to higher taxes in nonmobilizers. We have emphasized that attitudes toward taxing the rich depend on self-interest, fairness considerations, and finally judgments about economic efficiency. When belligerents during and after World War I raised top marginal rates to levels that had previously seemed unimaginable, this showed that it could be done without causing an economic catastrophe. This could have led governments in nonmobilizing countries to alter their calculations about how much to tax the rich. To the extent this was true, it might mean that our difference-in-differences comparisons are underestimating the effect of war on top tax rates.48
INITIAL EVIDENCE ON WAR AND INDIVIDUAL ATTITUDES
The preceding evidence about mass warfare is all macro in form; it tells us what countries did, but it says nothing about whether war mobilization led to a shift in individual attitudes and in the type of fairness arguments used to debate taxing the rich. Much of the rest of this book will be devoted to this issue. Tracking individual attitudes is a difficult task given the absence of surveys or opinion polls for the World War I era and their extremely limited availability for World War II. The United States is the one country for which World War II era surveys can be plausibly used to gauge the effect of mass mobilization on tax attitudes. Two early Gallup surveys provide us with prima facie evidence that entry into war did in fact prompt individuals to favor increased taxation of the rich, though it does not say whether individuals were responding to specific fairness arguments. We present these surveys as suggestive evidence of shifting attitudes before delving into this subject in greater detail in the chapters to follow.
In July 1941, with U.S. participation in World War II still an open question, the Gallup organization asked the following question to a sample of the national adult population: “In order to help pay for defense, the government will be forced to increase income taxes. If you were the one to decide, how much income tax, if any, would you ask a typical family of four with an income of $X to pay?”
Using a split-ballot questionnaire, the survey elicited preferred tax rates for eight different income categories ranging from $1,000 per year to $100,000 per year. In March 1942, after the attack on Pearl Harbor, Gallup asked the identical question, substituting the word “war” for “defense.” The timing of the surveys and the corresponding difference in question wording allow for a before and after test of whether war mobilization shifts attitudes in favor of taxing the rich. Figure 3.11 presents the observed opinion changes. The three panels report data for respondents in different socioeconomic status (SES) groups as determined by the interviewer’s coding of the respondent on a subjective class scale. The scale ranged from “poor” to “average” to “wealthy.” In each panel, the preferred effective tax rate of the median respondent is plotted against the income of the hypothetical family of four referred to in the question. Across all three SES groups, the war had virtually no impact on the tax rate that respondents thought relatively low- and middle-income families should pay. In stark contrast, across all three categories we see a preference for increased taxation of the highest income groups.
The two Gallup polls from the 1940s provide strong preliminary evidence that mass mobilization for war can prompt all income groups to prefer increased taxation of the rich. They do not of course say why individuals preferred to tax the rich. It might have been because of the power of compensatory arguments, as we suggest, or it might have been for other reasons. In the rest of this book we use more detailed evidence on what people said in public debate to try to get at this question.
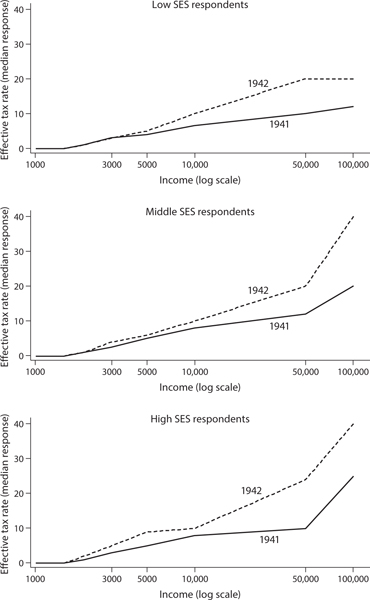
Figure 3.11. World War II and U.S. Opinion on Tax Progressivity. The figure reports median responses to Gallup questions eliciting effective tax preferences in the U.S. public before and after the onset of World War II for a family of four with various levels of income. Preferred tax schedules are reported separately for low, middle, and high SES respondents as determined by the interviewer’s coding of the respondent on a subjective class scale. Sources: Gallup Poll #1941-0242 and Gallup Poll #1942-0263.
THE DETERMINANTS OF TOP INCOME TAX RATES
With this chapter we have begun our empirical investigation of when and why countries tax the rich. The data on top marginal income tax rates show a number of important trends for which any “why” explanation will need to account. The idea of the modern income tax and its effectiveness were established from the early nineteenth century. Despite this fact, most countries did not adopt an income tax until the late nineteenth or early twentieth century. Even when they did do so, they set top rates at very low levels—typically in the single digits. Income taxes with high top rates simply did not exist prior to the second decade of the twentieth century. High income tax rates were first adopted in countries mobilized to fight in World War I. After this conflict, sustained differences remained between those countries that fought in the war and those that did not. That said, the war seemed to make the idea of adopting higher rates more plausible in all countries, and in all countries political conflict over the income tax became a central feature of political competition. The Great Depression and the fiscal shortfalls associated with it led countries, especially those that had participated in the war, to raise their top rates to levels similar to those adopted during the war. World War II pushed rates even higher, with top rates in some countries surpassing 90 percent. Although rates fell a bit after the war, they remained quite high during the 1950s and 1960s and then substantially declined in most countries from the late 1970s to the present.49
The question we consider in the remainder of this book is how we can best understand the effect of war on taxation of the rich.50 Can it be explained by the fact that mass mobilization allowed for new compensatory arguments for taxing the rich? The initial evidence we have provided on mass opinion is consistent with this interpretation, but it could also be consistent with others. Chapter 6 provides a broader view of how World War I shifted the types of fairness-based arguments used for taxing the rich. Before we do that, however, it is important to consider several alternative explanations for the war effect that have nothing to do with fairness. Four of these fail to convince and can be quickly dismissed.51 Two further alternative explanations will require greater discussion in chapters 4 and 5.
A first possibility involves nationalism. Were the rich more willing to be taxed simply because they were filled with patriotic fervor? The problem with this argument is that nationalism could just as well inspire the rest of the population to sacrifice on the battlefield without demanding that the rich also be taxed.52 We therefore need to consider fairness arguments in order to understand why the rich were asked to perform a fiscal sacrifice.
A second possibility is related to the idea we considered in chapter 1—perhaps top rates increased as the size of government increased. This could account for the war effect if rates on the rich increased because of higher levels of spending due to the war effort. But this argument would logically imply that rates across the income distribution should increase to a similar degree. As we have seen in table 3.1, and as we document further in chapter 5, this was not the case. During the war, governments raised rates more on the rich. Further, figure 3.12 plots the average top income tax rate and the size of government as measured by average tax revenue as a percentage of gross domestic product. The figure strongly suggests that the size of government has not generally driven rates as revenue continued to grow during the twentieth century but top rates of income taxation declined.
A third possibility is that support for taxation increased because governments were spending the money on fighting wars rather than providing peacetime defense or basic public goods. The idea here would be that the taxes the public supports depend on how the money is spent. We find some evidence consistent with this view. At various points during the Second World War, the Gallup polling organization asked respondents whether they thought that the amount of federal income tax they were currently paying was fair.53 During the war itself, a strikingly high fraction of respondents said that the amount of taxes they paid was fair, an average of 86 percent across four polls conducted between 1943 and 1945. But by February 1946, the first time Gallup asked the same question after the war had ended, the overall percentage of respondents who said they paid a fair amount of income tax dropped to 65 percent. A similar result was obtained when the same question was asked in November 1946.54 These results are consistent with public opinion about taxation changing depending on how revenue is spent. However, the evidence shows changes in support for taxes on the part of all income groups. Therefore it does not account for why the largest wartime increases in taxes were on the rich.
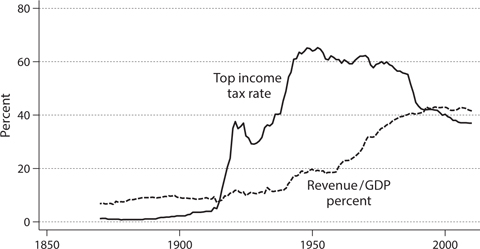
Figure 3.12. Average Top Income Tax Rates and Government Size, 1870–2010.
A fourth possibility is that the political position of the rich was somehow weakened relative to the masses by the war, perhaps because of wartime destruction of their assets or because the poor and middle class gained valuable skills through mobilization, including how to fight. This argument also fails to fit the evidence. Governments in countries where wartime destruction of assets did not take place, such as the United States and Canada, did just as much or more to tax the rich as did governments in countries, such as France, that were devastated by World War I. Similarly, the poor and middle class presumably gained skills across both democratic and nondemocratic countries, but the effect of mobilization on taxation of the rich was more pronounced in democracies.
If these explanations fail to convince, there are two further alternatives that will require more discussion in the chapters to follow. These involve the role of state administrative capacity and simple fiscal necessity, or the fact that governments taxed the rich because that’s where the money was.55 State capacity may have mattered if democratic governments would have preferred to tax the rich, but they lacked the administrative capacity to do so. This would cause us to revisit our conclusions about democracy relative to mass mobilization. Moreover, wars may have increased state capacity and made countries better able to collect income taxes with high rates. To investigate this possibility, in chapter 4 we consider the history of the inheritance tax, a tax that requires less administrative capacity for collection and enforcement when compared with the income tax. Chapter 5 will then have a more complete discussion of the role of fiscal necessity in prompting governments to tax the rich.