Chapter 7
Modeling Cash Flows
If a measurement matters at all, it is because it must have some conceivable effect on decisions and behaviour.
Douglas W. Hubbard
The investor in a MBS transaction is exposed to prepayment risk, or the early termination of the loan. There are two types of prepayment risk:
- Voluntary repayment occurs when the borrower exercises his right to prepay the loan at any time. Voluntary repayments occur due to the following:
- Refinancing—in this case, the borrower may be seeking to obtain a lower rate and/or extract equity from the property.
- Turnover—the sale of property, which is typically related to relocation, family formation, or a life event such as death or divorce.
- Involuntary repayment, in this case the borrower defaults on the loan. Defaults occur due to the following:
- Life event—a job loss, illness, or family break-up, etc.
- Strategic—the value of the property has fallen below the amount owed on the loan.
7.1 Prepayment Conventions
Because a borrower may terminate his loan at anytime, the lender (investor) is said to be “short” the prepayment option to the borrower. In the case of commercial real estate lending, the loans are structured with a make-whole prepayment penalty and as a result, voluntary repayment occurs less frequently, simplifying the analysis and valuation of these securities. On the other hand, residential real estate loans typically do not carry prepayment penalties, and as a result are subject to greater voluntary prepayment risk than commercial real estate. Since residential real estate carries greater prepayment risk, Part Two focuses exclusively on residential real estate prepayment rates.
The cash flow analysis presented next extends the concept of mortgage prepayment to a securitization pool of residential loans. A mortgage-backed security, MBS, represents a pool of many residential mortgage loans each of which may terminate, a prepayment, either voluntarily, refinance or move, or involuntarily, default, at any time. Consequently, the cash flow profile of a mortgage securitization is not a binary outcome. This changes the MBS cash flow profile.
7.1.1 Single Monthly Mortality Rate
The monthly prepayment rate, or single monthly mortality rate (SMM) measures the percentage of a pool's principal balance that has prepaid in the current month. It is based on the change in the pool's factor (survival factor) from one period to the next, and is given by the following [Corporation no date]:

Equation 7.1 can be rewritten:

7.1.2 Conditional Prepayment Rate
The market convention is to state the single monthly mortality rate, or SMM, as an annualized measure, known as the conditional prepayment rate (CPR) [Corporation no date]. The formula for CPR is:

7.1.3 Public Securities Association Model
The Public Securities Association (PSA) model was developed to describe how mortgage prepayments evolve as a function of loan age. The PSA model specifies the mortgage prepayment loan age (seasoning) function as follows:
- Begins at 0.2% CPR the first month,
- Increases by 0.2% CPR per month, and
- Reaches a maximum of 6.0% CPR in month 30.
Figure 7.1 illustrates the application of the PSA model. For example, at 100 PSA the investor is assuming that the pool's prepayment rate will follow the seasoning ramp described above.
- A 150 PSA assumption multiplies the PSA model by 150%. Under this assumption, the pool's prepayment rate will begin at 0.3% in the first month, season 0.3% per month, and reach a peak of 9.0% in month 30.
- A 50 PSA assumption multiplies the PSA model by 50%. Under this assumption, the investor believes that the pool's prepayment rate will begin at 0.1% in the first month, season 0.1% per month, and reach a peak of 3.0% in month 30.

Figure 7.1 PSA Mortgage Prepayment Assumption
7.1.4 Prospectus Prepayment Curve, PPC
Figure 7.1 generalizes the PSA model. Issuers of non-agency residential MBS typically price their transactions using a generalization of the PSA model presented in equation 7.4. For example, a prime non-agency issuer may price its transaction to a PPC ramp that begins at 3.0% CPR in the first month, increasing by 3.0% per month for 11 months, reaching 36% CPR in month 12, the peak seasoning age.

7.2 Modeling MBS Cash Flows
Table 6.4 provides the amortization schedule of a 4.50%, 30-year level payment (amortization) mortgage. The inputs required to calculate the scheduled payment (scheduled interest and principal) are as follows:
- Original balance of the mortgage
- Borrower's note rate
- Term of the mortgage
- Loan age
In the case of a mortgage securitization, the cash flow analysis is complicated by the presence of any or all of the following: servicing fees, guarantee fees (GFee), private mortgage insurance (PMI). These costs are subtracted from the borrower's note rate. The net of the borrower's note rate less servicing, GFee, and PMI is the net note rate, or net weighted average coupon (NWac).
- The servicing fee compensates the servicer on a monthly basis for the administration duties outlined in Chapter 6 (section 6.4).
- The PMI fee protects the lender from loss in the event that the borrower defaults and there is insufficient equity in the home to cover the outstanding balance of the note (see Table 6.2).
- The guarantee fee is a premium paid by the borrower to the guarantor, typically the party that securitized and sold the MBS pool, for its guarantee of timely principal and interest to the investor.
The NWac, scheduled principal, and prepaid principal are “passed through” to the investor, hence, the term pass-through security.
7.2.1 0% PPC Assumption—No Prepayment
Figure 7.2 illustrates the cash flow profile of a 4.0% MBS pool assuming a 0% PPC—no prepayments.
- In the absence of prepayments, the investor receives a level cash flow over the life of the pool. In this case, the investor receives $609.13 per $100,000 invested.
- Early in the life of the pool, a greater share of the mortgage payment consists of interest. As the loans underlying the pool amortize, the share of scheduled principal, as a percentage of the borrower's scheduled payment, increases.
- About halfway through the life of the loan the amount of scheduled principal paid is greater than the amount of interest paid. This accelerates the amortization of the loans underlying the pool as it approaches its final payment maturity date.
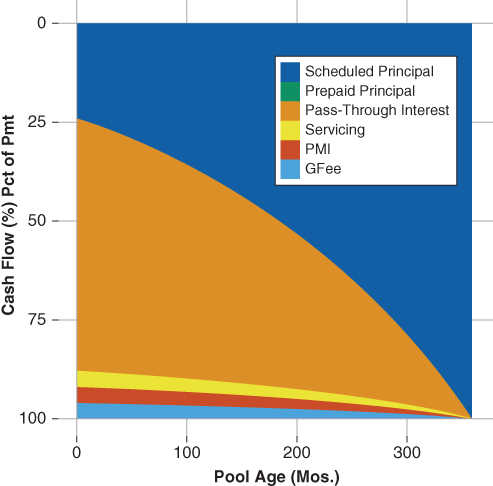
Figure 7.2 Cash Flow Share Assuming 0% PPC
7.2.2 100% PPC Assumption
The borrower's option to prepay his loan at anytime alters the timing of the cash flows received by the investor because prepayments are passed through as the unscheduled return of principal. The example presented in Figure 7.3 uses a 100 PPC assumption and shows that as the borrowers in the pool exercise their option to prepay the principal returned to the investor becomes front loaded.
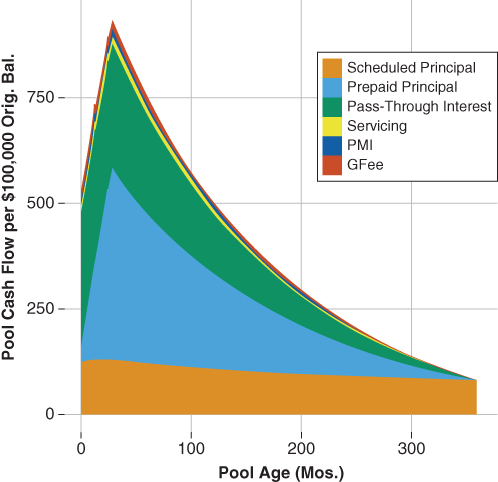
Figure 7.3 Pool Cash Flow Assuming 100% PPC
Figure 7.3 illustrates how the application of a prepayment assumption changes the share of principal and interest paid to the investor. For example, at month 100 the share of principal paid—both scheduled and prepaid—account for around 75% of the total principal received. In contrast, Figure 7.2 shows that in the absence of prepayments, scheduled principal accounts for around 50% of the total principal received by the investor.
7.2.3 Applying Prepayment Assumptions
From the cash flow analysis presented in the previous section, one can see that the derivation of MBS cash flows is dependent on the investor's underlying prepayment assumption. As a result, it is important to understand both the nomenclature used in the description of structured security cash flows as well their practical application.
The foundation of all prepayment applications is the single monthly mortality rate (SMM) presented in 7.1. The SMM is the percentage of the outstanding balance that prepays. However, most investors annualize measures of prepayment rates. In the case of MBS, the measure quoted is the conditional prepayment rate (CPR). The CPR is an annualized expression of the SMM. It refers to the amount of prepaid principal an investor would receive over a 12-month period assuming the SMM remains constant.
To calculate a prepaid principal amount, one may be tempted to simply take the CPR or SMM and multiply it by the period's beginning balance—an incorrect application of the concept. The amount of prepaid principal is calculated only after giving credit to the scheduled principal paid in the period. Table 7.1 provides the derivation of the cash flows of a mortgage pass-through security, including the allocation of servicing, the guarantee fee, and PMI. To calculate the pass-through security's cash flows using the example introduced in section 7.2.1, the following steps are taken:
- First, calculate the scheduled principal due (equation 6.11).
- For example, the scheduled principal due based on the beginning balance in Nov. 2013 and assuming 100% PPC is $273.83.
- Second, determine the appropriate CPR.
- For example, a loan age of 10 along the 100 PPC assumption is equal to 2.2% CPR.
- Then, de-annualize the CPR to an SMM—this is the monthly principal prepaid.

- Third, after giving credit to the scheduled principal due, calculate the prepaid principal.
-
- Finally, allocate interest. First, pay the investor interest amount, servicing, PMI, and G-Fee.


Table 7.1 MBS Cash Flow Table
| Original Balance: $100,000 | |||||||
| NWac: 4.00% | |||||||
| Gross WAC: 4.75% | |||||||
| Term: 360 mos. | |||||||
| PPC Assumption: 100 | |||||||
| Pmt. Date | Begin Bal. | Sched. Prin | Prepaid Prin. | Investor Interest | Servicing | PMI | G-Fee |
| 2013-02 | 100000.00 | 275.80 | 16.63 | 333.33 | 20.83 | 20.83 | 20.83 |
| 2013-03 | 99707.55 | 275.77 | 33.20 | 332.35 | 20.77 | 20.77 | 20.77 |
| 2013-04 | 99398.57 | 275.69 | 49.69 | 331.32 | 20.70 | 20.70 | 20.70 |
| 2013-05 | 99073.18 | 275.56 | 66.10 | 330.24 | 20.64 | 20.64 | 20.64 |
| 2013-06 | 98731.51 | 275.39 | 82.42 | 329.10 | 20.56 | 20.56 | 20.56 |
| 2013-07 | 98373.69 | 275.17 | 98.64 | 327.91 | 20.49 | 20.49 | 20.49 |
| …… | |||||||
| 2013-11 | 96784.04 | 273.83 | 162.34 | 322.61 | 20.16 | 20.16 | 20.16 |
| 2013-12 | 96347.86 | 273.38 | 177.93 | 321.15 | 20.07 | 20.07 | 20.07 |
| 2014-01 | 95896.54 | 272.88 | 193.38 | 319.65 | 19.97 | 19.97 | 19.97 |
| …… | |||||||
| 2015-01 | 89377.15 | 263.45 | 364.54 | 297.92 | 18.62 | 18.62 | 18.62 |
| 2015-02 | 88749.15 | 262.38 | 377.42 | 295.83 | 18.48 | 18.48 | 18.40 |
| 2015-03 | 88109.34 | 261.27 | 390.06 | 293.69 | 18.35 | 18.35 | 18.35 |
| …… | |||||||
| 2028-01 | 21621.48 | 119.03 | 110.58 | 72.07 | 4.50 | 4.50 | 4.50 |
| 2028-02 | 21391.86 | 118.42 | 109.40 | 71.30 | 4.45 | 4.45 | 4.45 |
| 2028-03 | 21164.03 | 117.81 | 108.24 | 70.54 | 4.40 | 4.40 | 4.40 |
| …… | |||||||
| 2042-12 | 95.26 | 47.63 | 0.24 | 0.31 | 0.01 | 0.01 | 0.01 |
| 2043-01 | 47.38 | 47.38 | 0.00 | 0.15 | 0.00 | 0.00 | 0.00 |
A mortgage pass-thorough security is the simplest expression of structuring a pool of mortgage loans. The MBS pool illustrates both the division of principal and interest.
- In the case of a pass-through security the principal—both scheduled and prepaid—is allocated 100% to the pass-through security.
- The interest is allocated first to the servicer plus lender paid PMI. The servicer remits the remaining interest to the trustee and the trustee allocates interest as follows:
- The investor—in the case of guarantee the G-fee provider advances full and timely payment to the investor.
- The G-Fee provider.
Notice, with the exception of the G-fee provider, the investor's interest priority payment is last in the waterfall. Understanding the cash flow dynamics of the underlying collateral is the key to the valuation of structured securities irrespective of the type of loans (residential mortgage, commercial mortgage, auto loan, etc.). The valuation of structured securities, like residential MBS, requires deriving the timing of the return of principal and timely payment of interest. Modeling expected cash flows provides the foundation for discounting along the spot rate curve.
Cash flow modeling drives the valuation of all structured securities. It establishes a framework that defines the following:
- Timing of the return of principal
- Payment of interest to the investor
- Allocation of losses due to borrower default
- Recovery of principal following the liquidation of defaulted loans