Chapter 15
The Financial Dynamics of the Fund Management Industry
In all of the preceding chapters, we have looked mainly at mutual funds themselves: their basic features, how their investments are managed, how they are sold, and the services they provide to shareholders. In this chapter, we turn our attention to the management companies responsible for day-to-day fund investments and operations, examining the financial dynamics of both the individual firms and the industry they operate in.
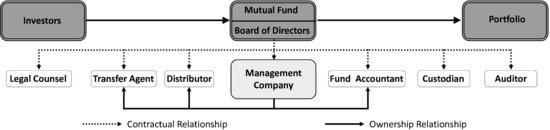
As a prelude, let’s review the difference between a mutual fund and a fund management company, by looking at the diagram of a fund’s structure from Chapter 2 presented here again as Figure 15.1. You’ll recall that mutual funds are unusual corporations because they generally have no employees. Rather than have a large staff, a fund gets its work done by signing contracts with service providers; the primary role of a fund’s board of directors is to negotiate these contracts and monitor service provider performance under them.
The most significant contract the board signs is with the management company, the firm that usually lends its brand name to the fund and has often provided the seed capital at its creation. The management company is responsible for investment management, normally using the expertise of its own investment adviser, although it may at times hire a third party, called an investment subadviser, to handle all or part of this function. It arranges for distribution of shares of the fund, either directly to investors or working with intermediaries. Finally, it coordinates other needed services, such as shareholder servicing through the transfer agent. When legally permitted, some management companies will handle these services themselves, though they are just as likely to outsource them to specialized providers. Profits are derived from the fees earned for providing each of these services, with the management fee being the most important driver of profitability.
Managing mutual funds has historically been a quite profitable business. In the five years ending 2009, the nine publicly traded mutual fund sponsors with market capitalizations over $2 billion earned a net profit margin of 14 percent on average, despite substantial losses incurred by two of the companies during the credit crisis. Return on equity during this period was even higher, at 19 percent.1
FIGURE 15.1 Typical Mutual Fund Service Provider Relationships
No wonder, then, that many firms are interested in entering the mutual fund business—either by starting up new fund families or, more often, by acquiring existing managers. This has led to a rapidly changing composition of firms within the asset management industry.
This chapter reviews:
- The expenses incurred by mutual fund shareholders and their relationship to management company profitability
- The controversy over the level of management fees and the level of competition within the industry
- Mergers and acquisitions in the fund industry over the last decade
EXPENSES FOR FUND INVESTORS
Shareholders pay various charges when they invest through a mutual fund. We’ve explained most of these fees in detail in our earlier chapters, but let’s summarize them here and review their impact on the management company’s revenue. Table 15.1 provides an overview of these expenses, listing the type of expense, whether it is paid directly from the shareholder’s account or indirectly through the fund, and which entity receives the fee.
The last column in the table indicates whether an item is included in the expense ratio, a statistic that funds are required to disclose in their prospectuses and shareholder reports. (Turn back to Chapter 3 for a refresher on these documents.) To compute this ratio, funds add together the expenses indicated in the chart, then divide by average net assets to arrive at a percentage figure. Because the SEC requires that every fund calculate the expense ratio in exactly the same way, investors can easily compare costs across funds.
TABLE 15.1 Expenses Incurred by Fund Investors
Fund expenses fall into five categories: distribution charges, securities transaction costs, shareholder transaction fees, fund services charges, and the management fee. We look at each in turn.
Distribution charges. Investors may pay sales loads when they buy or sell fund shares; they may also pay annual 12b-1 fees that cover ongoing service or distribution costs. These charges are used in different combinations to create a choice of share classes. Investors pay sales loads directly and 12b-1 fees indirectly as part of fund expenses.
Distribution fees can be substantial for a fund sold through intermediaries, but they’re not a significant source of profit to fund management companies. That’s largely because these fees are used to compensate the intermediary that has made the sale. In fact, the bulk of front-end sales loads are immediately passed on or reallowed to the intermediary. For most classes of shares, all or almost all of 12b-1 fees are also reallowed. (The notable exception is Class B shares: the fund’s distributor retains a significant portion of the 12b-1 fees for this class so it can recoup the upfront commission payments made to the intermediary at the time of the sale.) The distributor does keep any back-end contingent deferred sales charges received, not just for Class B but for all classes of shares. These charges are in place to ensure that the distributor’s recovers its upfront sales costs even if the investor redeems after holding shares for only a short period. (See Chapter 10 for more on share classes and intermediary compensation.)
Another reason why distribution fees are not an important source of revenues to the management company: sales loads have been declining over time. The maximum allowable front-end load dropped from 7.9 percent in 1980 to 5.3 percent in 2009. The decline in actual sales loads paid has been even more dramatic, falling from 5.3 percent to only 1.0 percent over the same period. In fact, according to Strategic Insight, sales charges were waived on almost 70 percent of the sales of mutual funds imposing front-end loads in 2008 and 2009. Intermediaries are now more likely to charge clients a separate asset-based fee that does not involve the fund manager.
If a fund is sold directly to shareholders, the management company does retain all of the distribution fees. But the dollars involved here are usually quite small, since funds sold in the direct channel generally do not impose sales loads, while the 12b-1 fees for these funds are low—or even nonexistent. Moreover, these 12b-1 fees are much less than the cost of building and maintaining a direct distribution system.
In sum, distribution is not a key driver of profitability for mutual fund managers. In fact, when all the costs of marketing are considered, distribution is usually a cost center for fund management companies. It’s only a means of increasing assets under management and, therefore, management fee revenue. As we discussed in Chapter 10, distribution can be quite profitable for third parties that sell funds from many different sponsors along with other investment vehicles. But fund management companies generally do not view distribution as a source of profit.
Securities transaction fees. Funds may pay transaction fees whenever they buy or sell securities. These include:
- Commissions paid to brokers for executing trades in stocks (if a broker is used)
- Fees paid to electronic communication networks
- SEC fees imposed by the exchanges on each transaction
These fees are deducted from the value of the fund’s investments and do not appear in the income statement as an expense. While these fees are paid directly by the fund, they may provide an indirect benefit to the management company. As we discussed, broker-dealers often provide research services to the investment managers who direct trading business to them. Chapter 8 discusses securities trading in detail.
Shareholder transaction fees. Shareholders may pay additional fees directly to the fund when they engage in specific types of transactions. For example, some index funds may charge a fee whenever an investor buys or sells its shares; this fee is designed to recoup the costs of trading in the underlying securities. Other funds impose redemption fees whenever fund shares are sold within a short period after their purchase—usually defined as within either 30 or 90 days; these fees discourage market timing, or frequent trading. Since shareholders pay both of these fees directly to the fund, they do not materially benefit the management company.
In addition, as we learned in Chapter 13, many transfer agents charge for maintaining certain types of accounts—individual retirement accounts or accounts with small balances, for example—or for providing special services, such as wire transfers. These fees may be paid directly by the shareholder or may be included as part of fund expenses. In either case, they are meant to cover the higher costs of these services and generate little or no profit for the transfer agent.
Fund services charges. Shareholders indirectly pay a fund’s costs of providing services to its shareholders and maintaining its corporate status. These charges include:
- The transfer agent fee, which is usually the largest component in this category. A portion of this fee may be paid to subtransfer agents. See Chapter 13 for a description of the role of the transfer agent and sub-transfer agent and the structure of this fee.
- Shareholder communication expenses related to the printing and mailing of required disclosure documents such as the prospectus and shareholder reports. If the fund is holding a proxy vote, this category might include the cost of hiring a proxy solicitation firm.
- The cost of administrative services related to keeping fund records as discussed in Chapter 14.
- Registration fees paid to the SEC and state securities commissions.
- Professional fees for the services of auditors and lawyers.
- Custodian fees for the safekeeping of securities, reviewed in Chapter 14.
- Expenses related to the board of directors.
These fees are paid by the fund to the organization that provides the service. In some cases, that provider must be a third party. The fund’s auditor, for example, must be independent of the fund manager. But in other instances, the management company may be the service provider, either directly or through a subsidiary. For example, many fund management companies provide transfer agent or administrative services through affiliates, though they may outsource a portion of these functions to unaffiliated specialists.
Not all funds charge separately for these services. Some fund groups include a portion of these services in an all-inclusive management fee that shifts the risks (and rewards) of controlling total expenses from shareholders to the management company. In 2008, 19 of the 100 largest fund companies had all-inclusive fees on at least some of their funds, generally money market funds.
Management fee. While a management company may make a profit providing specific services to a fund, those profits are generally quite small relative to those from the management fee. Table 15.2 shows the annual expenses for the hypothetical Avon Hill Stock Fund, a $6 billion actively managed stock fund distributed through the intermediary channel. (This table includes only those costs that are part of the expense ratio.)
TABLE 15.2 Annual Expenses for the Avon Hill Stock Fund
| Expense Type | Amount ($000) | Percent of Total |
| 12b-1 distribution fees | 12,723 | 22% |
| Transfer agent fees | 9,937 | 17% |
| Shareholder communications expenses | 3,504 | 6% |
| Administrative services, including fund accounting | 1,696 | 3% |
| Registration fees | 183 | <1% |
| Professional fees | 326 | <1% |
| Custodian fees | 135 | <1% |
| Board of director expenses | 189 | <1% |
| Total services charges | 15,970 | 27% |
| Management fee | 29,722 | 51% |
| Total | 58,415 | 100% |
As you can see, the management fee is usually the largest component of a fund’s ongoing expenses. It specifically pays for investment management services from portfolio managers who work for either the management company or an outside subadviser. And it more generally compensates the management company for the use of its brand name, for taking the risk of setting up the fund and for organizing its distribution. It is normally the main source of a mutual fund management company’s earnings.
Management fees are expressed in basis points, representing a percentage of a fund’s assets. Since investment management services are included in the management fee, the level of these fees varies by the type of assets the fund invests in. Equity funds have the highest fees on average, while money market funds have the lowest. Table 15.3 shows the range of management fees from the bottom of the third quartile to the top of the second quartile at the end of 2008 (excluding the top 25 percent and bottom 25 percent of fees). It also shows the median fee.
TABLE 15.3 Fund Management Fees in Basis Points (2008)
Source: Lipper.
| Type of Fund | Fee Range for 2nd and 3rd Quartile | Median Fee |
| Stock funds | 65 to 100 bp | 80 bp |
| Bond funds | 45 to 62 bp | 53 bp |
| Money market funds | 20 to 45 bp | 27 bp |
For many funds, the basis point charge declines once assets reach a certain level, called a breakpoint. For example, an equity fund might have a management fee of 50 bp for the first $500 million of fund assets and 45 bp for fund assets above that threshold. The breakpoint may be based on just that fund’s assets, on total assets in the entire fund complex or on the assets of a subset of the funds within the family, such as all equity funds. Breakpoint pricing is extremely common; Lipper reports that, at the end of 2008, more than 80 percent of the 100 largest funds used that design.
Given the large dollar amounts involved and the profitability of the companies that earn them, the level of management fees has attracted considerable attention.
MANAGEMENT FEE REVENUE: THE DEBATE
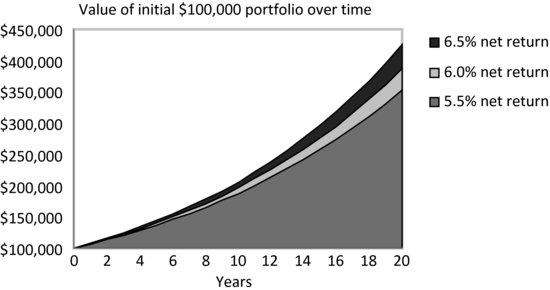
Why so much concern about fees? Because fees can have a significant impact on shareholder returns, especially when compounded over time. Figure 15.2 illustrates this effect. Suppose that an investor puts $100,000 in three identical equity funds—identical, that is, except for the fees they charge. One has an annual expense ratio of 0.5 percent, while the other two have annual expense ratios of 1.0 percent and 1.5 percent. If all three portfolios generated an average return of 7 percent per year before fees, the portfolios would produce net returns after fees of 6.5 percent, 6.0 percent, and 5.5 percent, respectively. At the end of a 20-year period, the $100,000 would be worth $425,000 if invested in the fund with the lowest fees and just $352,000 in the fund with the highest fees. That’s a difference between the highest and lowest net return of $73,000, or over 70 percent of the original investment, solely due to fund expenses. The differential is illustrated in Figure 15.2.
FIGURE 15.2 The Impact of Expenses
The impact of fund expenses is more than just theoretical. A recent study by Morningstar found that expense ratios were good predictors of fund performance. For the five years ending 2010, the lowest-cost funds in every asset class had, on average, consistently better returns than the highest-cost funds.2
Because of the critical impact of fees, the SEC wants to make sure that investors are fully aware in advance of all the charges they’ll incur in connection with a mutual fund they may buy. Expense information must be displayed prominently in virtually all material that is presented to shareholders and prospective buyers, including the summary prospectus, the statutory prospectus, shareholder reports, and advertisements.
This information is presented in many different ways so that investors can see the full expense picture from many different angles: fees are shown as a percentage of investment, as a dollar amount, and as a component of performance. Specifically, funds must provide:
- The maximum front-end sales load, if any, along with details on how investors can reduce those sales charges by taking advantage of breakpoints
- The maximum contingent deferred sales charge, if any, and details on its application
- The fund’s annual expense ratio, broken down into management fee, 12b-1 fee (if any), and other expenses
- The actual expenses paid during the year on a $1,000 investment in a fund
- The expenses that hypothetically would be paid during the year on that $1,000 investment if it generated a 5 percent return
- The expenses that hypothetically would be paid over 1, 3, 5, and 10 years on a $10,000 investment that generated a 5 percent annual return
- Fund investment returns that reflect both the payment of a front-end load and the imposition of a back-end contingent deferred sales charge, if any
To help investors find low-cost alternatives, FINRA provides an online fund analyzer that allows consumers to screen funds based on their expense ratio, along with other criteria. This tool is available at http://apps.finra.org/fundanalyzer/1/fa.aspx.
The Critics’ Case
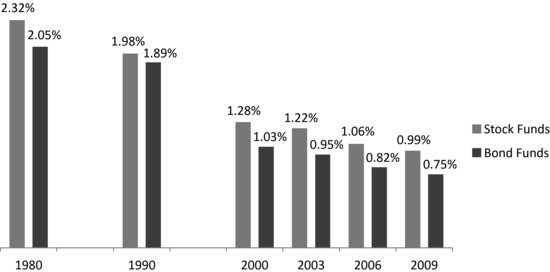
Yet despite all these disclosures, industry detractors believe that fees are still too high. In their eyes, fund expenses may have come down in recent years (as shown in Figure 15.3), but they haven’t come down enough.3 The critics make their case with three principal arguments:
Negative 1: Insufficient benefit from economies of scale. The growth in industry assets alone should have led to even lower fees, the critics believe. They argue that the industry has enormous economies of scale, meaning that expenses rise a lot more slowly than revenues. “It doesn’t cost much more to manage a $7 billion fund than it does to manage a $1 billion fund,” they claim, “So why does the industry charge shareholders seven times as much to manage the larger fund?” (Remember that management fees are based on assets.)
Negative 2: Other investors pay less. And, say the critics, “It’s not just that management companies haven’t passed on their savings to their mutual fund shareholders, they’re actually charging other clients significantly less.” (Fund managers often run accounts for other large institutions, such as government and corporate pension plans, as well as for mutual funds.) One much-cited 2001 study found that, on average, management companies charged their public pension plans half as much as they charged mutual funds, expressed as a percentage of assets under management.4
Negative 3: Noncompetitive market. Underlying both of these complaints is a more basic concern: that the market for mutual funds is not competitive. Critics claim that investors are either unaware of the fees they’re paying or unable to switch to lower-cost funds because they’d incur capital gains taxes or back-end loads—and can present academic research to support this view.5
At the same time the critics argue, the investors’ representatives, the members of the fund’s board of directors, are in the pocket of the management company and not diligent in driving down fees. They take a check-the-box approach to reviewing fees, without vigorously fighting for shareholder interests. For evidence, they point to the dearth of performance fee structures, as discussed in “Paying for Performance.” (Also see Chapter 2 for a review of the debate regarding fund boards.)
PAYING FOR PERFORMANCE
Another concern expressed about mutual fund fees: that they don’t align the interests of the investor and the management company. And it’s true that fund managers generally don’t get paid specifically for producing the thing that shareholders care about most—investment performance. In fact, fewer than 250 of the 7,600-plus funds in existence at the end of 2008 paid a performance fee according to Lipper. Performance fees have been used mainly with equity funds.
Performance fees increase the management fee if fund performance exceeds that of a benchmark index or peer group, and they reduce the management fee if performance falls short. Note that the SEC requires that mutual fund performance fees have this symmetry, providing a reward for good performance with an identical penalty for poor performance. (Hedge funds, as we saw in Chapter 12, have a very different performance fee structure. The manager of a hedge fund usually is paid a base fee plus 20 percent of the fund’s realized gains, but do not absorb 20 percent of the fund’s realized losses.)
If performance fees so perfectly align the interest of the fund’s manager and its shareholders, why are they so rarely used? It’s partly because fund managers don’t like the additional volatility in their revenues. They note that their income already depends on performance since a fund’s sales—and, therefore, the management fees based on the assets determined by the level of sales—are driven by recent results. On the other hand, their costs don’t vary much with performance.
At the same time, if the fee uses an index as a benchmark, it can be very difficult to actually earn positive performance fees, since fund performance—net of fees—is being compared to index performance before fees. Finally, if the manager does well and earns a performance fee, they could, ironically, be penalized by cost-conscious investors for having a higher expense ratio, since performance fees must be included in the calculation.
One other drawback: Performance fees can change portfolio manager behavior. A fund manager who is already earning a high performance fee may be too conservative to protect existing gains. On the other hand, a fund manager deep in negative territory has nothing to lose from taking a lot of risk.
According to the critics, power in the industry is highly concentrated. They note that at the end of 2009, the top 10 fund families managed over half of industry assets, and the top 25 percent managed almost three-quarters. And firms are consolidating at a rapid pace.
The Rebuttal
The mutual fund industry’s defenders take issue with all of these points, contending that the industry is, in fact, extremely competitive. Their arguments include:
Positive 1: Fees decline with increasing assets. First of all, fees do decline as the level of assets increase: The prevalence of breakpoints in management fee contracts makes that a certainty. But the benefit to shareholders is not apparent when looking at an entire asset class, because the mix of funds changes over time. For example, within the equity category, many of the new fund launches in recent years have been international stock funds, which are more costly to manage and usually have higher fees than U.S. stock funds. So, for equity funds on average, a decline in fees on U.S. stock funds will be offset by the increased representation of higher-fee international funds. Because of this changing mix, comparisons over time can be tricky.
Positive 2: No fee discrimination. Industry defenders contend that evaluating fees paid by mutual funds against those paid by institutional investors is comparing apples and oranges, because the two types of investors are contracting for very different services. Institutional investors hire money managers to make investment decisions only; they take care of portfolio administration themselves. Mutual fund management companies, on the other hand, take on all of these functions for fund shareholders. A study from the Investment Company Institute found that when only investment advisory services are considered, mutual funds pay fees that are remarkably similar to those paid by institutional investors.6 And in a recent decision on the Jones v. Harris case involving mutual fund fees, the U.S. Supreme Court recognized that the services provided to different types of clients may not be comparable.
Positive 3: Competitive market for funds. More importantly, the market for mutual funds is very competitive, say the industry’s defenders. There’s lots of evidence that investors, management companies, and boards of directors all pay close attention to fees.
- Investors focus their purchases in funds with lower fees. As we’ve already learned, they’re unlikely to pay a front-end load. And some studies show that they appear to be sensitive to annual expense ratios as well. In fact, Investment Company Institute analysis of the 10 years ending with 2009 found that 79 percent of investor cash flow into stock funds went into funds with expense ratios in the lowest quartile.
- Management companies frequently take steps to ensure that the annual expense ratio does not get too high and become a deterrent to new investors. To do this, they may waive a portion of the management fee; in some instances, they may even pay for, or subsidize, other operating expenses. Fund sponsors often do this for smaller equity funds that have not yet achieved economies of scale, so that service fees are still high as a percentage of assets. It is also common practice for money market funds and some higher quality fixed income funds, especially during periods of low interest rates; for these funds, the management company will adjust its fee until the fund yield is competitive.
- Fund boards of directors frequently negotiate breakpoints in management fees, and many boards today require a cap on fund expenses. Under these caps, if annual expenses exceed a certain limit, the management company must reduce its fee or even subsidize some of the fund’s other expenses until the cap is reached.
And, overall, the industry just isn’t concentrated enough to be anything less than competitive. One of the best-known ways of measuring the competitiveness of industry structure is with the Herfindahl-Hirschman Index. (“Trying Not to Concentrate” has a detailed explanation.) As of December 2009, the HHI for the U.S. mutual fund industry was 457, well below the standard for even moderate concentration, as calculated by the Investment Company Institute.
Why the relatively low score for the mutual fund industry? Because market share is fairly evenly distributed across many different fund complexes, as you can see in Table 15.4, which excludes ETFs. The mutual fund business is very different from the oil or auto business, where the top four or five companies control the overwhelming majority of the market. In the mutual fund world, by contrast, even the top 10 fund complexes controlled only slightly over half of industry assets at the end of 2009. In that same year, there were another 14 fund complexes with over 1 percent of assets under management each. And mutual funds compete with many other types of investment vehicles—such as separately managed accounts, collective trust funds, and hedge funds.
The table also shows at a glance how dynamic firm rankings have been. Only half the firms ranked in the top 10 in 2009 were in that elite group at the start of the decade, namely Fidelity, Vanguard, Capital Research, BlackRock (which acquired the Merrill Lynch fund management group), and Franklin Templeton. And two of the firms currently in the top 10—PIMCO and Goldman Sachs—weren’t even in the top 25 in 2000. It’s a similar story for Dimensional, Dodge and Cox, John Hancock, Northern Trust, and Wells Fargo; all five of these firms ranked among the top 25 in 2009 but were not among the highest-ranked in the earlier period. The only consistency in the rankings has been among the top three firms. We’ll talk later in this chapter about why Fidelity, Vanguard, and Capital Research have held their top-ranked positions for so long.
TRYING NOT TO CONCENTRATE
How do you determine whether an industry is highly competitive, with lots of smaller firms fighting it out for market share, or an oligopoly, where only a few companies set the terms for everyone? The antitrust division of the U.S. Department of Justice often uses a measure called the Herfindahl-Hirschman Index.
The HHI is calculated by squaring the market share of each firm competing within an industry and then adding up the resulting numbers. As a result, firms with larger shares get a much heavier weight in the calculation. For example, let’s look at an industry that has four firms competing in it. Two of those firms have market shares of 30 percent each; the other two have 20 percent shares. The HHI for this industry is 302 + 302 + 202 + 202 = 900 + 900 + 400 + 400 = 2,600. The two larger firms have been given more than twice as much weight as the smaller firms.
The HHI is lowest for industries that consist of a large number of companies of relatively equal size. For these industries, the HHI approaches zero. If the HHI is between 1,000 and 1,800, the industry is considered moderately concentrated; if over 1,800, it is concentrated. The theoretical maximum—for a monopoly industry with only one competitor—is 1002 = 10,000. The Department of Justice may look closely at mergers that increase the HHI by 100 points or more.
TABLE 15.4 Largest Mutual Fund Complexes by Assets Under Management7
Source: Investment Company Institute. Percentages may not add due to rounding.
In short, the industry’s defenders assert that it isn’t a stable oligopoly—it’s a highly dynamic business in which competition is rife. Shifts in relative fund performance often lead to major shifts in asset shares, so that complexes emphasizing stocks surge ahead during bull markets, while firms focusing on bond or money market funds come to the fore in more unsettled times.
New companies enter the business fairly easily: there were 209 new entrants between 2005 and 2009 alone, while only slightly below the 229 firms that left the industry over the same period, according to the Investment Company Institute. It’s relatively cheap and easy to start up a mutual fund: all you need is $100,000 in seed capital and a dream (plus the resources to file the necessary paperwork with the regulators). You can obtain instant access to the distribution by signing on with a fund supermarket, and paying the operator an annual fee based on fund assets. Moreover, there are many firms that will, for another annual fee, handle all of the administrative services required. With so many essential services available for hire as needed, small funds can find it quite profitable to serve a particular niche of investors.
It’s only once a fund manager gathers a substantial amount of assets that it reaches a decision point. Should it stay small and continue to stay focused in a particular area, or should it broaden out and try to move in to the top tier of fund families? To do this, the manager will need access to broad distribution, capital to develop a more extensive product line, and sophisticated technology, together with specialized teams to support the required recordkeeping and shareholder services. Finally, most of the top-tier players have developed a well-known brand over a long period of time.
Faced with these challenges, many fund managers interested in growing have decided to combine with another firm. They may decide to pool resources with a similar firm in a merger, they could decide to act as an acquirer and buy another fund firm, or they might put themselves up for sale and be acquired by another company. All of this activity is collective referred to as mergers and acquisitions, or M&A, for short. “The Acquisition Two-Step” provides some background on the process.
THE ACQUISITION TWO-STEP
The acquisition of a fund management company is a two-step process. In the first step, a majority of the shareholders of the company being bought must agree to the transaction. They do this by either voting to approve a merger agreement in a proxy vote or by selling their shares to the acquirer. This first step is no different from mergers or acquisitions in any other industry.
It’s the second step that’s unique to the mutual fund industry: the acquirer must obtain the approval of both the independent directors and the shareholders of the mutual funds that the acquired firm manages. That’s because, under the federal securities laws, a change in control of the investment manager of a mutual fund automatically terminates the management contract between the fund and the manager.
If the acquirer would like to continue to manage those funds, it must secure a new advisory contract through another two-step process. First, a majority of the independent directors of the funds must determine that the transfer of the advisory contract does not impose an unfair burden on shareholders. Then the shareholders themselves must approve the contracts through a proxy vote. In reality, the acquiring manager is buying the assistance of the prior manager in obtaining these approvals from fund directors and fund shareholders.8
MERGERS AND ACQUISITIONS INVOLVING FUND SPONSORS
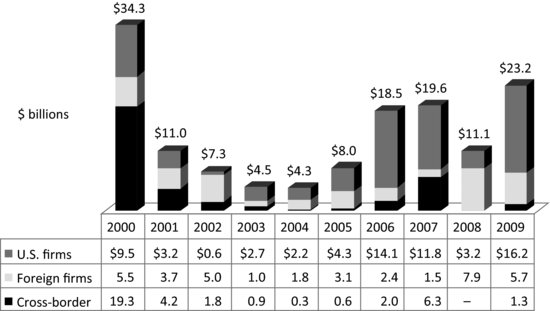
Merger and acquisition activity for fund complexes during the last decade roughly followed the rise and fall of the U.S. stock market—with a modest time lag. To see the pattern, take a look at Figure 15.4, which summarizes all transactions in which a fund sponsor combined with another firm in a deal with a publicly disclosed value of $50 million or more. The peak in M&A deals during 2000 reflected the end of the Internet bubble; once it burst, deal volume declined along with the stock market for several years after that. Then, when the U.S. stock market resumed its climb in 2005, so did the number of M&A transactions involving fund sponsors—though both were to fall again in 2008 when the credit crisis broke. The jump in transactions in 2009 was a bit of a mirage. It was mainly the result of one deal: BlackRock’s acquisition of Barclays’s U.S. fund business for approximately $13 billion.
FIGURE 15.4 Global Asset Management Mergers and Acquisitions (Total Deal Value)
Source: Thomson Reuters information provided by Goldman Sachs.
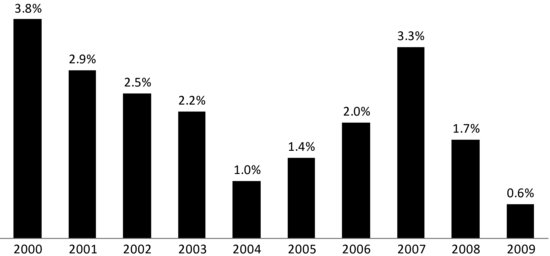
The prices paid in these M&A deals in asset management also tracked the movement in stock prices. Figure 15.5 portrays the median price paid for acquisitions in each year of the past decade expressed as a percentage of assets under management, or AUM. The median deal price peaked in 2000, along with the stock market, at 3.8 percent of AUM, and then declined steeply to a low 1.0 percent of AUM in 2004. When stocks recovered, so did the median deal price, which rose steadily until reaching 3.3 percent of AUM in 2007, before plunging again in 2008. Deal valuations were particularly low in 2009, partly as a result of the credit crisis and partly because of the special circumstances of the BlackRock-Barclays deal. The price paid in that transaction was quite small as a percentage of AUM because Barclays managed primarily low-fee index funds.
FIGURE 15.5 Median Deal Price (Percent of Assets under Management)
Source: Thomson Reuters information provided by Goldman Sachs.
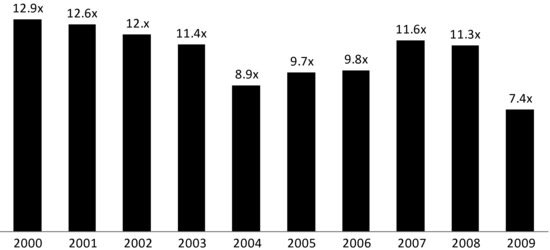
Since price as a percentage of assets under management is so sensitive to the types of funds managed, many professionals prefer to look at the EBITDA multiple, which is the deal price as a multiple of the manager’s earnings before interest, taxes, depreciation, and amortization—essentially the cash produced by the business. This is shown in Figure 15.6. On this measure, the highest-priced deals were still in 2000 and the lowest-priced deals in 2009. However, the decrease in the EBITDA multiple during the first half of the decade, along with the increase in the EBITDA multiple during the second half of the decade, were much more gradual than the fall and rise of deal price as a percentage of AUM.
FIGURE 15.6 Median Deal Price (Multiple of EBITDA)
Source: Thomson Reuters information provided by Goldman Sachs.
There are two other important perspectives on the trends in asset management deals over the last decade—the geographical locus of the acquirer relative to the target, and the industry of the institution acquiring the asset manager.
FIGURE 15.7 Deal Value by Acquirer Industry
Source: Thomson Reuters information provided by Goldman Sachs.
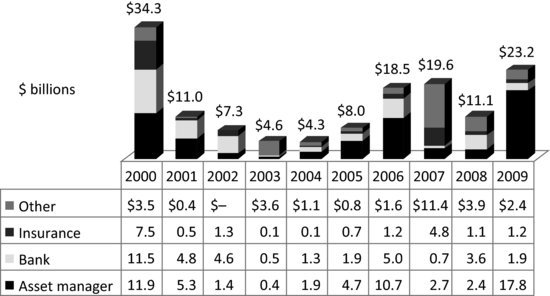
Looking back at Figure 15.4, you’ll see the breakdown of mergers and acquisitions into those involving two U.S firms, those involving two non-U.S., or foreign, firms and those involving a U.S. firm on one side of the deal with a non-U.S. firm on the other side of the deal in a cross-border transaction. Cross-border deals dominated for two years at the start of the decade, continuing a trend begun in the late 1990s, when European financial institutions began to buy U.S. firms in an effort to build global franchises in asset management. Foreign deals showed the highest dollar value only in 2002 and 2008, both years when total deal volume was very low. U.S. deals had the highest dollar value in the other six years.
Figure 15.7 segments the same M&A data based on the type of acquirer. The boom in activity at the start of the decade was led by other types of financial institutions—banks and insurers. Firms in the “other” category predominated in 2003, when M&A activity was at a very low level and again in 2007, when deal value was high. In 2003, brokerage firms Lehman Brothers and American Express were big buyers; in 2007, leveraged buyouts by managements such as those at Nuveen and Marsico topped the charts. In other years, asset managers have been the main buyers.
In the next three sections, we discuss in more detail the asset manager deals during the start, middle, and end of the most recent decade. The web site for this book contains a selected list of asset manager deals during the last decade, organized first by geographical locus of the acquirer relative to the target and then by the type of financial institution of the acquirer.
Trends Early in the Decade
At the start of the most recent decade, many of the M&A deals were cross-border, predominantly European financial firms buying U.S. asset managers. Some of the largest deals involved European banks. For example, Deutsche Bank bought Zurich Scudder, and Société Générale bought Trust Company of the West. But European insurers and asset managers were also active acquirers. Allianz became a significant force in the U.S. fund industry through its purchase of the PIMCO Funds during the 1990s and of Nicholas Applegate in 2000, while CDC Asset Management from France bought NVest.
These firms were generally looking to increase exposure to an industry that they believed had higher growth prospects than the mature banking and insurance businesses at home. The income stream from asset management also promised to provide significant diversification. For a banking institution, asset management fee income is relatively independent of the main drivers of a commercial bank’s profitability—loan volume and interest rate spreads. For insurers, asset management fees were linked to a different business cycle than revenues from selling life insurance policies—and the higher margins in the asset management business were attractive, too.
Overall, these European banks and insurers wanted to build a global franchise in asset management with a major U.S. presence as a key component of that strategy. Success was elusive for some; for example, despite the purchase of Pioneer in 2000, Unicredito Bank did not realize its goal of becoming a major player in the U.S. asset management industry.
Other European institutions were able to build a large U.S. presence through acquisitions. For example, Invesco (then known as AMVESCAP) bought U.S.-based AIM in the 1990s and soon after consolidated its U.S. position by acquiring National Asset Management in 2001 and Stein Roe in 2003. Invesco AIM is a truly global player in asset management: it has been an acquirer in Canada (Trimark), the United Kingdom (Perpetual), and Australia (Country Investment Management) in addition to the United States and has recently moved its corporate base to Bermuda.
Acquisitions of European asset managers by U.S. firms were limited during this period. The only major deal was Chase Manhattan’s purchase of U.K.-based Robert Fleming.
U.S. fund sponsors, however, were active acquirers at the start of the decade within the United States—concentrating on asset managers with expertise working with wealthy individuals, known in the trade as high net worth customers. Managing money for these clients often requires a high level of personalized customer service as well as different approaches to investment management—capabilities that some firms decided to obtain through acquisitions rather than internal development efforts.
Two of the most prominent transactions of this type occurred in 2000. The larger of the two was the acquisition of Sanford C. Bernstein, Inc., a well-respected firm that specialized in managing money for institutions and wealthy individuals, by Alliance Capital Group, a mutual fund manager. (The combined firm is now known as AllianceBernstein.) That same year, Franklin Resources, which manages the Franklin Templeton Fund group, bought Fiduciary Trust, a private bank.
Mid-Decade Trends
During the middle of the decade, the U.S. acquisition scene was dominated by two asset managers: BlackRock and Legg Mason. Both made numerous purchases over the period to expand their asset management capabilities, whether to better serve institutional and high net worth investors (Legg Mason’s acquisition of Private Capital), to grow a hedge fund business (BlackRock’s purchase of Quellos and Legg Mason’s acquisition of Permal), or to increase exposure to equity funds (BlackRock’s purchase of State Street Research). More importantly, both took over the asset management subsidiaries of major brokerage firms: In 2005, Legg Mason acquired Smith Barney’s asset management business (Smith Barney was owned by banking giant Citigroup), while the following year BlackRock bought a majority stake in Merrill Lynch’s asset management arm.
The sale of their fund businesses by wirehouses Smith Barney and Merrill Lynch represented an about-face, as we mentioned in Chapter 10. Until the 1990s, both firms managed major proprietary fund groups that were sold through their own brokerage networks. This strategy was undermined, however, by stricter regulations on potential conflicts of interest and by client demand for open architecture. As a result, both brokers decided to exit fund management to focus on distribution. Smith Barney and Merrill Lynch were not alone in this trend toward specialization. In 2006, broker-dealer Charles Schwab sold US Trust, a manager of high net worth assets that it had acquired only six years before, to Bank of America.
While brokerage firms were leaving the fund management world, many insurance companies continued to buy asset managers. Principal, a mid-size life insurer from the Midwest, and AXA—a giant French life insurer that had purchased a majority stake in Alliance Capital Management (which later become AllianceBernstein)—were both active acquirers in this period. As already discussed, they were looking for higher growth and margins, along with diversification in their revenue streams and, in AXA’s case, a larger global presence. And, as we explained in Chapter 10, asset management is a particularly comfortable fit for insurance companies because of their presence in the variable annuity business.
Not all insurance companies were buyers. In 2006, Nationwide Insurance actually sold Gartmore—a U.K. manager it acquired in 2002—back to its management in a leveraged buyout with the financial support of Hellman & Friedman, a private equity firm. In a leveraged buyout, managers borrow a lot of money to buy ownership from current stockholders; they then use the cash generated by the business to pay off the loans over time.
The Gartmore deal was not the sole leveraged buyout in this period. We’ve already mentioned two others—the buyouts at Nuveen and Marsico—and there were at least thirteen more between 2004 and 2007. This flood of leveraged buyouts of asset managers was driven by the availability of cheap financing. Private equity firms had large amounts of funds to invest, while interest rates were relatively low and other loan terms were quite flexible. Asset management firms were attractive leveraged buyout candidates because their fees based on assets produced steady streams of cash to pay off debt. And a rising stock market meant that the prospects for asset management firms were only brightening.
Closing Years of the Decade
Merger and acquisition activity at the end of the decade was largely driven by forces external to the fund industry. Many corporate owners of mutual fund management companies were forced to sell their healthy asset management subsidiaries when trouble surfaced at the parent company. For Marsh McLennan, the problem took the form of accusations of bid rigging in its insurance brokerage operations; the solution was to sell mutual fund manager Putnam Investments to Great-West Life of Canada.
In more cases, however, the external force driving the sales was the credit crisis. After it was rescued by the U.S. government in 2008, AIG sold its asset management units (along with other businesses) to raise needed capital, while Lincoln National sold its Delaware Management unit to Australia’s Macquarie Group for the same reason. Lehman Brothers, after filing for bankruptcy, sold Neuberger Berman to the latter’s management group. To help raise money to pay back the federal government’s capital contribution, Bank of America sold Columbia Management to Ameriprise. In a successful effort to obviate the need for a capital contribution from the U.K. government, Barclays sold its U.S. fund manager to BlackRock.
In essence, the deals at the end of the decade reversed much of the effect of the deals at the beginning of the decade. In that earlier period, non–asset managers such as banks and insurers bought mutual fund managers to diversify their revenue base. However, after the credit crisis, some banks, brokers, and insurers were forced to sell their mutual fund operations back to firms dedicated solely to asset management. If there was one big theme to the M&A activity in the past 10 years, it is that a strong focus on asset management is the best route to success in the mutual fund world.
The Impact
Many diversified financial firms have not realized the benefits they anticipated when they purchased an asset manager. They expected that they would be able to package together the asset manager’s mutual funds with traditional banking and insurance services to sell to their high net worth customers. In this age of open architecture, however, high net worth customers want the best products regardless of source, and regulators monitor closely any potential conflicts of interest. As a result, diversified firms have not seen the hoped-for revenue synergies that were often used to justify a high purchase price for an asset manager.
These firms often find that they are uncomfortable with the volatility of investment performance, which is not very predictable and can vary significantly with market movements. Yet most diversified financial firms are public companies that report results to its shareholders every three months. Asset management is a more comfortable business for private firms owned by professionals that are better prepared for the ups and downs of the securities markets.
The benefits of dedication to asset management can be seen in the fund family rankings in Table 15.4. Two of the largest acquirers—BlackRock and Legg Mason—are investment-focused firms that climbed up quickly in the rankings when they bought fund complexes from brokerage firms. Other dedicated asset managers, including firms such as Franklin Templeton and T. Rowe Price, gradually expanded their market share. In contrast, the only route to the top of the fund rankings for more diversified financial firms, including J.P. Morgan, Bank of New York Mellon, and Goldman Sachs, was by concentrating on managing money market funds for institutional investors.
The benefit of focus was most evident in the three firms that have topped the charts—Fidelity, Vanguard, and Capital Research—whose combined market share rose from 25 percent to over 32 percent during the last decade. All three are dedicated asset managers, and their increase in market share was entirely the result of internal growth rather than of acquisitions. Another thing they have in common: all three of these managers are essentially run as private partnerships. Based on this small sample, the most effective organizational structure for asset managers seem to be as stand-alone entities, without public shareholders, with a long-term dedication to asset management.
In contrast, diversified financial firms often have trouble retaining the investment management professionals who are key to the success of any asset manager firm. These firms usually have an elaborate budgeting process with many formal processes for approval—a bureaucratic approach that doesn’t sit well with fund executives—they want to run a semi-autonomous unit with the informal culture that tends to be correlated with investment success. Diversified firms can find it hard to pay portfolio managers at competitive rates, especially when the income of a star manager exceeds that of the firm’s CEO. And they may find it politically difficult to structure special compensation programs for portfolio managers that give them an equity ownership stake in the high-margin asset management unit, rather than the whole diversified firm.
The partnership format has a significant drawback, however—it can be very difficult to plan for management succession. Somehow, the upcoming generation of managers must raise money to buy out the ownership stakes of those who are retiring. Many firms find it easiest to do this by selling shares to the public. So far, the three largest fund managers have met the challenge of providing for management succession without a public offering, by using a variety of approaches. Fidelity remains largely in the hands of its founding family, while Capital Research has a structured partnership program similar to those in certain professional service or investment firms. Vanguard avoids the issue altogether—it’s owned by all the shareholders in its funds, making Vanguard a mutual mutual fund management company.
Smaller fund management partnerships facing a succession challenge have benefited from the availability of fund consolidators, publicly traded firms that have bought all or a majority of the interests of managers looking to cash out all or some of their ownership interests. “The Consolidator” discusses one firm’s approach.
THE CONSOLIDATOR
If you look through the list of asset manager M&A deals available on the web site, you’ll see one name keeps coming up: Affiliated Managers Group. AMG’s strategy is to consolidate smaller management firms under a single corporate umbrella that provides centralized services supporting broader distribution and more efficient operations. At the end of 2009, AMG had 25 money management affiliates responsible for over $250 billion in assets.
The secret to AMG’s success? It buys only 51 to 70 percent of an established money management firm, leaving the rest of the ownership in the hands of the key employees who continue to manage their firms independently. This substantial ownership stake gives these employees plenty of reward for building the firm’s business.
In adopting this approach, AMG learned from the mistakes of United Asset Management, which pursued a similar consolidation strategy in the 1990s. UAM generally acquired 100 percent ownership of its affiliate companies—which meant that the individuals who manage money for the acquired firm, who were often the firm’s founders, didn’t have much incentive to stay with the firm after the buyout and continue to grow revenues. Once they departed, the acquired firms often floundered. UAM strategy was not successful, and it was eventually acquired itself in 2000.
In the final analysis, successful fund managers must foster a culture that attracts and retains top investment professionals throughout the market cycle. The value of a fund franchise depends heavily on these professionals who are extremely mobile. Partnership-type firms focused on asset management have generally found fewer obstacles in structuring compensation programs and creating work environments that enable talented investors to do their best work for shareholders.
CHAPTER SUMMARY
Shareholders pay various charges when they invest through a mutual fund. These fees fall into five categories: distribution charges, securities transaction costs, shareholder transaction fees, fund services charges, and the management fee. Fund expenses can have a significant impact on shareholder returns, especially when compounded over time. The SEC requires detailed disclosure of these charges.
The management fee is usually the largest component of a fund’s ongoing expenses. It compensates the management company for providing investment management services, for the use of its brand name, for taking the risk of setting up the fund and for organizing its distribution. It varies based on the type of assets the fund invests in. The management fee is the principal source of the management company’s profitability.
Historically, management companies have been quite profitable. Critics of the industry suggest that this is because management fees are too high. They believe that shareholders do not get sufficient benefit from economies of scale, that mutual fund investors pay more than other types of investors and that the market for mutual funds is noncompetitive. Industry defenders argue that fees do decline with assets, that mutual funds pay similar fees for similar services, and that the industry is highly competitive. They note that market shares within the industry are not particularly concentrated, as measured by the Herfindahl-Hirschman Index, and that there are many new entrants through start-ups and acquisitions.
There has been considerable merger and acquisition activity in the mutual fund industry over the past decade. Both the volume of these transactions and their pricing vary with market conditions. At the beginning of the past decade, many of the deals involved European firms acquiring U.S. asset managers in cross-border transactions. U.S. managers also bought asset managers with expertise working with high net worth customers. In the middle of the decade, mutual fund management firms acquired the proprietary fund businesses of brokerage firms that chose to concentrate on distribution. Insurance companies were also significant acquirers in this period, and there were several leveraged buyout transactions as well. Much of the acquisition activity toward the end of the decade was the result of the financial stress caused by the credit crisis. Many of these deals reversed the activity that took place near the beginning of the decade.
Acquisitions allow firms to rapidly increase market share. The largest fund management companies, however, increased market share entirely through internal growth. These firms are dedicated asset managers that are essentially run as private partnerships. In contrast, diversified financial firms have often not realized the benefits they anticipated when they purchased an asset manager, partly because star managers do not like to work for large conglomerates and partly because clients prefer nonproprietary funds in an age of open architecture.