Chapter 5
Portfolio Management of Stock Funds
For many, the capstone of the investment process is the management of stock funds. The performance of these funds often garners headlines—soaring when the business news is good and dropping in times of financial crisis. While their average returns are usually strong—at least when looked at over the long term—stock funds can show significant losses in any single period.
If stock fund returns are volatile, that’s because the stocks they own participate directly in the ups and downs of the economy. Buy a stock, and you’re buying a proportional share, or an equity stake, in a company. (The terms stock, share, and equity are used interchangeably.1) Own 100 shares in a company that has 10,000 shares in total outstanding, and you own rights to 1 percent of that firm’s assets and 1 percent of its profits. If the company does well, whether because of a booming economy or astute management decisions or a favorable regulatory environment, you as an investor do well, too.
Ownership of stock carries voting rights. Shareholders are empowered to elect a board of directors; in turn, the board hires the firm’s top executives and oversees its business. Shareholders also vote on other significant matters, such as the implementation of a stock option plan or a merger proposal. (Chapter 9 has a detailed discussion of shareholder voting.)
Most firms sell their stocks to the public—after having registered the securities offering and filed a prospectus with the SEC, of course—usually with the help of an investment bank.2 After the offering is completed, investors may then buy and sell the shares with each other, in what is known as the secondary market.3 The first time a company issues stock is called an initial public offering, or IPO. (Chapter 8 covers secondary market trading in detail.)
Stockholders can make money from an investment in stocks in two ways. First, the company may pay out a portion of its earnings to shareholders in the form of dividends. These payments are made at the discretion of the company’s board of directors and may be eliminated if business conditions deteriorate. Even in good times, many companies prefer to retain their earnings and reinvest them in the business rather than pay dividends. For U.S. stocks, dividend income has historically been a less important component of return.
As a result, stockholders normally own shares for their capital appreciation potential, which is the chance that the price of the shares will increase in value. That’s likely to happen if the firm’s business improves and if investors are optimistic about its prospects. Over time, stock price performance tends to reflect the company’s underlying business performance. Business fundamentals and stock price trends, however, can diverge, often significantly and sometimes for extended periods.
The key to managing a stock fund is to recognize when these divergences occur for particular stocks—while monitoring the overall risk of a portfolio composed of many individual investments. Simple in theory, though extremely difficult in practice.
This chapter reviews:
- The different approaches to researching stocks as potential investments
- The techniques used in managing a stock fund
STOCK RESEARCH
The equity investment process begins with research: analyzing the relationship between a company’s business and its stock price. There are many different research techniques, but most fall into one of three categories: fundamental analysis, quantitative analysis, and technical analysis. Professional investors usually focus on one methodology, although they may incorporate some elements of all three in their research. (Note that these general approaches apply to all types of investments, not just stocks.)
- Fundamental analysis. Fundamental analysts rate stocks based on their evaluation of a company’s business prospects. They examine its operations and finances, gathering information that will help them estimate its future earnings. Their sources include the firm’s financial statements and other filings with the SEC, interviews with company management and industry sources, including trade journals and reports from competitors. Direct observation plays a role, too. Fundamental analysts will visit the company they are studying and even use its products and services if at all possible. The process involves one industry or even one stock at a time.
- Quantitative analysis. In contrast, quantitative analysts examine large groups of stocks. They work with probabilities, wanting to know whether particular business characteristics or trends are more or less likely to result in superior returns. To confirm their hypotheses, quantitative analysts use computers loaded with vast amounts of data on factors such as a company’s earnings growth, its return on capital and the price momentum of its stock.
- Technical analysis. Technical analysts believe that stock price movements follow certain patterns, reflecting the predictable irrationality of investor behavior. They study charts of stock prices and trading volumes to develop investment recommendations, looking for changes in trends that signal that the price has reached an inflection point. They watch for stocks that have breached an important resistance level on the upside—or support level on the downside—and have begun to trade in a new range.
FIGURE 5.1 Technical Analysis in Action
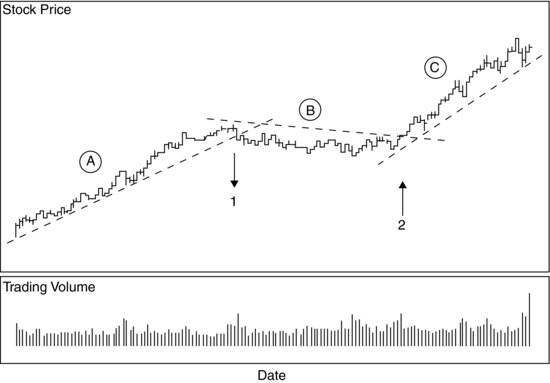
For example, a technical analyst looking at the chart in Figure 5.1 would see a stock that traded in an uptrend in period A, rising to about six times its original value, then meandered around in period B, not doing much of anything. It then broke out on the upside, for a four-fold increase in period C. A technical analyst would explain that the shifts in trend were visible at the time, because they were accompanied by substantial increases in trading volumes at points 1 and 2.4
Despite its intuitive appeal, technical analysis has many detractors, especially among equity investors.5 Academic researchers have raised serious questions about the value of technical research in selecting stocks. As a result, many fund managers today do not have dedicated technical analysts on their staffs, though individual analysts and portfolio managers may use technical analysis to determine the right time to buy or sell a stock.
Therefore, we will focus only on fundamental and quantitative research, the most important types of securities analysis for the majority of mutual fund managers. See the “Career Track” box for more on the job of the equity research analyst.
CAREER TRACK: STOCK ANALYST
Interested in becoming a stock analyst? You might work directly for a fund management company. Most larger fund managers have in-house analysts who produce proprietary research for the exclusive use of their own funds. This is referred to as buy-side research, since the managers buy stocks for their clients’ funds.
Or you could work for an independent research firm that provides your ideas to the buy side for a fee. Or you might be employed by a broker-dealer on what’s casually referred to as the sell-side, or the Street—short for Wall Street, naturally. You’ll supply your research reports to clients who hire your firm to execute trades or provide other services.
Longevity counts in equity research. Analysts often follow, or cover, the same industry for years, building in-depth expertise. But for those interested in becoming a portfolio manager, researching several different industries over time is a great place to start. In fact, most equity portfolio managers began their investment career as analysts.
Equity research is a multifaceted job. You’ll be judged not just on the success of your recommendations but also on your ability to persuade others to buy them, especially if you work on the sell side. Writing research reports and talking with fund managers about your ideas will be a large part of your job.
Fundamental Research
Fundamental equity research evaluates a company’s prospects, looking at its competitive position within its industry, as well as the outlook for the industry as a whole. Analysts aren’t just looking for facts; they’re looking for something that will help them stand out from the crowd, either a little-known relationship or an unusual interpretation of very public information. Remember from the last chapter that markets are very efficient, so that common knowledge is already reflected in the stock price. To find stocks that stand out, analysts must take positions that defy conventional wisdom.
Analysts gather the information they need to make those assessments from three primary sources: the company itself, industry experts, and other analysts. Let’s look at how analysts use each to develop an opinion on a stock.
Information from the company itself. As with a mutual fund, a wealth of information about an operating company comes from the documents that it’s required to file with the SEC. Analysts often start the research process by reviewing these filings.
- 10-K. The annual report—usually called a 10-K after the SEC form it must be filed on—provides an overview of the company’s business and describes the risks it faces. Like a mutual fund annual report, the 10-K includes a letter from management discussing results over the past year, together with the company’s audited financial statements. The analysts will examine the numbers closely, looking for trends in profitability to see if business conditions are getting better or worse. And they’ll read the footnotes carefully to gauge whether a company’s reported earnings give a good sense of underlying business reality. That’s not a given, because some companies take advantage of flexibility in accounting rules to boost their short-term results. Analysts try to avoid companies with a poor quality of earnings, as it’s called, since academic research has demonstrated that they tend to have relatively weak performance in the future.6
- 10-Qs. The quarterly reports, or 10-Qs, give analysts updates on results during the year. The components of the 10-Qs are similar to those of the 10-K, although they are less detailed. The financial information they contain is not audited. Both the 10-Ks and 10-Qs are available on-line, through the company’s web site or the SEC’s EDGAR database.
- Proxy statement. Companies must prepare a proxy statement before the annual shareholder vote. In addition to describing the issues being presented to shareholders, the proxy statement contains detailed information about a company’s management and board of directors, including their compensation. Analysts use this information to evaluate the qualifications of the management team and to determine whether its interests are aligned with shareholders’.
- Prospectus. The prospectus is prepared whenever a company sells its shares to the public. It’s especially important for IPOs, since it’s the first complete description of the company available to the public.
But analysts are not content with hearing from company management through documents; they want to talk with them directly. They’ll attend presentations given by the company—in person, on the phone, or by webcast—and, if at all possible, they’ll arrange to meet with the CEO one on one. And they won’t just listen—they’ll ask questions about recent performance and future strategy. Throughout, they’ll be judging the reasonableness of the company’s approach and the capabilities of its management team.
FAIR DISCLOSURE
The owner of a single share of stock is entitled to the same information from company management as the owner of one million shares. So says the SEC, a principle it has solidified in Regulation Fair Disclosure, known as Reg FD, issued in October 2000.
Q: What does Reg FD say?
A: When a company discloses to any person information that would likely be material to most investors, it must make that same information available to the public.
Q: Why did the SEC issue this rule?
A: During the booming stock market of the late 1990s, the press reported several instances of companies releasing the inside scoop to large investors first; these large investors were then able to profit on the information at the expense of individual stockholders—who were kept in the dark until the stock price had already moved. The SEC became concerned that this practice could undermine investor confidence in the markets and be used by company managements to reward analysts for making favorable recommendations. The SEC wanted to make it clear that a selective release of information was just as serious a violation as insider trading.
Q: How have companies responded to the rule?
A: Almost all companies now make significant announcements, such as reports on quarterly earnings, in a public forum. This is usually done by holding a conference call or webinar that is open to all shareholders and maybe even the public at large. The company will also simultaneously issue a press release with the news.
Information from the company is a necessary—but not sufficient—component of the research process. That’s because analysts can’t get much of a competitive advantage from communications with management. As “Fair Disclosure” explains, companies must provide the same material information to all investors—who now have easy access to it over the Internet. That’s a significant change from even a decade ago, when company documents were much harder to obtain, and investors who wanted to hear a company management had to travel to do so. In that environment, professional investors—who had the resources to track down information—had a bigger edge.
Insights from industry sources. To get information that is not available to the public at large, analysts must turn to other sources within the industry. They’ll read the trade publications, and they’ll consult with industry experts. In fact, some analysts have once worked in the industry they now cover, so that they have an insider’s view of its trends and prospects.
Whenever possible, analysts will go directly to the users of the company’s products and services to assess the outlook for future sales. They might do this systematically through a survey—asking doctors whether they plan to prescribe a new drug, for example—or anecdotally by talking with a small user group. And, if possible, they’ll be a consumer themselves, tasting a food company’s new line of soups or taking their family to shop at a remodeled retail store.
Research from other analysts. But are the insights gleaned really unique? To answer that question, analysts must be familiar with the general opinion of the company and its stock. They’ll read the coverage of the company in the press. They’ll talk with analysts at both independent shops and sell-side firms and read their research reports.
Fundamental analysts must then turn this carefully gathered information into numbers. First, they estimate earnings and cash flow per share using a model, which is a quantitative representation of a company’s operations, typically created in a computer spreadsheet. The analyst populates the model with estimates of the company’s revenue, expenses, margins, growth rates, and other key variables, separated into key product lines or geographic areas.
A model serves two important purposes: it allows an analyst to forecast a company’s earnings, the primary driver of stock price performance, and it provides a framework to evaluate new information about the company. Suppose an analyst reads that the European Union is considering the adoption of stringent standards regarding the disposal of electronic equipment. Two proposals have been floated—one imposing a sales tax to cover the costs of municipal recycling, another requiring manufacturers to arrange for recycling of all of their own equipment. The former would raise prices and, therefore, potentially push down demand, while the latter could significantly increase manufacturers’ costs. An analyst following a global manufacturer of PCs could estimate the impact of the different regulations by adjusting the model to see what would happen to the firm’s operating results in either scenario. A well-constructed model allows an analyst to quickly test a variety of assumptions and scenarios.
FUNDAMENTAL RESEARCH IN ACTION
Behind every fund success story is a good research idea. For proof, look no further than the following quotations from the annual shareholder reports for three top-performing funds in 2009. All three discuss the fund’s best stock pick during the year:
“ASML, the world’s leading provider of lithography systems for the semiconductor industry, was among the Fund’s top contributors during the year. Despite a difficult business environment, a recent sales rebound and improved cost trends have returned the company to profitability.”7
“Communications tower company Crown Castle International provided the Fund’s largest gains…. We had added to holdings in Crown Castle during the credit crunch in the late 2008, correctly believing in the company’s business model and its ability to service a fairly large debt load.”8
“Our holdings in Apple were especially beneficial, as the company continued to generate impressive revenue growth and better-than-expected earnings thanks to record sales for Mac computers and iPhones.”9
Note the common theme: in each case the investment team had identified something about the company that other investors had failed to appreciate—sales did well despite the weak environment, the debt load proved manageable, earnings were “better than expected.” This ability to see beyond the consensus is the key to successful stock selection.
Analysts will compare the earnings estimate from their model to consensus earnings, which is the average or median of the earnings predicted by Wall Street analysts. It’s available through Thomson Reuters First Call or Zacks Investment Research.
If the model-generated earnings estimate is significantly different from the consensus, there is potential for an earnings surprise—a positive earnings surprise if the estimate exceeds consensus, and a negative earnings surprise if it falls short. Earnings surprises can be powerful drivers of stock price performance. That’s partly because it’s rare to see just one earnings surprise at a company—one Wall Street analyst compared them to cockroaches for that reason. Instead, companies will tend to do better—or worse—than the consensus expects for several quarters in a row. As a result, analysts will usually place a buy or sell opinion on a stock whenever they believe there will be an earnings surprise. “Fundamental Research in Action” gives some real-life examples of analysis identifying earnings surprises.
Valuation
While in many instances a model will not predict an earnings surprise, an analyst may still recommend a stock based on its valuation. Let’s review a few of the measures used in valuing stocks. Because all are ratios of stock price to another factor, valuation work using these measures is called ratio analysis:
- Price/earnings or P/E ratio. The P/E ratio, also known as the P/E multiple, is the price of a share of stock divided by its earnings per share—sometimes the earnings most recently reported, sometimes those estimated for the future. This ratio gives an indication of how much investors are willing to pay for a company’s earning power. The higher the multiple, the more expensive the stock.
Stocks are often classified by their P/E ratio. Those with a high P/E ratio—which can be 30 or 40 times earnings or more—are usually young or fast-growing companies, while those with a low P/E—generally under 10 times—are typically low-growth or in mature industries. The stocks of companies that have experienced problems recently often have a low P/E. - Price/cash flow ratio. The price to cash flow ratio equals stock price divided by cash flow per share, which is usually defined as net income plus depreciation and other noncash expenses, all on a per-share basis. P/CF is often used to supplement P/E as a valuation measure, since cash flow is less subject to accounting distortions than are earnings. It’s particularly important in industries that have recently spent considerable amounts on plant and equipment and have high depreciation charges as a result.
- Price/book ratio. Price to book also uses stock price in the numerator, but here the denominator is book value, meaning the company’s assets minus its liabilities per share. If a company has a relatively high P/B, investors are signaling that they see more profit potential than the hard assets on the company’s books would suggest. For example, a software company with a high P/B ratio may not own any physical assets—other than a few servers—but may still have fabulous prospects. Conversely, if a company has a relatively low P/B, its hard assets may not have good prospects of generating future earnings. A typical low P/B company is a manufacturer that has an enormous factory, but one churning out products that have lost their competitive edge.
- Price/sales ratio. In this ratio, price is divided by sales per share. P/S can be particularly useful in looking at stocks in cyclical industries that are extremely sensitive to the ups and downs of the economy. Because sales are relatively easy to count, P/S is less sensitive to accounting policies than the other measures we’ve discussed so far.
- Dividend yield is the annual dividend of a stock divided by its market price. Yield represents the cash return of a stock, as measured by dividends. For example, a stock selling for $50 per share that pays an annual dividend of $1 has a dividend yield of 2 percent ($l divided by $50). In contrast with the ratios we’ve just discussed, stocks with higher dividend yields are considered cheaper than stocks with lower yields. As a general rule, low P/E stocks have higher dividend yields than high P/E stocks, which may pay no dividends at all.
Analysts look at all of these measures within the context of their assessment of a company’s prospects. A stock may be undervalued even at 40 times earnings if its outlook is extremely promising. On the other hand, a stock with a P/E of 8 times might be too expensive if its business is rapidly deteriorating.
Much of the debate about individual stocks comes down to valuation. Take the case of Amazon.com, which has often sported a P/E ratio north of 50 times. Its proponents justify the lofty valuations by pointing to the company’s strong and steady growth—growth that they believe is likely to continue because of Amazon’s dominance in online retailing. Critics counter that a lower multiple is warranted, because the larger Amazon gets, the harder it will be to grow at the same rate. And a bigger Amazon will be more vulnerable to economic downturns, competitive threats, and increased regulation. Shoppers online may even have to start paying sales taxes one day, the naysayers note. Overall, the doubters argue, Amazon is “priced to perfection,” meaning that its value will fall dramatically should business conditions prove anything less than ideal.
Analysts don’t look at the valuation of a stock in isolation. Instead, they study a stock’s valuation over time relative to other stocks in the same industry and then look at the industry’s valuation relative to that of the market as a whole. This approach is called relative valuation.
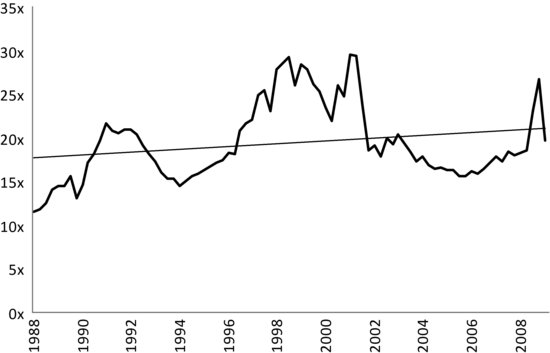
Relative valuation makes sense because the valuation levels for the overall equity market have fluctuated significantly through time. Figure 5.2 shows how widely the valuation level of the S&P 500 has ranged around a rising trend line over just the past 20 years. Three factors in particularly influence the overall level of equity market valuation: economic strength, interest rates, and investor sentiment.
FIGURE 5.2 S&P P/E Ratio on Operating Earnings
Source: Standard & Poor’s. Standard & Poor’s Financial Services LLC is a wholly-owned subsidiary of The McGraw-Hill Companies, Inc. All rights reserved. STANDARD & POOR’S, S&P, and S&P 500 are registered trademarks of Standard & Poor’s Financial Services LLC.
Analysts will even assess the valuation of the overall market, taking into consideration the strength of the overall economy, the direction of interest rates, and the mood of investors.
Economic strength. The value of the stock market as a whole equals the present value of all the constituent firms’ earnings combined. If investors’ expectations for earnings growth increase, so too will prices and valuations. As a result, in strong economic times, with estimates of growth rates rising for many companies, the P/E ratios for both individual stocks and market indexes tend to increase.
Interest rates. Rising interest rates tend to depress equity valuations. Because higher rates make it more expensive for companies to borrow money, they can slow down the economy enough to put future earnings growth in doubt. Also, rising rates can signal higher inflation ahead—another scenario that can often lead to lower earnings growth, because companies often find it hard to raise prices to their customers as quickly as prices of raw materials are rising. Adding insult to injury, higher rates mean higher yields on bank deposits and fixed income securities, making them more attractive as alternatives to equities. Conversely, declining interest rates tend to support higher equity valuations.
Investor sentiment. Psychology plays a role in setting equity valuations. If the economy and the political scene are stable, investors perceive risk to be low and are willing to pay more for stocks. When fear reigns, however, P/Es can come down quite quickly. Notice how in Figure 5.2 the market’s P/E plunged when the Internet bubble popped, from over 29 times at the end of 2001 to less than 19 times just nine9 months later.
Because the irrationality of investor sentiment can have such a dramatic effect on market valuations, many analysts reject the relative valuation approach altogether. Instead, they prefer to use dividend discount models and other discounted cash flow approaches. Analysts use these techniques to project dividends and cash flows into the future, then compute the present value of those payments. If a stock’s price is significantly below the value calculated, it’s a buy. While these models have strong adherents, other analysts reject them as too dependent on future projections and, therefore, less reliable than relative valuation, which is largely observable currently.
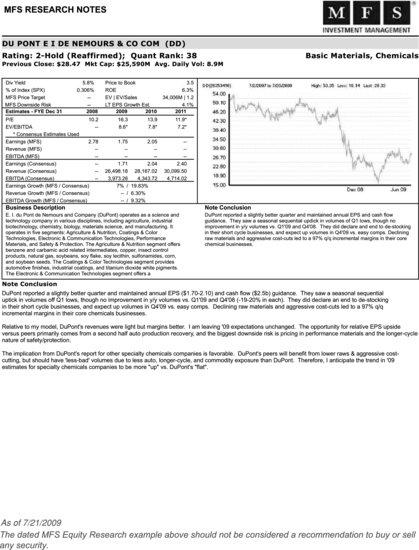
Analysts update their opinions as stock prices move and as news is released. Figure 5.3 provides an actual example of a quarterly update.
FIGURE 5.3 An Actual Research Update
Quantitative Research
While fundamental analysis zeroes in on individual companies, quantitative research looks for patterns affecting many stocks at once. Quantitative analysts—fondly known as quants—all use the same general process:
- Hypothesis. Quants always start with a hypothesis, a theory of what determines stock performance. A simple hypothesis might be that the stock of companies whose CEOs have doctoral degrees do better than average.
- Data for modeling. The analyst then identifies sources for data to rigorously test this hypothesis for a large number of companies. Sometimes this is easy. In this hypothetical example, data on U.S. stock returns are readily available. But other data are not so easy to come by—such as information on the doctoral degrees of company CEOs. The theoretical quant might need to approximate the information sought, by screening CEO names for the title Dr., broadening the test to include both medical doctors and PhDs. Or at larger investment advisers, the fundamental research analysts may be asked to provide the data for the companies they cover.
- Back testing. The test will divide the universe of stocks into two halves: companies with CEOs with doctoral degrees and those without. It will calculate the average stock price gain in the past for each group; because the test uses historical return data, it is called a back test. To help with the analysis in the next step, quants will test different time periods and break down the results by industry.
- Analyze results. The results of the back test allow the analyst to judge if the hypothesis worked: Did the stocks of companies with CEOs with doctoral degrees do better than the average stock? Whatever the answer, quants will look for patterns in the results. For example, if a large percentage of the CEOs of biotech companies have PhDs and biotech stocks have done extremely well recently, results could suggest—incorrectly—that buying stocks with a “Dr. CEO” is an easy way to make money.
If that’s the case, the quant will look to see whether the hypothesis works within industries, as well as for the market as a whole. Another avenue to explore is whether the hypothesis works better in some market conditions than in others. For example, do companies with PhDs at the helm surge ahead when the market is rising, and investors may be willing to pay more for products with a high technology content? Or do they do better when the market is falling, and investors take refuge in firms that are more likely to hold lots of patents? - Implementation. Once quantitative analysts have drawn a conclusion about the validity of a particular hypothesis, they will continue to monitor its performance in the future, since a theory that worked in a back test may not continue to work prospectively.
Where quants have an advantage is in their dispassionate approach to investing—the application of tested models in a disciplined fashion. They may thus avoid some of the predictable pitfalls that have been analyzed by behavioral finance.
PUTTING IT ALL TOGETHER: MANAGING A STOCK FUND
Once the analysis has been completed, the individual stock ideas are combined into a fund. This is the job of the portfolio manager (discussed in more detail in the “Career Track” box). There are two main approaches to portfolio management: passive management and active management. The contrasts between the two are starkest in stock investing, where the differences in returns, risks, and costs can be quite dramatic. While we reviewed the debate about which approach is better in Chapter 4, we discuss here the process of managing both types of portfolios. We take a quick look at passively managed, or index funds, and then turn our attention to actively managed portfolios.
CAREER TRACK: STOCK PORTFOLIO MANAGER
If you’re an equity portfolio manager, you have a job that carries a high level of responsibility. You’re helping to ensure the financial well-being of hundreds—if not thousands—of investors.
It’s a stressful job. The results of your work are measured constantly—even posted online every day if you’re in charge of a mutual fund. Your returns will be stacked up against your competitors’ monthly, quarterly, and yearly.
You may carry the responsibility on your own as the sole manager. Or you may work as part of a portfolio team and be in charge of a portion of a fund—often referred to as a sleeve—possibly in an area in which you have particular expertise. For example, you might make decisions about a fund’s cyclically sensitive sleeve, while another team member handles the consumer sectors and yet a third manages the financial exposure. Whether working on your own or as part of group, you’ll be in constant contact with the analysts to discuss trends at companies and industries.
Passive Portfolio Management
In passive portfolio management, the objective is simply to match the return of a stock market index. As we’ve learned, an index is a hypothetical portfolio of stocks designed to represent the market as a whole or a segment of it. These hypothetical portfolios are maintained by independent research firms that calculate their value daily. In the U.S. equity world, prominent providers of indexes include Standard & Poor’s, Russell Investments, and Wilshire Associates.
Passive managers try to minimize tracking error, meaning the deviation of the fund’s return from the return of the index. For many equity indexes, including the S&P 500—which, as its names suggests, contains 500 stocks—this is normally done by purchasing all of the component securities of the index in those same proportions in the fund, a practice known as replication.
But some indexes contain such a large number of stocks that replication is impracticable. An example is the Wilshire 5000, which includes more than 4,000 stocks. In those cases, passive managers may purchase only a representative subset of stocks in the index, in a practice known as sampling. Through quantitative modeling, they can assemble a basket of securities whose risk profile approximates that of the index. That means that its return should also approximate that of the index most of the time, though there’s no guarantee of that. Performance of a passively managed fund using sampling can differ significantly from that of the index, especially when there’s a high degree of volatility in the market or in key stocks.
Although an index fund manager does not make active investment decisions on individual stocks, most index funds must still trade each day in response to shareholder activity. The manager must buy securities in the index when shareholders purchase shares of the fund and must sell securities in the index as shareholders redeem—while keeping the fund closely aligned with its index. One key to minimizing the impact of shareholder cash flows on tracking error is to have good advance information about the magnitude and direction of the transactions. Most fund complexes have sophisticated cash management systems that monitor pending shareholder activity during the day.
Once funds have accurate information on the cash coming in or out, they use various techniques to minimize the cost of investing inflows or of selling stocks to meet outflows. They may buy or sell stock index futures contracts rather than trading in the stocks themselves. Or they might engage in a basket trade, which we describe in Chapter 8. Or they might establish a relationship with an investor who agrees to trade stocks for cash or cash for stocks in what is called an in-kind exchange. Exchange-traded funds use a similar technique for managing cash flows, as we see in Chapter 12.
Another big headache for an index fund manager is a change in the composition of the index itself. Whether because of a merger, bankruptcy, or a desire by the index provider to include a more representative security, index changes are common. The Russell indexes, for example, are ordinarily rebalanced annually at the end of June. When that happens, hundreds of stocks can move in and out of the Russell 2000, one of the most popular indexes measuring the performance of small-capitalization stocks. Even the most widely used index, the S&P 500, has a surprising number of changes in a year, as shown in Table 5.1.
TABLE 5.1 Changes to the S&P 500 Index Constituents in 2009
Source: Standard & Poor’s.
Index fund managers must decide whether to buy stocks in advance of their inclusion in the index or whether to wait for the changes to be finalized. Acting early can save the fund some money: stocks that are to be included in the S&P 500 index, in particular, tend to do well in the period leading up to their addition to the index.10 But the strategy of buying in advance can be dangerous, since there might be some bad news that causes a stock’s price to tumble down before it officially becomes part of the index.
Active Portfolio Management
Active management seeks to beat the return of an index through insightful security selection. Industry insiders often call this generating positive alpha. (See “Endlessly Seeking Alpha” for an explanation of this terminology.) It’s the portfolio manager of an actively managed fund who oversees the selection process: evaluating which ideas generated by the research team should be included in a portfolio, assigning them a weighting, and then making the call on when precisely to buy or sell.
ENDLESSLY SEEKING ALPHA
Another way of saying that active managers are looking to beat the return of the market is to say that they’re looking to generate positive alpha. Remember from Chapter 1 that returns from investments can be broken down into two components: beta and alpha. A quick refresher: beta is the return of the market as a whole. An index fund, which seeks to match the return of the market, provides only beta. Alpha is the difference between the market return and the return on the portfolio investments.11 The return of a fund will have alpha whenever its portfolio varies from the index—in other words, whenever the manager makes active investment decisions.
Of course, managers always prefer that a fund’s return be higher—rather than lower—than the index return. In other words, they want positive—and not negative—alpha. Outperform is another term for the same happy result; managers want to avoid underperforming.
Some managers take the concept even further. They aim to give their clients only alpha return—the return that comes from their investment decision making—and eliminate all the beta return. (This is one of the absolute return strategies that we reviewed in Chapter 4.) To accomplish both objectives, they create a long-short portfolio. In brief, the manager buys a long portfolio of stocks and at the same time sells short another portfolio of stocks of equal value. The positive beta on the long portfolio and the negative beta on the short portfolio should cancel each other out, theoretically leaving only alpha exposure. The popularity of long-short portfolios has been increasing.
For regulatory reasons, the long-short approach is easier to implement in hedge funds than in mutual funds. We go into detail when we review hedge funds in Chapter 12.
Investors who want to own a general equity fund—as opposed to a fund that focuses in a specific industry or sector—often look for portfolios that concentrate in a particular type of stock usually evaluated along two dimensions: market capitalization, or market cap and style. As we saw in Chapter 4, market cap equals the value of a company’s outstanding stock. Let’s take a closer look at style now.
A style is a framework for choosing investments, essentially a set of rules that help an investor determine whether a stock fits in a portfolio. Because a style is a disciplined approach to investment decision making, most professional investors use one. The most common styles are growth, value, and growth at a reasonable price.
- Growth managers look for companies that are expected to have higher-than-average earnings growth in the future, usually because revenue—or top line—growth is strong. They are the luxury goods shoppers of the investment world; they are willing to pay high prices for companies with premium products or brand names. Because growth stocks often come with high multiples, they can be very sensitive to downturns in the market. As a result, this style tends to do best later in the economic cycle when growth is particularly strong.
- Value managers, on the other hand, are shoppers who hunt for bargains, looking for companies with low multiples and high dividend yields. They understand that the merchandise might be slightly damaged, but they believe that, even if it’s irregular, the company will still generate enough in earnings to more than justify the price paid. Value managers seek out companies on the rebound, whether from a tough economic environment or bad management decisions or both, so it’s no surprise that this style often outperforms when the economy itself is recovering from a recession. Through their research, value managers try to dodge the dreaded value trap: companies that have cheap stocks but also have businesses that are going from bad to worse.
- Growth at a reasonable price managers—also known as GARP, or relative value managers—want the best of both worlds. They’re looking for stocks with decent growth prospects that aren’t extremely expensive.
Portfolio managers often categorize their style along a third dimension as well: top-down versus bottom-up.
- Top-down managers form a big picture, or macro, view of the economy and financial markets and use that as a basis for identifying attractive sectors, industries, and securities. (Remember from Chapter 4 that a sector is a group of related industries.) For example, a top-down manager who expects that economic growth is slowing may sell holdings in cyclical industries like autos that are very sensitive to the ups and downs, or cycles, in the economy. She may buy companies in the consumer and health care sectors instead. Because the manager looks at individual stocks only after the big picture decisions are made, this approach is often associated with sector rotation. Many growth managers incorporate top-down elements into their styles.
- Bottom-up managers, in contrast, begin with the selection of individual securities. They choose securities with the most attractive investment prospects, with little regard for macroeconomic forecasts. Value managers generally use a bottom-up approach.
Any of these styles can be implemented using fundamental and quantitative analysis or both. Many portfolio managers today combine the two techniques, using quantitative screens to narrow down the list of ideas for further fundamental research or monitoring overall portfolio risk with quantitative estimates of tracking error. (We review risk control in a moment.)
Portfolio Construction
Okay, you’ve just been appointed the portfolio manager of an actively managed equity mutual fund. There’s a lot you’ll need to know before you make your first buy or sell decision.
Investment objectives, style, and restrictions. First, you’ll want to read the fund’s prospectus. As we reviewed in Chapter 3, this document sets forth the fund’s investment objectives, gives a brief description of its style, and lists some important constraints that you must adhere to.
Benchmark index. Pay particular attention to the market index that is mentioned there. (You’ll see it in the table providing performance information.) This index is your benchmark, and your returns will be evaluated in relation to the returns of this index. The specific index chosen will match the objective and style of the portfolio. For example, if your portfolio primarily invests in small capitalization U.S. growth stocks, the index will represent that area of the market.
Next, you’ll study the composition of the index. Portfolio managers carefully weigh decisions to overweight or underweight a security compared to the index.12 In an overweight, the fund holds a larger position in the security—measured as a percentage of the portfolio—than that same stock’s representation in the index. Avoiding a stock entirely or holding a relatively small position is an underweight and can be just as risky as holding a large overweight in another stock—because if the absent stock turns out to be one of the stronger performers, it can cause the fund to lag the index. Yet another type of decision is to hold a security not included in the index. This is called an out-of-benchmark position.
Let’s assume that Windy Corner stock is the largest position in the S&P 500 with a 3 percent weight. Let’s also assume that your outlook for the company is quite positive—that you expect earnings to grow significantly. If your analysis is correct, you’ll need to have more than 3 percent of the fund invested in Windy Corner for you to gain ground on the index. Concerned about Windy Corner’s future? You’ll want to put less than 3 percent of assets into the stock. If you’re very negative, you won’t own the stock at all. But if you just believe that the stock will tread water, you might decide to limit your risk versus the index by buying a 2 percent position. So, it may be that a stock that you have a poor opinion of may still appear as a significant holding in your fund.
The key point is that all weightings are evaluated in relation to the index weightings. Check the math yourself: a 1 percent position in an out-of-benchmark stock will have the same impact on performance relative to the index as a 4 percent position in Windy Corner.
Just as fund managers can over- or underweight individual stocks, they can also decide to over- or underweight a sector in an index. Table 5.2 shows the weights for the hypothetical Avon Hill U.S. Equity Fund compared to the sector weights for the S&P 500 index. As you can see, this fund is overweighted in sectors that traditionally do well when the economy is strong, including industrials, energy, and materials. It has relatively little exposure to financials and consumer staples, both sectors that usually lag when the economy rebounds. (Financial company earnings are often hurt by the interest rate increases that accompany economic recovery.) This portfolio should outperform if economic growth is robust.
TABLE 5.2 Sector Weights for the Avon Hill U.S. Equity Fund
Benchmark peer group. Finally, you’ll want to know which peer group of competing mutual funds you’ll be measured against. (See Chapter 4 for more about peer rankings.) Since you won’t have up-to-date information on the portfolios of your competitors, you can’t use their holdings as a basis for making your day-to-day weighting decisions. But you’ll want to know something about their approach to investing, so that you can understand how yours may differ and how your decisions might affect your ranking in the peer group. If you manage a growth-style fund, for example, your competitors are likely to have heavy weightings in technology stocks. Should you turn negative on technology and reduce your positions to an underweight, your performance will probably be very different from the average performance of competing funds. You’ll have a chance to shine if technology stumbles, but you could well end up falling in the rankings if technology rallies. Your peer group ranking will also play an important role in determining what you will be paid, as explained in “Relative Compensation.”
RELATIVE COMPENSATION
The benchmark index and benchmark peer group will determine more than just your portfolio’s weightings: they’ll also be the basis of your compensation as a portfolio manager. At most fund advisers, you’ll receive an attractive base salary, but you’ll stand to earn a much larger amount as an annual bonus if your fund does better than both of its benchmarks. Good performance tends to lead to strong sales of fund shares, which, in turn, leads to higher revenues, so portfolio managers try hard to produce superior fund returns.
You usually won’t get top dollar if your fund’s gains are a one-year phenomenon. Bonus calculations normally put the most weight on three-year performance and may even consider results over longer periods as well. They may also take into account your department’s performance or possibly the results of all the funds run by the firm—that’s to encourage you to share your ideas with your colleagues.
And while your bonus will be largely determined by the numbers, more subjective factors may play a role at the margin. Your compensation may be boosted somewhat if you’ve helped market the funds, recruit trainees, or mentor new analysts.
Even if you’ve earned a top bonus, don’t plan to spend it all right away. To encourage you to stay at the firm, many fund advisers defer payment of a portion of cash bonuses for one or more years. And there are other reasons why you may not consider the offer of a job from your competitor. You may have been given an ownership stake in the management company that won’t vest for some time, or you may have signed a noncompete agreement that makes it difficult for you to take clients away from your current employer.
If you want to learn more about how portfolio managers are paid, all you need do is turn to the statement of additional information for any mutual fund. The SEC requires that firms describe their compensation methodology there.
Risk Management
Up until now, your security selection decisions may have focused on maximizing potential return; but before you put in your buy or sell orders, you’ll want to make sure that the portfolio’s level of risk is appropriate for its investment objective. The risk of the overall portfolio is not simply the average of the risk of each of its component securities.
That’s because the stocks won’t always be moving in the same direction; some will be going up while others are going down. As an example, consider the relationship between oil producers and airlines. While falling oil prices will hurt the stock of the oil companies, they help airline stocks, which are big users of energy. In technical parlance, oil producers and airlines are negatively correlated. A portfolio holding stocks in just those two industries should be at least somewhat insulated from changes in the price of oil. That’s not the case if you invest in just oil producers and energy service companies, which are the firms that help producers drill for oil. These groups are positively correlated, and should track the price of oil fairly closely.
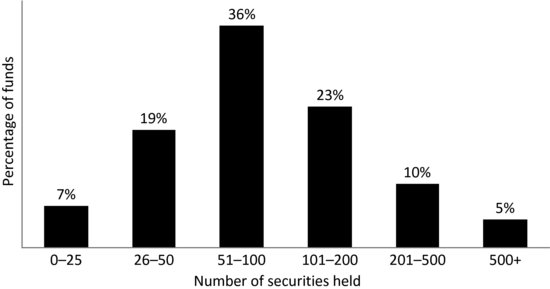
The number of stocks you hold will affect overall risk. As a general rule, the fewer stocks you hold, the riskier the fund. Most portfolio managers try to limit the number of fund holdings. That’s because managers tend to have strong convictions about a relatively small group of stocks. Also, while a large number of positions may reduce risk by increasing diversification, they can tax the ability of even the most diligent manager to keep on top of them all. As Figure 5.4 shows, in June 2010, more than a quarter of actively managed stock funds had concentrated portfolios with fewer than 50 holdings. Over half of the funds owned between 50 and 200 securities. Only a small percentage of funds held more than 200 positions.
The decision on the number of stocks in the portfolio is not just a matter of portfolio manager preference; practical considerations will play a role, too. Funds focusing on hard-to-trade securities such as small cap stocks will tend to hold more names, as will funds with a large asset base. Another consideration: fund complexes limit the percentage of the outstanding shares of a company that they will hold in all funds combined, forcing you to seek out new ideas once the maximum position has been reached. (This can easily be the case with small cap stocks.) For example, many funds groups do not want to own, in total across all funds, more than 15 percent of any company’s stock.14 Cash flows are another factor that comes into play. Steady inflows of money to a fund may compel you to look for ways to invest that cash quickly, possibly by buying more names.
To help you assess risk objectively, you’ll most likely use a computer system to calculate your expected, or ex ante, tracking error. (“Beyond Beta” provides more information on a commonly used risk assessment tool.) This system will predict the standard deviation of the differences between the portfolio return and the index return. If your portfolio is broadly diversified and includes many of the stocks in the index at close to their index weightings, its tracking error will be low. But if your portfolio is quite concentrated, holding only a few stocks from the index together with a few out-of-benchmark positions, your predicted tracking error will probably be quite high.
BEYOND BETA
As researchers in the 1970s took advantage of faster computer power to study the behavior of stocks, they discovered patterns that defied the theory behind the Efficient Market Hypothesis. They noticed that exposure to the market—the classic beta—wasn’t the only thing that made stocks move together. In fact, there were a number of common factors that influenced stock behavior to a greater or lesser extent. For example, stocks of a similar size or market capitalization all tended to go up and down at the same time, as did value stocks with low P/E and price/book ratios.
From this insight, quantitative analysts developed models that measure a portfolio’s exposure to all of these factors. One of the first of these models—and still the most widely used—is the Barra risk model. While the specific Barra risk factors vary by market, they normally include:
- Momentum, which is a stock’s recent performance.
- Volatility, how sensitive a stock is to the ups and downs of the market, a measure that includes a stock’s beta.
- Value, based on many ratios such as P/E, price/book, and price/cash flow.
- Size, equal to market capitalization. Because the size effect becomes more pronounced as market cap grows bigger or smaller, a size nonlinearity factor is included as well.
- Growth, looking at historic and estimated earnings growth.
- Liquidity, a stock’s trading volume.
- Financial leverage, the amount of debt on a company’s balance sheet.
Exposure to common factors can often explain much of a fund’s tracking error against an index. For example, if a fund has a heavy weighting in stocks with lots of financial leverage—compared to the index, of course—it will do well when market conditions favor this type of company.
Portfolio managers want to ensure that their factor exposure is consistent with their portfolio’s objective and approach, especially since style drift can be a major source of concern for many managers. For example, a value-style manager would expect to have greater-than-average exposure to value and low exposure to high growth and positive momentum.
You’ll then assess whether the estimated tracking error is appropriate for your fund. An index fund should have a tracking error of close to zero. An aggressive fund might be expected to have a performance variation from its index of 5 to 6 percent. In between these two extremes are broadly diversified funds that make active decisions always keeping the benchmark in mind.
Performance Analysis
Now the investment decisions are made and begin to generate performance results. Your results will be dissected by pundits in the media rating, rating firms such as Lipper and Morningstar, and fund shareholders—but nowhere more extensively than within your fund management company itself. Portfolio managers always analyze past performance with the goal of learning from both their successes and mistakes. And as a portfolio manager, you’ll make plenty of mistakes. Even outstanding fund managers will find that only two-thirds of their stocks are winners, while the rest are losers—relative to the benchmark, that is.
Performance attribution. Performance analysis begins with performance attribution, the process of calculating the contribution of each decision to the fund’s returns. Again, all of this work is done relative to the benchmark. For example, you may have chosen to overweight financial stocks in the fund compared to their weight in the benchmark index. If financial stocks outperformed the overall index during the subsequent period, the decision was a good one. Performance attribution captures that benefit, measuring the effect of both the size of the overweight and the degree of outperformance. The combination of the two factors is the decision’s relative contribution to the fund’s performance, which is measured in basis points.
Specialized computer programs generate reports that will enable you to see how even single securities contributed to return. If, for example, the fund holds a 1 percent position in a stock that is not included in the benchmark and that stock outperforms the index by 20 percent, that holding contributed 20 basis points to outperformance (1 percent times 20 percent equals 20 bp). But if the fund holds a 1 percent position in a stock with a 1 percent weight in the index, the holding makes no contribution to relative performance, since its returns are already incorporated in the index’s returns. Similarly, having no exposure to an index stock that does well will detract from relative performance. Table 5.3 shows a sample attribution report for the hypothetical Avon Hill U.S. Equity Fund at the sector level. Information on how the contributions are calculated is available on this book’s web site.
TABLE 5.3 Sample Performance Attribution for the Avon Hill U.S. Equity Fund
While portfolio attribution tries to isolate each factor contributing to a fund’s performance, the interaction of these factors is quite complex. A portfolio manager can make an incorrect call on sector allocation but recover through good security selection decisions. For example, as you can see in Table 5.3, the manager of the Avon Hill Fund was underweighted in information technology, a sector that did relatively well, which caused the fund to lag the index by 9 bp (the sector weight contribution). However, the specific stocks the fund held in that sector outperformed modestly for a positive contribution of 12 bp. The positive security selections compensated for the incorrect sector decision, resulting in a combined total relative contribution of 3 bp from the fund’s technology positions.
You’ll look at the contribution of both individual stock and sector decisions and then try to identify patterns in the returns. Maybe you’ll conclude that you’ve had great stock picks, but didn’t put enough of the fund’s assets in them. To adjust, you’ll increase the weightings of your top picks—though you’ll have to be careful not to increase your tracking error too much.
Risk-adjusted performance. As a final step, you’ll look at your risk-adjusted performance. To do this, you’ll divide your alpha by your actual tracking error. The result is the information ratio. The higher it is, the greater the return for the risk taken. Top-ranked equity funds may have an information ratio of about 0.5, meaning that they deliver about half of their tracking error in outperformance.
CHAPTER SUMMARY
The managers of stock mutual funds mainly rely on two types of investment research: fundamental research and quantitative research. Fundamental research analysts look closely at individual companies or industries to find little-known relationships or to identify situations in which the consensus opinion appears to be wrong. Information provided by the companies themselves, insights gathered from industry sources, and research reports from other analysts help them develop a model to project future earnings. Fundamental analysts will generally recommend purchase if a company is expected to have a positive earnings surprise or if its stock is attractively valued. Conclusions about valuation are commonly based on ratio analysis using P/E and other metrics.
Quantitative analysts sift through data on large numbers of stocks to identify patterns in performance. They develop a hypothesis about factors that determine stock price performance, and then back test that hypothesis using historical data.
Index funds use one of two different portfolio management techniques. They may replicate the index by owning all the stocks in the index in the same proportions as their weightings in the index. Or they may use sampling, meaning that they buy a representative sample of index stocks that is expected to provide similar performance to the index as a whole. Index fund managers must have good information about daily cash flows and handle them efficiently.
The portfolio managers of actively managed funds generally focus on a particular style of investing when selecting stocks for a fund. The most popular styles are growth, value, and growth at a reasonable price. Growth managers look for companies with higher-than-average earnings growth, while value managers seek out companies with low multiples and high dividend yields. Growth-at-a-reasonable-price managers look for stocks with decent growth prospects that aren’t exceptionally expensive.
Active managers evaluate their positions in relation to the benchmark index. They may overweight or underweight the stocks in the index or hold out-of-benchmark positions. Risk control tools help managers predict the overall volatility of a portfolio, considering the correlations among its holdings. Many managers use a model that analyzes exposure to common factors that influence stock price behavior. Performance attribution analysis enables managers to precisely measure the impact of specific decisions on portfolio performance.