Appendix to Chapter 6
Bond Basics
We start our review of bond basics with a definition. A bond is a formal IOU given by a borrower, such as a corporation or government, to the investors who have lent it money. This written IOU normally specifies that the borrower, or issuer, will:
- Repay the amount borrowed on a specific date, known as the maturity date.
- Make periodic interest payments until the maturity date.
- Promise to repay bondholders before paying stockholders. Put another way, bonds are senior to stocks when it comes to claims on a company’s cash—most importantly, in bankruptcy.
The IOU is often tradable, meaning that it can be purchased and sold between one investor and another. While some investors may choose to hold bonds from issue date to maturity date, most buy and sell bonds during their term to meet their changing investment goals and to try to maximize total return.
The total return from a bond equals interest payments received plus—or minus—the change in price of the bond from time of purchase to time of sale. From the perspective of the IRS, the interest is considered ordinary income, while the change in price is capital gain or loss, which is generally taxed at a lower rate.
The bond market is immense, as measured by both dollar value and number of securities. At the end of 2008, the tradable bond market in the United States was estimated to include more than two million issues, worth some $30 trillion; in contrast, there are only 7,000 stocks listed on the exchanges in the United States, valued at only half that amount.11 There are many more bonds than stocks because, while most firms have only one class of stock, governments and companies may issue more than one—and often many—different bonds, each with a unique set of attributes.
This appendix reviews:
- The characteristics of bonds
- The key measures used to evaluate and compare them
- Their principal risks
DEFINING CHARACTERISTICS OF BONDS
Every bond can be described by the combination of five key attributes, which are all described in the prospectus prepared when the bond is publicly issued. (The prospectus describes the provisions of the indenture, which is the legal document defining the terms of the bond.) The five defining attributes are: issuer, par value, coupon, maturity, and option features, if any.
Issuer. The issuer is the entity that has borrowed the money and is responsible for paying bondholders. An issuer is normally a corporation or a governmental organization. Bonds are said to be the obligations, or debt, of the issuer.
Par value. Par value is the amount that investors will be repaid when a bond reaches its maturity date; it is normally set at $1,000 per bond. Par value is also referred to as face value, maturity value, principal amount, or just principal.
Current market price, the price at which the bond can be sold to other investors, is expressed as a percentage of par value. Thus, a price of 97.5 for a $1,000 par value bond means that the investor pays $975 for each bond, equaling 97.5 percent of $1,000.
Coupon rate. The coupon rate specifies the amount of periodic interest the bond will pay. The term coupon originated in the days when investors were given a paper certificate as evidence of their ownership of a particular bond. To collect the interest owed, bondholders would clip a coupon from the edge of the certificate and turn it in to the company—or, more often, its bank—in exchange for cash. Today, most bonds are held in electronic form, a system called book entry, which enables bondholders to be paid automatically without requiring action on their part.
The coupon rate is usually expressed as an annual percentage of the par value. For example, an investor holding a $1,000 par value bond with a 6 percent coupon would receive $60 per year in interest payments—plus $1,000 in repayment of principal on the bond’s maturity date, of course. Most bonds pay interest semiannually, so that the owner of this bond would receive a payment of $30 every six months.
The bond in this example is a fixed rate bond; its coupon does not change during the life of the bond. In contrast, some bonds, known as floating rate securities, have coupon rates that are reset periodically using a formula. An example is a coupon rate adjusted every year to be 2 percent, or 200 basis points, higher than the yield on an interest rate index, such as LIBOR. (The London Interbank Offered Rate is the rate at which banks lend money to each other. It is pronounced “Lie-bore.”) “The Case of the Missing Coupons” describes a unique type of bond with no coupon at all.
THE CASE OF THE MISSING COUPONS
As the name suggests, zero coupon bonds make no periodic coupon payments. Rather, they are issued at a discount, meaning at a price below par value, with their return coming solely from the change in price from the issue date until maturity. For example, a five-year zero coupon bond with a par value of $1,000 might be issued at a price of 80 or $800. While not providing any periodic interest payments, the bond should increase in value roughly $40 per year until maturity in five years, when it repays the par value of $1,000.
The tax treatment of zero coupon bonds deserves special mention. Because there are no coupon payments, an investor might suppose that the return from the change in price would be treated as a capital gain and taxed at potentially favorable capital gains rates. Unfortunately, it doesn’t work that way. The IRS considers the expected annual increase in value—called the accretion—to be ordinary income each year. Therefore, the holder of a zero coupon bond, while receiving no annual cash interest payments, is still liable for taxes on the yearly accretion. For this reason, zero coupon bonds are best held in tax-deferred accounts, such as individual retirement accounts.
Maturity date. The maturity date is the day on which the bond comes due, when the issuer is required to repay investors the par value, or principal amount. Most bonds have a maturity date within 30 years of their issue date. There are rare exceptions to this general rule, including century bonds with 100-year maturity dates, as well as perpetual bonds with no set maturity date at all.
Bonds with one to five years remaining to the maturity are considered short-term, while long-term bonds have more than 12 years left to maturity. Those with maturities falling between 5 and 12 years are known as intermediate-term bonds. Bonds with maturities of from 1 to 10 years are often referred to as notes.
Option features. Many bonds contain features that give special rights to either the issuer or the investors that can alter their risk and return patterns significantly. Two types of options that are often imbedded in bonds are call and put features. The term imbedded simply means that the bond was issued with the option included.
Call provisions allow the issuer to redeem, or call, the bond and pay off bondholders before the final maturity date. This is by far the most common form of option included with bonds. Most homeowners are familiar with call provisions, since residential mortgages usually include them—in the form of a right to pay back all or part the loan at any time. Repayment is normally required when houses are sold, but homeowners also have to option to prepay when they can save some money by refinancing at a lower interest rate.
Like homeowners, companies and governments often want to take advantage of lower interest rates to lower their costs. To do this, they often include call provisions in the bonds they issue to enable them to retire higher-coupon bonds. They may fund the repurchase by issuing new bonds at a lower interest rate. Investors who buy bonds with call provisions understand that they are granting a valuable right to the issuer and want to be compensated for it. As a result, callable bonds generally have higher coupons than similar noncallable bonds.
Alternatively, put provisions place the power in the hands of the bondholders, giving them the right to sell their securities back to the issuer. Bond owners will often exercise their option if interest rates rise and other bonds then appear more attractive. The benefit here is to the investor, with the result that bonds with put options are usually issued with lower coupons than other bonds without those features. “Exercising Options” illustrates how option provisions work in practice.
There is a third type of option feature called a conversion feature, which allows investors to exchange bonds for shares of stock when prescribed conditions are met. Bonds with these features are called convertible securities. The conversion feature can be quite valuable, particularly if the stock price rises substantially, so convertible bonds often have much lower coupon rates than bonds without conversion features. Smaller or higher-risk companies are more likely to issue convertible bonds.
EXERCISING OPTIONS
When do bond options get used? (The technical term is exercised.) Let’s take a look at a hypothetical bond, issued by Windy Corner Corporation, with a call feature. Here are the bond’s vital statistics, as set forth in the prospectus at the time it was issued:
- Coupon = 7 percent
- Years to Maturity = 10
- Par Value = $1,000 = price of 100
- Callable no sooner than two years after issuance at a price of 107 (or 107 percent of par value)
Now we’ll assume that it’s three years after the bond was issued. Times have been very good indeed. The economy has done well, so Windy Corner is in great financial shape, and interest rates have fallen along with inflation. In this favorable environment, the bonds have increased in value, and are now trading at a price of 110. Management decides to exercise its option and call the bonds, paying the investors the stipulated price of 107. Maybe the company no longer needs the money, or it may plan to issue new bonds with a lower coupon rate. (We explain why the rate will be lower when we discuss the price and yield relationship in a bit.)
Now let’s assume that instead of a call provision, the Windy Corner bonds have been issued with a put feature that allows investors to sell them back to the company at a price of 90 no sooner than two years after issuance. We’ll also assume that—rather than being a boom time for Windy Corner—the last three years haven’t been good at all. The economy has been in a recession, and the company just lost a major contract from a customer who can no longer afford its products. The price of the bonds plunges to 85, so bondholders put their bonds back to the company, requiring that Windy Corner redeem them at a price of 90 per bond.
A critical question: In this difficult environment, will the company have the money to buy the bonds back? It’s not a sure thing. While put options are designed to reduce an investor’s risk, they work only if the issuer has the financial strength to honor the put.
KEY ANALYTICAL MEASURES
Investors compare bonds using a number of measures. The most-used ones are: current yield, yield to maturity, option-adjusted yield, yield spread, and duration.
Current yield. Current yield, also called the coupon rate, equals the annual interest or coupon payments divided by the bond’s market price. For example, a 5 percent coupon bond priced at 90 has a current yield of 5.6 percent, which equals 5 divided by 90. Simple to compute, perhaps, but simplicity comes at an analytical cost. Current yield captures only one source of a bond’s return—its coupon payments—and ignores others, such as expected changes in price. For a more holistic view of a bond’s value, a broader metric is needed.
Yield to maturity. Yield to maturity is the most often quoted yield measure. Generally, when the yield of a bond is cited, it is the YTM that is being referenced. YTM captures the value of current yield plus the expected change in price. Going back to our hypothetical bond, assuming that it has a par value of $1,000 and five years to maturity, its YTM is 7.5 percent. This figure captures the current yield of 5.6 percent plus the value of receiving $100 more than the price paid when the bond matures. (Remember that price is expressed as a percentage of par value. So this bond with a price of 90 will cost $900. It will be redeemed for $1,000 upon maturity.) Several easy- to-use YTM calculators are available online, but if you want to understand how they work, we’ve provided a detailed explanation of the YTM calculation on this book’s web site. The “Price/Yield Relationship” describes how the price of a bond and its YTM are inversely correlated.
THE PRICE/YIELD RELATIONSHIP
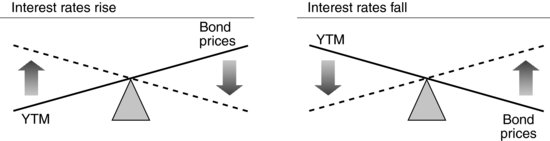
The most basic principle of bond behavior is that the price of a bond and its YTM are inversely related. If the YTM on a bond increases, its price must fall, and if its YTM falls, its price must rise.
For example, let’s look at a 5 percent fixed-rate coupon, 10-year bond selling at a price of 100. The YTM of this bond is 5 percent. Now let’s assume that interest rates drop to 4 percent on similar bonds. Because our bond has a 5 percent yield—when rates on other bonds are only 4 percent—investors are naturally willing to pay more than par value for it. In fact, the price on the bond will increase until the YTM on the bond falls to 4 percent. On the other hand, if interest rates rise to 6 percent, our bond’s coupon will look paltry compared to alternatives; investors will respond by selling this bond to buy more attractive ones, and our bond’s price will fall.
To repeat, the price of a bond and its yield always move in opposite directions. If a bond’s yield rises, its price will fall; if the yield falls, its price rises. Figure 6A.1 shows this relationship graphically.
FIGURE 6A.1 The Price/Yield Relationship
How much will a bond’s price rise or fall when interest rates change? The answer depends partly on the maturity of the bond. Bonds with longer maturities generally have larger price changes for the same change in the level of interest rates. In the case of the bond in our example, if interest rates fall to 4 percent, there would be a great deal of value in receiving a 5 percent coupon for 10 years, especially when everyone else is earning less. As a result, buyers will pay considerably more for this bond, so its price will move up significantly. But if our bond were to mature tomorrow rather than 10 years from now, buyers wouldn’t be willing to pay much for a 5 percent coupon that will last for just one day, so there is a minimal price change. Although maturity gives us a rough idea of the volatility of the price/yield relationship, we’ll need other tools, such as duration, to estimate it more precisely.
The calculation for YTM uses several key assumptions:
- The bond is valued at the current market price.
- The bond is held until maturity when it is redeemed at par value. We discuss situations when this doesn’t happen later in the appendix.
- All coupon interest payments are made by the issuer. Again, this may not occur, as we’ll discuss.
- Those coupon payments are reinvested by the bondholder in investments that earn a rate equal to the YTM.
This last assumption makes the calculation a bit circular, since it presumes that the coupon payments are reinvested at the YTM—the rate that is being calculated. However, it’s a critical simplifying assumption, making it possible to compare bonds on an apples-to-apples basis. Note that the yield the bondholder earns in practice will probably differ from the theoretical YTM; it may be higher or lower, varying directly with the actual reinvestment rate. We’ll come back to this reinvestment risk shortly.
On the other hand, YTM falls short as a useful measure of value when there are options (call or put options) imbedded with the bond. To capture the value of imbedded options, an even more sophisticated approach is required.
Option-adjusted yield. The option-adjusted yield is the YTM adjusted for the estimated value of the imbedded call or put option, if any. This value is calculated using a mathematical formula, or model, that takes into account the probability that it will be exercised. The best-known option-pricing model is the Black-Scholes model.
Yield spread. The yield spread of a bond is its YTM minus the YTM of a benchmark bond. Since the benchmark bonds used generally have little or no credit risk, the yield spread equals the compensation that investors require for taking on that risk. (We define credit risk shortly.). In the taxable market, the benchmark bond is most often a U.S. Treasury of similar maturity. In the tax-exempt market, the benchmark yield curve is usually the AAA-rated municipal scale, which is made up of the highest quality state-issued general obligation bonds.
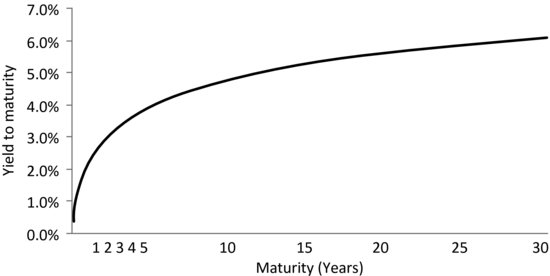
Benchmark bonds of varying maturities are often displayed in a graph called a yield curve, with YTM on the y-axis and time to maturity (in years) on the x-axis. (There’s an example in Figure 6A.2.) In most economic environments, longer maturity securities have higher yields; their higher projected returns compensate investors for lending money for longer periods of time. As a result, the yield curve is said to be normally upward sloping. A continuous curve fills in the gaps between specific issues, making it possible to compute a yield spread for almost any bond in the market.
FIGURE 6A.2 Hypothetical U.S. Treasury Yield Curve
Yields for U.S. Treasury Bonds of Different Maturities.
As an example of how bonds are evaluated relative to the yield curve, let’s look at a hypothetical Windy Corner bond. This 10-year corporate bond has a YTM of 6.0 percent, while the 10-year Treasury has a 5.0 percent YTM. That means that the Windy Corner bond has a yield spread of 100 basis points, equal to its 6.0 percent yield minus the corresponding Treasury yield of 5.0 percent. If the yield of Windy Corner bonds increases while the corresponding U.S. Treasury yield remains the same, the yield spread is said to widen. Conversely, if the yield on Windy Corner bonds decreases in relation to the corresponding Treasury yield, the yield spread narrows, or tightens. A widening yield spread generally indicates that investors believe that risk has increased for that bond, while a narrowing yield spread points to lower risk. (More on the riskiness of bonds in a moment.)
Duration. Duration is an estimate of how much a bond’s price will change if its yield increases or decreases by a small amount. (This measure is often referred to as modified duration.) For example, the Windy Corner bond has a duration of 7.66. Therefore, if interest rates fell by 1 percent, the bond’s price should rise by about 7.66 percent, which equals 1 percent times 7.66. Similarly, if yields rose by 50 basis points, then the price would be expected to fall 3.83 percent, or 7.66 times .5 percent.
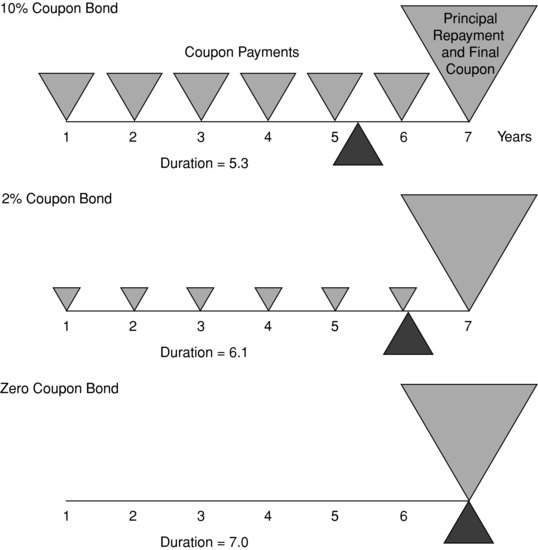
In essence, duration is the average amount of time it takes to receive all of the payments from the bond—the coupon payments plus the repayment of principal at maturity. These payments are weighted by their present value. Simply put, a payment made to an investor today is worth more than a payment made in the future. That’s because the payment made today can be invested to earn a return. The present value calculation adjusts for this future earnings stream.
Since the repayment of principal is usually the largest payment, it gets the biggest weight in the duration calculation. Therefore, time to maturity generally has the biggest influence on duration. Not surprisingly then, the longer a bond’s maturity, the higher or longer its duration.
Coupon rate also plays a role. The higher a bond’s coupon rate, the lower or shorter its duration; conversely, a lower coupon rate leads to a longer duration. That’s because the holders of bonds with high coupon rates receive more cash sooner from their investments than do owners of low-coupon bonds. A zero coupon bond, which provides no cash payments before maturity, has a duration equal to its time to maturity.
In sum, the higher a bond’s duration, the longer it takes for investors in that bond to get paid in cash. That makes bonds with higher durations riskier than those with lower durations. (Getting cash sooner is always safer than waiting longer to receive it.) In particular, if interest rates rise, investors in high-duration bonds won’t be able to take advantage of those increased rates because their cash is tied up. In comparison, owners of lower-duration bonds have more cash to put to work in higher-yielding investments. Therefore, when interest rates change, the prices of higher-duration bonds are much more affected than those of lower-duration bonds.
Figure 6A.3 provides a snapshot of how coupon and principal payments are factored into the duration, and we include a detailed explanation of the calculation on this book’s web site. Duration calculators can also be found online.
FIGURE 6A.3 Duration at a Glance12
As with YTM, duration needs to be recalibrated whenever options are present. If a bond includes a call feature, it may be called before its final maturity, shortening its expected life. Option-adjusted duration accounts for this reduction in the expected final maturity.
RISKS OF BOND INVESTMENTS
Like all investments, bonds carry their own special set of risks. These risks can be divided into six major categories: market, reinvestment rate, credit, call, liquidity, and event risk.
Market or interest rate risk. Market or interest rate risk is by far the largest single risk assumed by bond investors. Market risk is the risk that bond prices fall because interest rates are rising as a result of changing economic conditions. (Remember that inverse relationship between price and yield!)
Reinvestment rate risk. Bond investors also bear the risk that they will not be able to reinvest coupon payments at the YTM. Remember that the YTM contains some circular logic: it assumes that coupon payments received are invested to earn a return equal to YTM. Although this simplification makes it possible to compare bonds with different prices and coupons, it’s not very realistic. Interest rates are more likely to vary considerably during the life of a bond, meaning that coupon payments will be reinvested at varying rates of return and not necessarily at the YTM. That can be a problem if interest rates fall, since in that circumstance the interest on interest earned from the reinvestment of coupon payments will be less than that projected by the original YTM calculation. As a result, the bond’s actual return will end up being less than the expected return, meaning the YTM as originally calculated. A bond with a long time to maturity and a high coupon rate is most sensitive to reinvestment risk.
Reinvestment rate risk acts in the opposite direction to market risk. To illustrate how this works, we’ll assume that interest rates are declining. As we’ve learned, falling rates will boost a bond’s price, thereby increasing its total return. But at the same time, a fall in rates will also reduce the return on the reinvestment of the bond’s coupons over the long term. That reduces the bond’s total return, offsetting part the benefit of the higher bond price. In most cases, however, market risk has a much larger effect on total return than reinvestment risk.
Credit or default risk. Credit or default risk is the threat that the financial condition of the issuer of a bond deteriorates. The weaker the financial condition, the greater the risk that the issuer will default, meaning that it will fail to make interest or principal payments as scheduled. Bonds with higher default risk have higher yield spreads than comparable bonds with a lower default risk. Therefore, if credit risk increases, a bond’s yield spread will increase; a higher yield spread, in turn, leads to a higher YTM for the bond, which will result in a lower bond price.
To assess default risk, many investors refer to the ratings issued by credit rating agencies, which are represented as a letter grade. Table 6A.1 summarizes the major ratings categories used by the three largest agencies. Ratings range from AAA—the strongest—to D, for bonds already in default. Bonds with ratings from AAA to BBB ratings are called investment grade, with a relatively low probability of default. Bonds rated BB or below are considered high-yield, or junk bonds, with a higher probability of default.
TABLE 6A.1 Major Bond Ratings Categories13
There are gradations within each of these major categories. Agencies may add a plus (+) or a minus (–) to a rating to indicate whether a credit is toward the top or the bottom of a category. Also, issuers may be placed on a credit watch for an upgrade or downgrade, giving investors some sense of future rating prospects for an issuer’s bonds.
Call risk. If a bond has a call option feature, there is a risk that it will be redeemed, or called, prior to the stated maturity date. As we’ve seen, issuers are most likely to call bonds after interest rates have fallen. That creates problems for bondholders, because they’ll need to reinvest cash just when other investments have become less attractive because of their lower yields.
Liquidity risk. Investors face liquidity risk if there’s a chance that they will be unable to sell a bond when they want to raise cash. Liquidity describes how well a bond trades. A liquid bond can normally be bought and sold easily; an illiquid bond cannot. The liquidity of a particular bond is determined by its credit quality and the size of the issue—in terms of the number of bonds issued—among other factors. Larger issues, for example, often enjoy better liquidity than smaller issues.
Event risk. Events such as buyouts, corporate restructuring, natural disasters, or acts of war can have a significant adverse effect on bond values. By its nature, event risk is hard to predict with any accuracy, but it always lurks in the background.