
Chapter 3
Changing technology
Five key trends in GIS
As mentioned in the previous chapter, there are five key trends in the GIS industry today. In this section, we will explore each of these in more detail. We will also discuss other technologies key to the census process, such as GPS, cloud computing, sensor networks, imagery, and analytics.
There was a time when GIS use in general was limited. The use and application of GIS have expanded dramatically as academia, business, and government agencies alike have seen the benefits of understanding data geospatially. The fundamentals of GIS and what it can do have also evolved substantially. We are entering an era of services-based GIS. This means the GIS professional connects with citizens or consumers directly through web-based applications that provide easy-to-access visualizations. GIS also has huge implications for the enterprise user at a business or a government organization, where departments have enormous amounts of geographic data. Performing spatial analysis on the web and having access to distributed servers where different layers of data exist allow users to bring this data together, fuse it, and analyze it across the network.

Figure 3.1. Five key trends in the GIS industry (also shown in figure 2.10).
Location as a service (LaaS)
Location as a service (LaaS) is a new concept that combines the three main categories of cloud computing services: infrastructure, software, and platform as a service. Location provides a platform to develop, run, and manage analytics and embedded applications without needing to build analytics and data maintenance infrastructure into other enterprise apps and systems. LaaS is the best infrastructure to manage, store, and share location-specific capabilities between different departments and organizations. It’s a service provisioned and scaled on demand. LaaS delivers software and apps on a centrally hosted basis that can be used by the entire organization anywhere, anytime, and by anyone. LaaS provides a way to more widely leverage location to understand data through knowledge-focused workflows and on-demand analytics and provide insight.
LaaS is a location data delivery model in which data acquired through multiple sources is available via a simple application programming interface (API). By implementing LaaS, organizations can realize greater operational efficiencies, increase security, reduce costs, and optimize citizen engagement, all while achieving a higher return on investment.

Figure 3.2. Location service API.
Advanced analytics
Spatial analysis is important to any business that values location as a variable to success. EA planning is an example of a crucial function that depends on geospatial analysis. When counting a population, a planner needs to understand where the population is, what challenges the physical geography or terrain brings, and how the transportation network and built environment work. All this data can be overlaid onto a map to perform statistical analysis to optimize and create efficient EAs. This same type of advanced analytics can be applied to other areas of census workflows such as workforce optimization and management.
Maps communicate this information well, and in a web services environment, professionals will be able to make maps, graphs, and charts and perform analytics easily. Accessible from an organization’s cloud, the power of GIS, mapping, and spatial analytics is opened across the enterprise.

Figure 3.3. Spatial analysis example: EA optimization.
Big data analytics
The term big data refers to datasets that are so large or complex that traditional data-processing applications are inadequate to handle them. The ability to access vast amounts of data has changed the way all organizations function and has evolved to include the integration of big data operations into spatial analysis.
Today, anyone in the enterprise can access billions of observations or tens of thousands of raster images from spacecraft and analyze them quite easily. Data from sensor networks, radio-frequency identification (RFID) tags, surveillance cameras, UAV, and geotagged social media posts also all have geographical components to them. This big data, combined with the right tools, will greatly expand what traditional GIS has provided.
Tools such as ArcGIS® GeoAnalytics, Image Analytics, and GeoEvent™ Server all use the power of distributed computing to speed up geospatial analysis and make us more productive. GeoAnalytics Server works with existing tabular and geospatial data so a user can find hot spots, analyze patterns, aggregate and summarize data, and visualize results over time.
GeoEvent Server can track dynamic assets that are constantly changing location, such as vehicles, people, and vessels, or stationary assets, such as weather and environmental monitoring sensors. In addition, it provides real-time situational awareness for coordinated field activities. The spatiotemporal big data store makes it possible to work with observational data such as moving objects, changing attributes of stationary sensors, or both. The spatiotemporal big data store also enables the archiving of high-volume observation data, sustains high-velocity write throughput, and can run across multiple machines (nodes).

Figure 3.4. GeoEvent Server is being used to display aggregate, anonymized location events sourced from SafeGraph, a geospatial data company that builds and maintains ground truth sets on places and human movement. This exemplifies both big data and real time coming together to inform decision-making.
With ImageAnalytics Server, raster analytics quickly extracts information from very large images or image collections. Highly scalable raster analysis models, with distributed computing and storage, get traditionally large and slow analytical tasks done in a fraction of the time. Similarly, dynamic image services provide on-the-fly processing and mosaicking capabilities to make it easy to access both new and existing imagery.
On-the-fly processing transforms source imagery into a wide range of on-demand products, reducing the amount of imagery needed to process and maintain. Enterprise users can build their own imagery and raster analytics workflows for fast, multi-CPU, parallel processing of massive imagery collections. (Detailed information on imagery and analytics is presented in chapter 5).
Real-time GIS
The world is already interconnected digitally—people are connected with one another and with their government. According to the 2017 Measuring the Information Society Report from the International Telecommunications Union (ITU), the latest ITU data estimates that more than half of the world’s households (53.6 percent) now have access to the Internet at home, compared with less than 20 percent in 2005 and just over 30 percent in 2010. Globally, the number of mobile cellular subscriptions grew from 2005 to 2017, from 33.9 per 100 inhabitants to an estimated 103.5. In the least developed countries (LDCs), the growth has been more impressive, increasing from 5.0 in 2005 to an estimated 70.4 in 2017. Worldwide, active mobile-broadband subscriptions increased from 11.5 per 100 inhabitants to 56.4 in only seven years. Here as well, growth in LDCs was even stronger, from 0.4 in 2010 to 22.3 in 2017, offering hope that they are on a path to catch up with the rest of the world (ITU Telecommunication Development Sector [ITU-D]).
This trend will continue as companies like Google, together with South Africa’s Convergence Partners and other investors, announced recently they will invest as much as USD$100 million in metro fiber networks in key parts of Africa. Google and partners signed an agreement to invest in CSquared, a broadband infrastructure company focused on building wholesale metro fiber-optic networks and enabling Internet access in Africa. CSquared has operational networks in Uganda and Ghana and will operate as an independent company headquartered in Nairobi, Kenya, with plans to deploy networks in more countries.1 This is just one example of the investments being made across the region to improve access for LDCs.
Leveraging this vast network of devices is the latest trend and priority for organizations that want to keep ahead in terms of having a comprehensive enterprise GIS for the future.
Mobility
Mobile devices continue to advance and offer more processing power. This advancement is triggering a proliferation in types of applications that allow for the capturing of location. Today, a simple user experience is possible with apps and app builder tools for mobile devices. These devices can be used to collect geospatial data anywhere at any time.
GIS allows you to connect to virtually any type of streaming data feed and transform your GIS applications into frontline decision applications, showing the latest information as it occurs. Smartphones are being used to integrate real-time data from the IoT directly into a GIS where that data can be analyzed and visualized. We are now starting to talk about the Location of Things (LoT).
Other key trends
Imagery and drones
As NSOs plan and execute their national census efforts, up-to-date imagery is proving to be a critical source of information. No other source of geospatial content provides the timeliness, context, and comprehensiveness of high-resolution imagery. When integrated as part of a modern GIS, imagery becomes a data backbone capable of supporting the entire enumeration framework. Imagery can be used in pre-enumeration planning to do in-office address canvassing or to validate existing EAs. Imagery analysis can also be conducted to understand areas of change, such as agricultural or forested areas.
Imagery use in visualization is also on the rise, particularly on tablets and mobile devices. Today, there are two ways of serving imagery for use in web and mobile applications. The first is a cached map service or raster tiles. This is a regular map service that has been enhanced to serve maps very quickly using a cache of static images. The map cache is a directory that contains image tiles of a map extent at specific scale levels. Returning a tile from the cache takes the server much less time than drawing the map image on demand.
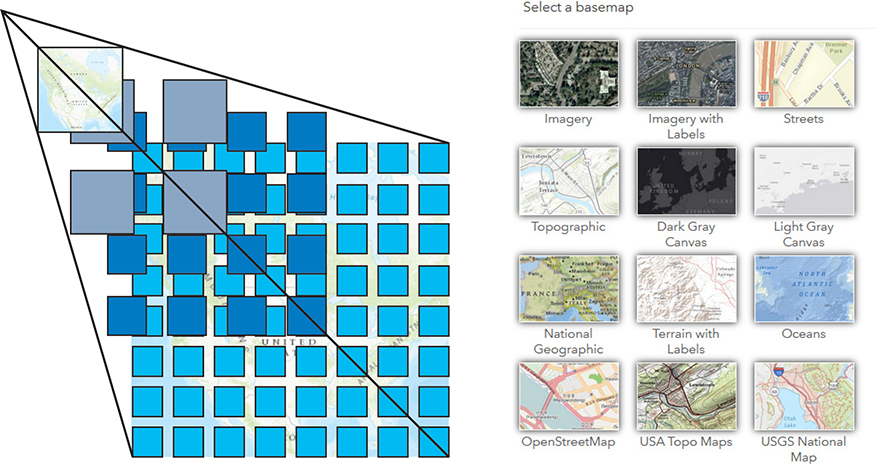
Figure 3.5. Basemaps available from ArcGIS include both raster (left) and vector.
The second way—vector tiles—contains vector representations of data across a range of scales. Unlike raster tiles, they can adapt to the resolution of their display device and even be restyled for multiple uses. They can be published as a vector tile package. A corresponding vector tile layer is created when you publish the package that can be added to a web map online.
Thanks to emergent technologies such as high-resolution sensors and small or miniature satellites, modern sources of imagery have reduced costs, improved accuracies, and thus have a growing applicability for statistical processes. The use of imagery in analytics has risen substantially in recent years and will continue to do so with the proliferation of data from new sensors such as UAVs or drones.
The adoption of drone technology across industries leapt from the fad stage to implementation fairly quickly as more and more businesses realize the benefit of this new technology. Known by many names including UAVs, miniature pilotless aircraft, and flying mini robots, drones are quickly growing in popularity. Drones are proving to be extremely beneficial in places where people cannot reach or are unable to perform tasks in a timely and efficient manner. New technologies such as Drone2Map® for ArcGIS allows users to create orthomosaics, 3D meshes, and more from drone-captured still imagery in minutes, not days. Tools like this allow one to view locations from all angles and inspect buildings or locations that may be difficult to access, visualizing imagery from multiple points of view.

Figure 3.6. The imagery demonstrates the feasibility of using drones to replace or augment surveys using high-resolution 3D mapping. The drone is a 3DR® Site Scan with a Sony® R10C camera. Images courtesy of 3D Robotics®. Drone image courtesy of McKim & Creed.
GPS
GPS is a piece of this equation, and whether needed for the collection of ground control points for imagery capture or simply to use the built-in GPS on a cell phone to capture location or get directions, both are possible and affordable today. Everyone has access to highly accurate GPS tools and workflows without any middleware. According to industry experts, several things led to this access, including a long list of technological standards that have been adopted and institutionalized in a relatively short time—Bluetooth®, REST, 3G, LTE, Wi-Fi, USB, and many more.
GPS, owned by the US government, is the world’s most popular satellite navigation system. Because of its widespread popularity, it is sometimes used interchangeably or confused with Global Navigation Satellite System (GNSS). GNSS is a general term for any satellite constellation that provides accurate positioning, navigation, and time information on a global basis. Other global navigation systems include Russia’s Global Navigation Satellite System (GLONASS), Galileo (European), BeiDou Navigation Satellite System (Chinese), and some regional systems. GPS originated in 1973 and was exclusively used by the military; it became fully operational in 1995. Originally, the signal quality was intentionally degraded under a program called Selective Availability (SA).
Brent Jones, a lifelong surveyor and land records/cadaster industry manager for Esri, says that since the year 2000, when “President Clinton intentionally turned off [SA], [accurate] GPS signals [have been] accessible to the public. Designed to make GPS more responsive to civil and commercial users, Clinton’s executive decision immediately improved GPS accuracy for the entire world and opened a market for lower-cost GPS devices and solutions. As a result, GPS manufacturers expanded by building and selling GPS components (e.g., modules or chipsets) not just end-user devices. This created competition for components that could be embedded into all kinds of solutions in a multitude of areas, such as precision agriculture, logistics, and machine control. It also allowed entrepreneurs to apply GPS in innovative ways, such as installing it in . . . the now-ubiquitous smartphones and tablets for location services.”
The UN-GGIM EG-ISGI calls out in principle 1 (“Use of fundamental geospatial infrastructure and geocoding”):
“The global framework requires a common and consistent approach to establishing the location and a geocode for each unit in a dataset, such as a person, household, business, building, or parcel/unit of land. A corresponding record of the relevant time or date for each instance of location information recorded should also be associated with each unit record. The goal of this principle is to obtain a high-quality, standardized physical address, property or building identifier, or other location description, in order to assign accurate coordinates and/or a small geographic area or standard grid reference to each statistical unit (i.e., at the microdata level). Time and date stamping these locations will place the unit both in time and in space. An alternative approach to geocoding for recording location is to use direct or indirect capture of coordinates (e.g., from GPS and maps, respectively) from fieldwork.”
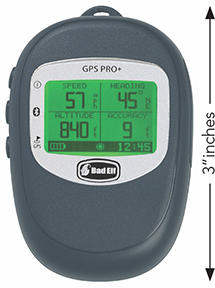
Figure 3.7. The Bad Elf GPS Pro + is a Bluetooth GPS + GLONASS receiver and data logger, accurate up to 2.5 meters. It quickly acquires satellite lock without cell tower assistance.
Jones wrote: “We have highly accurate stand-alone GPS devices, such as the one-meter Bad-Elf® GNSS Surveyor, the submeter Trimble® Navigation R1, the Spectra® Precision Mobile Mapper 300, the Geneq® iSXBlue, the single-centimeter Eos® Arrow 200, and the super-accurate geodetic Septentrio® Altus NR2 . . . These devices don’t come with heavy desktop software to process data; they just produce a highly accurate position that you can use in your own technology or solution. This modularization represents the virtual deregulation of accuracy.”
GPS systems, once expensive and complicated, have become commonplace. Today, one can simply decide on the accuracy level needed, choose the device desired, and get to work.
Cloud computing
Cloud computing is growing in importance for GIS professionals. Reasons include cost, scalability, flexibility, and rapid deployment. Two specific scenarios for GIS in the cloud are particularly compelling: increasing operational efficiencies with on-demand GIS and streamlining application development and deployment. Traditional desktop deployment and single-threaded processing architectures that traditionally dominated GIS tools are not sufficient to analyze web-scale data, much less the flood of data from the IoT.
Cloud technology can be leveraged in many ways and depends on organizational needs. Some organizations opt to use a private cloud, some use cloud offerings such as those available via Amazon Web Services (AWS) or Microsoft Azure, some may choose to use Esri’s ArcGIS Online, and others may use a hybrid combination of these.
Enterprise GIS can allow one to quickly deploy ArcGIS Server applications and services to the cloud rather than buying and maintaining infrastructure. The advantages of this in census operations can be key owing to the huge swell of temporary part-time workers and peak loads that are large and not representative of the day-to-day needs of a statistical organization. In this case, leveraging cloud infrastructure can prove to be extremely cost-effective.

Figure 3.8. GeoHive portal combines data from Central Statistics Office Ireland and Ordnance Survey Ireland to provide a simple, easy-to-use interface for citizens and researchers alike to find the data needed to understand such issues as society, economy, and environment.
Open data
This section would not be complete without mentioning the open data movement. Open data is the idea that some data should be freely available to everyone to use and republish as desired, without restrictions from copyright, patents, or other mechanisms of control. The UN Statistics Division organized a meeting at the Statistical Commission in March 2017 with the goal of exploring how open data initiatives can provide advantages to NSOs operating in both advanced and less advanced statistical systems, including in countries with limited resources.

Figure 3.9. A modern GIS.
According to the UNSD, vast numbers of datasets that do not contain information on an individual or organization (such as weather data, GPS data, school enrollment, transport schedules, and many others) are routinely made available as open data. However, other data (such as microdata from population, economic, or agricultural censuses, household surveys, and others) can only be part of the public domain if proper precautions are taken to protect the privacy and confidentiality of individuals and organizations. In a similar sense, data generated by civil, business, or building registers could be made public under strict ethical and security protocols and secure technology platforms. Nontraditional data sources from civil society or the private sector could also be useful for research and daily decision-making purposes.
Modern GIS platforms provide the capabilities to publish data openly and securely based on the needs of the organization. With changing technology, data security and confidentiality will continue to evolve. Some of these technologies will be expanded on in the following chapters.
References
•Brent Jones. 2015. The Democratization of Accuracy. Available at https://blogs.esri.com/esri/esri-insider/2015/09/03/the-democratization-of-accuracy/.
•International Telecommunications Union. 2017. Measuring the Information Society Report 2017. Available at https://www.itu.int/en/ITU-D/Statistics/Documents/publications/misr2017/MISR2017_Volume1.pdf.
•Moneyweb. 2017. Google, Partners to Invest R1.3bn in Africa. Available at https://www.moneyweb.co.za/news/tech/google-partners-to-invest-r1-3bn-in-africa/.
•UNSD. 2017. Open Data: Adding Value by Matching Access with Privacy and Security. Available at https://unstats.un.org/unsd/statcom/48th-session/side-events/20170303-1M-friday-seminar-on-emerging-issues/.
Note