|
This chapter outlines the major controls on and patterns of sea-level change during the Pleistocene and Holocene. The chapter discusses future sea-level rise due to global warming, which is of critical importance in considering how today’s coastlines are going to adapt.
|
The position of the coastline is located at the intersection of the sea’s edge with the land. If sea level rises (falls), the coastline is shifted landwards (seawards). This refers to a situation whereby only the sea’s height changes. In reality, however, the height of the land also changes through erosion, deposition and tectonics. The net result of variations in sea and land height leads to transgressive and regressive conditions at the coast. Net rising sea level leads to transgressive conditions and results in drowning and/or onshore migration of coastal landforms. Net falling sea level leads to regressive conditions and results in coastal emergence and/or progradation. Locally and over short time scales (seconds-months), sea level varies with waves, tides, changes in atmospheric pressure and winds. However, when averaged over large spatial and tem poral scales, a stable value can be obtained, which is referred to as mean sea level (MSL). The elevation of MSL varies considerably from place to place (see Section 2.3).
We can distinguish between two types of sea-level change:
• Relative sea-level change can be brought about by a change in the sea level and/or a change in the land level, and operates on a regional/local level.
• Eustatic sea-level change (sometimes called absolute sea-level change) refers to a global change in sea level unrelated to local/regional effects and is most commonly caused by changes in ocean water volume and temperature, related in turn to the vigour of the hydrological cycle and climate.
When MSL is measured at a single location over an extended period, only a relative sea-level curve can be derived. Eustatic changes in sea level can only be determined from the relative sea-level curve if the vertical movement of the land level is known. If there is a constant relative sea level, this does not imply that both the land level and eustatic sea level are constant – it is more likely that the change in eustatic sea level is balanced by the movement of the land plus other site-specific factors such as sediment compaction and subsidence.
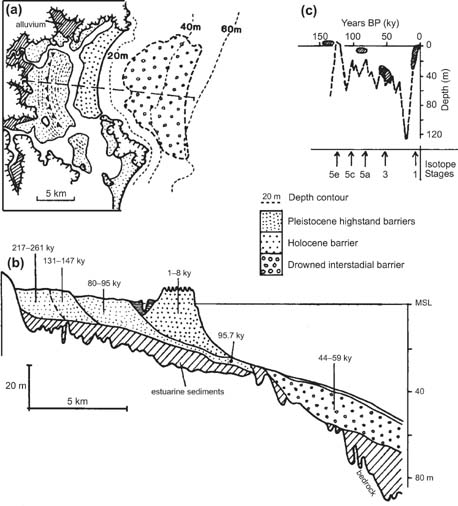
Figure 2.1 Stratigraphic evidence of sea-level change in the Tuncurry embayment, New South Wales, Australia. (a) Distribution of barrier systems onshore and on the inner shelf. (b) Shore-normal cross-section (dashed line in (a)) through the barriers showing their dimensions and ages (‘ky’ refers to thousand years before present). (c) Group ages of the various barrier systems (shaded) and the estimated positions of sea level when they formed. The numbers indicate the Marine Isotope Stages and the sea-level curve (dashed line) is that of Chappell and Shackleton (1986). (From Roy et al., 1994.) (Copyright © 1994 Cambridge University Press, reproduced with permission.)
Evidence of past MSL variations, termed sea-level indicators, can be found along most coastlines worldwide. Indicators of sea levels higher than present (sea-level highstands) are easier to find than those for lower sea levels (sea-level lowstands), because evidence of lowstands are generally submerged and may be eroded away or covered by sediment during subsequent transgressions. The most accurate sea-level indicators are marine organisms such as barnacles and corals that live at known tidal levels. Information about sea-level change can be obtained by comparing the elevation of present-day tidal bands (with living organisms) with those of equivalent fossil organisms which now stand at a different level. When preserved within dated sediments, these organisms can help establish a sea-level curve, which is a graph tracking the position of MSL over time.
Former sea levels in sedimentary coastal environments are recorded in the coastal geomorphology and stratigraphy. For example, Figure 2.1 shows coastal barriers of different ages. The present shoreline is formed by a relatively young Holocene barrier. Landward of this is an older barrier complex composed of three units that get older in a landward direction. These four periods of barrier formation all took place when sea level was close to present. Evidence of a fifth barrier system can be found at 40 m below present MSL on the inner shelf. By contrast, rocky coasts generally lack depositional features, and indicators of sea-level change often consist of eroded shore platforms, cliffs, notches and benches.
Many factors contribute to sea-level change over time and space. On the basis of their spatial extent, we can distinguish between global, regional and local causes of sea-level change.
2.2.1 Global causes: Changes in ocean water volume and thermal expansion
Eustatic sea-level change is caused by a change in the quantity of water in ocean basins. An increase (decrease) in water volume results in sea-level rise (fall). Total global water volume can be considered constant and is expressed by the global water balance
| K = A + O + L + R + S + B + M + U + I |
(2.1) |
where K is total water volume (a constant) and the other variables are indicated in Table 2.1 and expressed as an equivalent water depth. It is apparent that the growth and melting of continental ice sheets during the Pleistocene is of paramount importance for long-term eustatic sea-level changes. During cold glacial periods, sea water is progressively lost from the oceans as it accumulates on the continents as snow and ice. During warm interglacial periods, ice melts and the water is returned to the oceans, resulting in sea-level rise. The effect of ice sheets on sea level is called glacio-eustasy. Floating sea ice has no effect on eustatic sea level since the weight of the ice is already supported by the water.
Table 2.1 Estimates of storage volumes and equivalent water depth for components of the world water balance. Note the large uncertainty regarding the volume of water stored as groundwater. (After Pirazzoli, 1996.)
| Parameter |
Present volume (km3) |
Equivalent water depth |
| A Atmospheric water |
13,000 |
36 mm |
| O Ocean and seas |
1,370,000,000 |
3.8 km |
| L Lakes and reservoirs |
125,000 |
35 cm |
| R Rivers and channels |
1700 |
5 mm |
| S Swamps |
3600 |
10 mm |
| B Biological water |
700 |
2 mm |
| M Moisture in soils and |
65,000 |
18 cm |
| the unsaturated zone |
|
|
| U Groundwater |
4,000,000 to 60,000,000 |
11 to 166 m |
| I Frozen water |
23,290,000 |
64.5 m |
| Antarctica |
20,440,000 |
56.6 m |
| Greenland |
2,635,000 |
7.3 m |
| Others |
215,000 |
0.6 m |
Even if the quantity of sea water remains constant, sea level may change due to variations in sea water temperature. Sea water density increases with decreasing water temperature. If a volume of water is heated (cooled), it will occupy a larger (smaller) volume, so a decrease (increase) in sea water temperature causes a fall (rise) in sea level. This process is known as steric or thermal expansion and is a significant contributor to present sea-level rise. For example, an increase of 1°C over a water depth of 4000 m (approximately the average depth of the Pacific Ocean) produces a rise in sea level of 0.6 m.
Eustatically-high sea levels are characteristic of interglacials when continental ice volume is low and oceans are warm. Beaches, shore platforms and coral reefs formed during previous interglacials are commonly found near present sea level. To calculate the amount of eustatic sea-level change from such features one needs to know the rate of land uplift and the date at which the features formed. Eustatic sea level is calculated as
where E is the amount of vertical shoreline displacement caused by eustatic change, P is the present elevation of the feature above MSL, and U the amount of tectonic uplift that has occurred. For example, if a shore platform is found at 120 m above MSL, the platform is 100,000 years and uplift rate is 1 mm yr−1, then the platform has been uplifted by 100 m and the eustatic change in sea level is 20 m. In other words, when the shore platform developed, the eustatic sea level was 20 m higher than present.
2.2.2 Regional causes: Isostatic changes
The Earth’s crust floats on a denser underlying layer (asthenosphere). This two-layer system is in isostatic balance when the total weight of the crust is exactly balanced by its buoyancy. Addition of a load to the crust (e.g. water, ice or sediments) will upset the isostatic balance. To compensate for the increased crustal weight, some of the asthenospheric material will flow away and the land level will eventually fall.
Glacio-isostasy refers to isostatic adjustments of the Earth’s crust due to the loading and unloading of ice sheets as they grow and decay respectively. The weight of an ice sheet causes depression of the underlying land surface (Box 2.1). At the margins of the depressed land surface the land rises slightly upward due to the flow of asthenospheric material towards this region and away from the centre of depression. This leads to a raised ‘rim’ around ice sheet margins, known as a forebulge. When the ice melts, the land surface will eventually revert back to its former position, thus the area formerly covered by the ice will rise up and the forebulge will sink down. This process is known as isostatic readjustment. Shorelines located in areas formerly covered by ice sheets will therefore experience a postglacial fall in relative sea level, whereas shorelines in the forebulge areas will undergo relative sea-level rise. Patterns of sea-level change in glaciated areas are therefore extremely complex and variable.
Box 2.1 Calculating postglacial rebound
If we ignore the response times of isostatic adjustment, it is relatively easy to determine the amount of postglacial rebound that can be expected following ice unloading. Figure 2.2 shows the depression of the Earth’s crust by an ice sheet (Allen, 1997). The isostatic balance above the depth of compensation can be performed for a column far from the ice sheet (far-sheet (near-field), and is
where ρi, ρe and ρm are the densities of ice, crust and mantle, respectively, and hi , hc and w0 are the thickness of the ice sheet, crust and the maximum deflection of the land surface under the ice sheet, respectively. If the thickness of the crust is considered constant, the isostatic balance can be simplified to
Assuming an ice density of 800 kg m−3 and a mantle density of 3300 kg m−3 we find
Thus, depression of the Earth’s crust is about a quarter of the ice thickness. The Laurentide ice sheet over the Hudson Bay area of Canada had an average thickness of 5 km during the height of the glaciation, implying that the amount of depression, and consequent rebound during deglaciation, may have exceeded 1 km. This has led to the formation of concentric staircases of shorelines around the Bay as the land has risen up. Uplift of the region today is still taking place at up to 10 mm yr−1 (Sella et al., 2007).
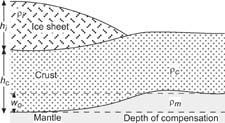
Figure 2.2 Schematic diagram showing isostatic balance. (From Allen, 1997.) (Copyright © 1977 Blackwell Publishers, reproduced with permission.)
There are considerable time lags involved with glacio-isostatic movements due to the rigidity of the Earth’s crust. These time lags are so long that, even today, the Earth’s crust is still isostatically adjusting to ice sheet melt that took place more than 10,000 years ago. For example, postglacial uplift in the Baltic Sea region due to isostatic rebound has amounted to 300 m over the past 10,000 years, and the region is still being uplifted at up to 10 mm yr−1 (Figure 2.3). In Britain, too, isostatic adjustments are also still ongoing. Scotland and northern England, which were covered by ice during the last glacial period, are being uplifted at average rates of up to 2 mm yr−1, while southern England, which is located in the forebulge area, is subsiding by up to 2 mm yr−1 (Case Study 2.1).
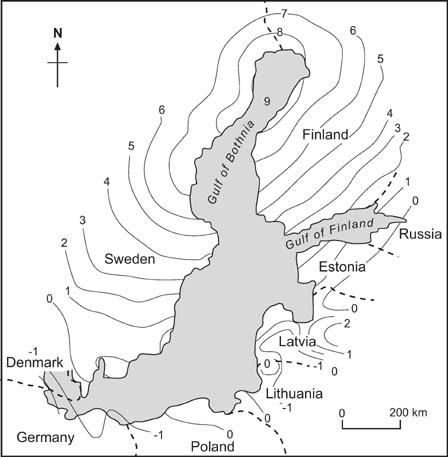
Figure 2.3 Isobases of present-day rates of uplift of land surfaces (mm yr−1) in Sweden and Finland due to postglacial rebound. (Modified from Eronen, 1983.)
 Case Study 2.1 Isostatic uplift and sea-level change in Scotland
Scotland was overlain by the thickest extent of ice during the last glaciation in the British Isles and therefore experienced the greatest amount of isostatic depression and subsequent uplift. The area of greatest ice thickness in west-central Scotland has been rising more quickly than peripheral areas where the ice was thinner and the loading not so great. During uplift, the position of the coastline (and therefore the position of MSL) has varied substantially. Evidence for previous MSL position comes from the presence of raised shore platforms and estuarine sediments preserved within bedrock valleys. Where these landforms can be dated, the position of shorelines at certain time intervals can be established. This is the method by which isobase maps can be constructed, which are maps that show the total amount of land-surface uplift that has taken place relative to MSL since that time period.
Smith et al. (2006) identify four main shoreline phases in Scotland (Figure 2.4). Due to isostatic rebound the isobases that correspond to these shore-lines have somewhat different shapes, and the four shorelines do not lie parallel to each other. For example, the highest shoreline around the centre of uplift is the Main Postglacial shoreline. Around much of the Scottish coast the Blairdrummond shoreline is the highest shoreline. In between these areas, these shorelines actually cross over one another so, counter-intuitively, there is evidence at the same elevation for two different sea-level positions. This situation highlights the complexity of isostatic uplift in driving sea-level change.
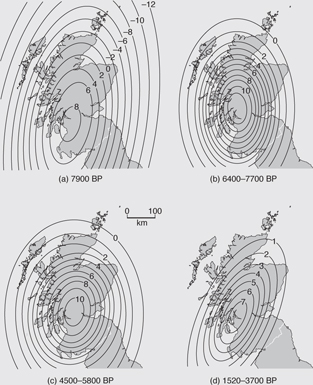
Figure 2.4 Map of Scotland showing isobases (in metres relative to present-day MSL) that correspond to four distinctive shoreline positions, and their likely timings (years BP). (a) The Holocene Storegga tsunami shoreline. (b) The Main Postglacial shoreline. (c) The Blairdrummond shoreline. (d) The Wigtown shoreline. (Modified from Smith et al., 2006.)
During ice sheet decay, meltwater escapes to the ocean, causing sea level to rise, which in turn exerts a load on the flat continental shelves. This results in subsidence of the sea floor due to hydro-isostasy. Along coasts with wide continental shelves, the water load across the shelf is not uniform because the deeper part of the shelf near the shelf edge experiences a higher pressure than the shallow part near the coast. As a result, the subsidence of the deeper part of the shelf results in an uplifting of the shallower part and coastal fringe, hence a fall in relative sea level. Most Southern Hemisphere coastlines, where the effects of glacio-isostasy are insignificant or non-existent, have experienced such a fall in relative sea level during the Holocene.
The geophysical effects of glacio- and hydro-isostasy have been investigated using numerical models, and based on these effects Lambeck (1993) distinguishes four zones:
• Near-field sites are regions within the limits of former ice sheets.
• Ice-margin sites are regions near former ice margins.
• Intermediate-field sites are regions just outside former ice margins.
• Far-field sites are regions well away from the influence of former ice sheets.
An outcome of global isostatic models is that vertical land movements caused by deglaciation extend more or less all around the globe. This is confirmed by satellites such as GRACE (Gravity Recovery and Climate Experiment) which is able to detect very small-scale crustal responses to glacier unloading (e.g. Argus and Peltier, 2010). Based on these data, computer models can be used to distinguish the relative contributions of glacio-isostasy versus thermal expansion to sea-level change.
2.2.3 Local causes: Tectonics and subsidence
Locally, tectonic activity can result in changes in land level. Trends of vertical displacement caused by tectonics often appear to be continuous and gradual over the long term, but in detail usually take place in short jumps associated with earthquakes. For example, a large earthquake in Prince William Sound, Alaska, in March 1964 resulted in 250,000 km2 of the coastal zone being uplifted by up to 11 m. Another local cause of sea-level change is sediment compaction which results in land subsidence, especially in deltas and wetlands where sediments can contain up to 50 per cent water. In peat layers, compaction may reduce water content to as little as 10 per cent, resulting in a fall in land level. Associated with delta environments is the process of sediment-isostasy, whereby the Earth’s crust is depressed due to the weight of the sediments on top (similar to glacio-isostasy). The combination of compaction and sediment-isostasy makes deltas very prone to relative sea-level rise. The Mississippi delta, for example, has experienced a drop in land level over the last 10,000 years of c. 165 m, equating to a rate of relative sea-level rise of 16.5 mm yr−1 (Fairbridge, 1983). Similarly, land subsidence and relative sea-level rise during the Holocene for the Yangtze delta, China, is 1.6–4.4 mm yr−1 (Stanley and Chen, 1993). Land subsidence can also result from the extraction of groundwater, oil or gas (see Chapter 12). Land subsidence due to water extraction is 4.6 m in Tokyo and 2.7 m in the Po delta, northeast Italy (Pirazzoli, 1996).
The Pleistocene, which started at 2.6 million years BP, comprised at least 17 alternating cold glacial and warm interglacials. The glacials lasted around 100,000 years and the interglacials around 10,000 years. The major driver of the cyclic pattern of glacials and interglacials is small variations in the trajectory of Earth’s orbit around the Sun, which causes small changes in the total amount of the Sun’s radiative heat energy received by the Earth (Berger, 1992). There are three main orbital cycles that have different cycle lengths but which, in combination, have given rise to the glacials and interglacials of the Pleistocene. Briefly, these cycles are:
• Eccentricity – This refers to the elliptical trajectory of the Earth’s orbit around the Sun. Temporal variations in eccentricity have a period of about 100,000 years.
• Obliquity – This refers to the inclination of Earth’s axial tilt which accounts for the seasonal alternations of summer and winter. In the Northern Hemisphere, summer occurs when the axis of rotation is inclined towards the Sun, while winter occurs when the axis of rotation leans away from the Sun. At present the inclination is nearly 23.5°, but the angle varies between 22.1° and 24.5°. The periodicity of this variation is about 41,000 years.
• Precession – This refers to the orientation of Earth’s axis of rotation relative to the plane of its orbit. This orientation changes with a periodicity of about 21,000 years, termed precession. At present, the Earth is closest to the Sun (at perihelion) in the Northern Hemisphere winter. However, due to the cycle of precession, perihelion will coincide with the Northern Hemisphere summer in about 11,000 years time.
For more information the interested reader is referred to Berger (1992) and Ruddiman (2006).
The last glacial period started about 70,000 years BP and finished around 11,500 years BP. During glacial periods ice sheets grew and sea level fell, while during the interglacials ice sheets melted and sea level rose. Interspersed within the glacials and interglacials were colder and warmer intervals of shorter duration (c. 1500 years), known as stadials and interstadials, respectively. These shorter warming/cooling episodes also caused eustatic sea-level fluctuations. Along coastlines that have undergone steady tectonic uplift over the Pleistocene, such as Barbados and New Guinea, evidence of interglacial sea levels can be observed in the form of raised shore platforms or raised coral reefs. More commonly, however, any traces of the lower sea levels have been obliter-ated by subsequent rises of sea level. This means that the most detailed sedimentary and morphological evidence only exists for the most recent glacial cycles.
2.3.1 Evidence from ice cores for Pleistocene climate change
The highest resolution evidence for Pleistocene climate change comes from ice cores recovered by drilling through the ice sheets of Greenland and Antarctica. Here, physical and chemical properties of annually-layered snow and ice can be used to reconstruct past climate, and can be compared with sea-level curves derived from deep-sea cores or with biological evidence on land. Key climatic data from ice cores include the ratios of hydrogen and oxygen isotopes in the ice, which provide an index of former temperatures, and the chemistry of air that is contained within sealed bubbles inside the ice, which can show the chemical make-up of past atmospheres, in particular the concentration of greenhouse gases such as carbon dioxide (CO2). Important ice cores are from the Vostok and Dome C drilling sites in East Antarctica, and the GRIP (Greenland Ice-core Project), North GRIP and GISP2 (Greenland Ice-Sheet Project) sites in central Greenland.
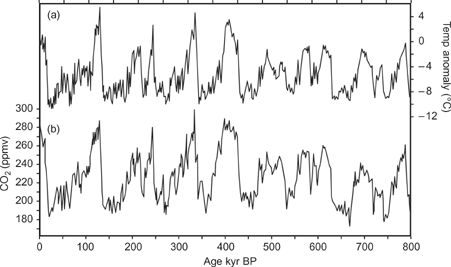
Figure 2.5 Variations in (a) temperature (b) CO2 during the past 800,000 years from the EPICA ice core from Antarctica. Note the strong positive correlation between CO2 concentration and temperature. (Modified from Lüthi et al., 2008.)
The longest Pleistocene ice core record yet recovered comes from the EPICA core (European Project for Ice-Coring in Antarctica) at Dome C in Antarctica. The basal ice recovered at this site is 890,000 years old and shows the last eight glacial-interglacial cycles (EPICA, 2004). Each cycle has a similar succession of changes (Figure 2.5). The glacial periods show progressive but intermittent cooling followed by very rapid warming at the start of the interglacials. The amplitude of the temperature change is c. 12°C and the coolest part of each glacial occurs just before the onset of the next interglacial. The temperature is strongly coupled to atmospheric CO2 concentration. High temperatures during interglacials are associated with large CO2 concentrations (270–280 parts per million, ppm) and low temperatures during the glacials with low CO2 concentrations (180–200 ppm).
2.3.2 Evidence from deep-sea cores for Pleistocene sea-level change
Evidence for changes in sea water temperature and eustatic sea level during the Pleistocene can be derived from deep-sea cores by analysing the oxygen isotope ratio δ18O (Box 2.2). This ratio can be used as a proxy for the volume of water stored in ice sheets and therefore global sea level. Figure 2.6a shows the δ18O record for the last 250,000 years. More negative values of δ18O represent cooling periods and ice sheet expansion (i.e. sea-level fall), whereas more positive values indicate warming periods and ice sheet melting (i.e. sea-level rise). In order to distinguish between the different Pleistocene cooling/warming cycles they are numbered back in time from present, with odd numbers representing sea-level highstands and warm periods, and even numbers indicating sea-level lowstands and cold periods. This numbering system is referred to as Marine Isotope Stages (MIS). The present Holocene interglacial is MIS 1 whereas the last interglacial of similar warmth (c. 122,000–128,000 years BP) was substage (e) of MIS 5, denoted 5e in Figure 2.6.
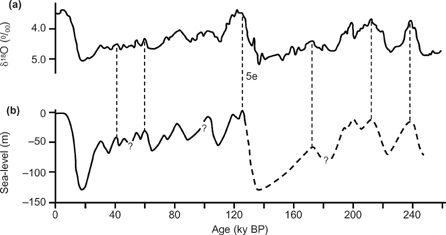
Figure 2.6 (a) δ18O record from equatorial marine core V19–30. (b) Eustatic sea-level curve from the Huon Peninsula, New Guinea, derived from a series of raised coral reefs. The time-axis of the sea-level curve was recalculated using the δ18O record. The last interglacial (5e) is marked. (Modified from Chappell and Shackleton, 1986.)
Box 2.2 Oxygen isotope ratios
Analysis of oxygen isotope ratios makes use of the relative proportion of the oxygen isotopes 18O and 16O in the skeletal material of calcareous organisms. The ratio 18O/16O in these micro-organisms is controlled by temperature-dependent fractionation of the isotopes from sea water into the skeleton of the micro-organism, and the isotopic composition of the sea water. The latter is dependent on the amount of water stored in ice sheets. The oxygen isotope 16O is lighter than 18O and evaporation preferentially removes 16O. Growing ice sheets imply a net transfer of water from the ocean to the ice sheets, resulting in an enrichment of sea water with the isotopically-heavier isotope 18O. Melting of the ice sheets on the other hand causes an enrichment of sea water with the isotopically-lighter isotope 16O.
Oxygen-isotopic compositions are measured relative to a global standard known as the Standard Mean Ocean Water (SMOW). The oxygen isotopic composition of a sample can then be expressed as per mille differences relative to SMOW
Positive values of δ18O indicate enrichment of the sample in the heavier isotope, whereas negative values indicate depletion. Changes in surface water temperature reflect to a large extent changes in air temperature. Therefore, δ18O of planktonic (surface-living) micro-organisms such as foraminifera can serve as a proxy for surface water or air temperature. In the deep ocean, however, temperatures are likely to have fluctuated little during glacial–interglacial cycles, so δ18O of deep-ocean (benthic) foraminifera is likely to represent changes in δ18O of sea water due to changes in ice volume. An increase in δ18O indicates an increase in global ice volume and hence a fall in sea level, whereas a decrease in δ18O represents a decrease in global ice volume and hence a rise in sea level.
As a rule of thumb, a difference of 0.1 in δ18O is equivalent to 10 m of sea-level change. From Figure 2.6a we can infer that sea level fluctuated during glacial-interglacial cycles over more than 100 m, which is borne out by computer models and field evidence. However, we know that deep-sea temperatures have changed as a result of changes in deep-ocean circulation, so it is more desirable to derive a palaeo sea-level curve directly from stratigraphic evidence, rather than the δ18O record alone. Chappell and Shackleton (1986) determined a eustatic sea-level curve over the last 250,000 years from a series of raised coral terraces on the Huon Peninsula, New Guinea (Figure 2.6b). Their sea-level curve indicates that sea level during the last interglacial was very similar to present, but during glacial cooling, sea level fluctuated by at least 20 m. At the period of maximum ice sheet extent at 19,000 years BP, sea level was around 135 m lower than present (Yokoyama et al., 2000). However, sea-level rise to the onset of the Holocene did not taken place at a constant rate but shows a steplike pattern with short episodes of very rapid rise separated by longer periods of much slower rise. For example, radiocarbon-dated coral reefs in the Caribbean were drowned very suddenly by periods of rapid sea-level rise at 14,200 years, 11,500 years and 7600 years BP when sea-level rose by over 45 mm yr-1 for several centuries and then slowed down dramatically (Blanchon and Shaw, 1995). This unsteady nature of sea-level rise has been linked to periods of drainage from large lakes in front of (and also underneath) the decaying Laurentide ice sheet in North America. A lake drainage event c. 8200 years BP has been linked to a jump in European sea level around the same time of 2.11±0.89 m (Hijma and Cohen, 2010). Such changes in sea level have the power to rapidly drown low-lying shelves and islands, change a coastline’s palaeo-geography and significantly alter patterns of nearshore water and sediment circulation, including tide regime.
2.4.1 Eustatic sea level
The present Holocene interglacial started at 11,500 years BP. Holocene sea-level rise, known as the Holocene transgression, reflects the melting histories of the different ice sheets, and so the rate of sea-level rise has been very variable, slowing to the present-day. A typical global eustatic sea-level curve for the late Pleistocene-Holocene transgression is shown in Figure 2.7. Rapid sea-level rise of about 0.5 cm yr-1 took place at the end of the Pleistocene (18,000–11,500 years BP), speeding up to about 2 cm yr-1 at the start of the Holocene (11,500–7000 years BP), then slowing over the mid-Holocene (7000–5000 years BP). In some midlatitude and subtropical areas, sea level peaked in the mid-Holocene at up to 1–2 m above present, corresponding to both warm temperatures and aridity in many areas at that time. The precise shape of the sea-level curve varies locally due to glacio-isostatic as well as eustatic factors (Gehrels, 2010), and as a result the definition of eustasy as a world-wide, simultaneous, uniform change in sea level has been questioned. For example, Mörner (1987) has argued that eustatic curves should only be defined for regions, not for the whole Earth. Milne and Mitrovica (2008) show, using geophysical models, that the concept of eustasy is only valid for tectonically-stable areas far away from former ice sheets.
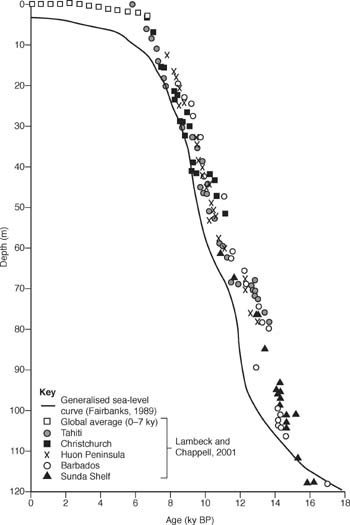
Figure 2.7 Late Pleistocene and Holocene sea-level curve according to Fairbanks (1989), with individual data points for different locations marked after Lambeck and Chappell (2001). Note the wide scatter of these data points with respect to Fairbanks’ generalised curve.
2.4.2 Relative sea level
Relative sea level represents the net effect of eustatic and isostatic sea-level changes. Whether sea-level rise is caused by eustatic or isostatic changes, the effect in terms of coastal morphology should be similar. Clarke et al. (1978) use a geophysical model to determine land movements due to glacio- and hydro-isostasy, and combine these with a eustatic sea-level curve to derive relative sea-level changes during the Holocene (Figure 2.8). The results indicate different types of sea-level curves that are similar to the four different regions identified by Lambeck (1993):
• At near-field sites (Zone I in Figure 2.8) sea-level changes are dominated by ice-load effects, meaning that late-glacial and postglacial relative sea level is falling because of the rising land. This characterises many areas of Atlantic Canada and northern Europe (e.g. Figure 2.3).
• The intermediate-field sites (Zone II in Figure 2.8) correspond to the forebulge region around large Northern Hemisphere ice sheets. The forebulge both decreases in size and migrates back towards the ice sheet centre following ice retreat. In areas affected by a forebulge, relative sea level rises into the Holocene although at gradually decreasing rates. Forebulge areas have the most complex late Pleistocene sea-level records.
• At ice-margin sites (Transition Zone I–II in Figure 2.8) the relative sea-level curves vary greatly depending on location, and range from a progressive fall (curve I–IIa) to a progressive rise (curve I–IIe). This is typical of many sea-level curves around Britain and Ireland.
• In far-field sites (Zones III–VI in Figure 2.8) glacio-eustatic changes in sea level are considerably greater than glacio- and hydro-isostatic effects. This is the reason why eustatic sea-level curves use data from far-field locations like Barbados and New Guinea. Here, relative sea-level rise predominates during deglaciation, often followed by a slight relative sea-level fall of hydro-isostatic origin during the late Holocene (e.g., Figure 2.7).
Holocene sea-level rise has played a significant role in reworking sediment from the continental shelf and building barrier islands, beaches and sand dunes, and infilling estuaries. Many of the landforms found along glaciated coasts in Europe, New Zealand and North America first started to accumulate around the mid-Holocene when sea levels stabilised. Coincidently, this is also the period of human development when prehistoric peoples were occupying the coastal zone and exploiting its food and resources, and developing coastal and river-mouth settlements (see Chapter 12). This highlights the close relationship between Holocene sea-level rise, coastal change and human activity.
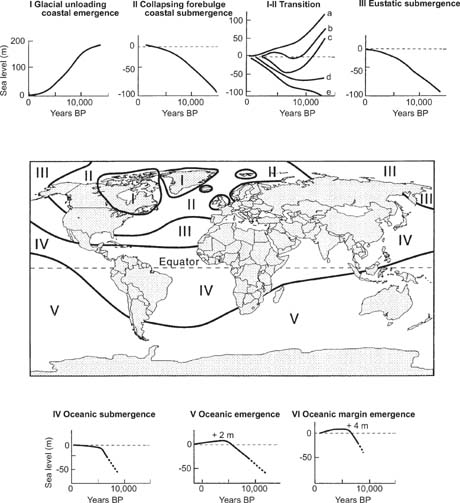
Figure 2.8 Global variation in relative sea-level rise derived using an isostatic model under the assumption that no eustatic change has occurred since 5000 years BP and that the Earth’s mantle has a constant viscosity. Zone VI includes the landward margins of continental shelves in zones III, IV and V. Emerged beaches are predicted for Zones I, III, V and VI. (From Komar, 1998; modified from Clarke et al., 1978.) (Copyright © 1978 Academic Press, reproduced with permission.)
The geomorphology and sedimentology of the present coastline are prima-rily the result of the Holocene sea-level history. Of most interest to coastal communities, however, are present and future patterns of sea-level change. Over the last 100 years a global network of tide gauges has developed, allowing historic sea-level changes to be plotted. At present, around 2000 tide gauges are operative worldwide, although the longest records are almost all located in the Northern Hemisphere. Monthly and yearly means from most tide-recording stations are stored in the data base of the Permanent Service for Mean Sea Level (PSMSL) at Birkenhead, UK, and are publicly available from their web site (www.psmsl.org).
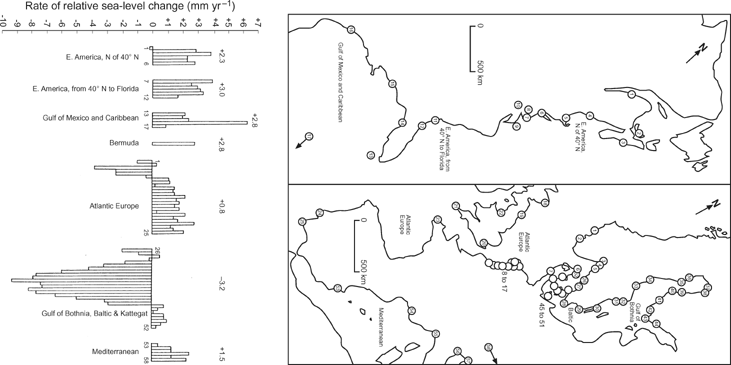
Figure 2.9 Locations of tide gauge stations with records starting earlier than 1925 and the associated trends of relative sea-level change. The number above the sea-level change graph are average rates of change in each region (+ = relative sea level rise; - = relative sea level fall). The number near the zero line in the sea-level change graph correspond to the tide gauge number in the location graph. (Modified from Pirazzoli, 1989.)
Tide gauges record changes in relative sea level at the coast, and a central problem in identifying trends in eustatic sea level from tide gauge data is in removing the isostatic trend from the data. For example, Figure 2.9 shows local trends in sea level derived from a large number of long-term tidal records. Most stations exhibit a rise in sea level across these records, with rates of 1–3 mm yr-1, but the tide record in the Baltic Sea region indicates a fall in sea level of up to 9 mm yr-1 caused by isostatic uplift.
Due to uncertainties in determining the isostatic effects, it is difficult to obtain a reliable figure for eustatic sea level rise. Nevertheless, isostatic land-level changes can be accounted for by using geological data directly from sites adjacent to tide gauges and subtracting trends in land level from the relative sea-level change. Figure 2.10 shows the results of two methods of estimating the eustatic component of sea-level rise. The first method takes the mean of 130 station trends (corrected for changes in land level), resulting in a rate of sea-level rise over the last 100 years of 1.2 mm yr-1. In the second method, the corrected data are averaged annually into a composite global mean sea-level curve and the slope of the curve is estimated to be 1.0 mm yr-1.
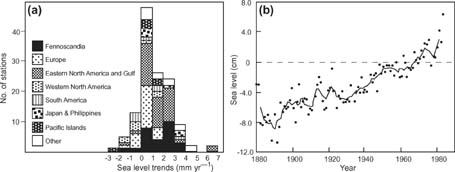
Figure 2.10 (a) Histogram of the number of tide gauge stations versus sea-level trends. (Modified from Gornitz, 1993.) (b) Composite eustatic mean sea-level curve over the period 1880–1980 (solid dots) with five-year running mean (solid line). The period 1951–70 has been used as the reference period. (Modified from Gornitz, 1995.)
More recently, satellite data have been used to estimate sea-level change. The main advantages of satellites over tide gauges are that satellites can have global coverage and include the open ocean, whereas the number of tide gauges is limited and found in coastal areas only. Satellite missions such as TOPEX/Poseidon and Jason use radar altimetry to measure high-resolution variations in the level of the sea surface (Figure 2.11). Seasonal changes are related to the water balance of the ocean (evaporation versus precipitation), but longer term (annual to decadal) variations are related to changes in surface water circulation and ocean heating. For example, during an El Niño event increased warming of equatorial Pacific waters leads to positive and negative sea-level anomalies on the order of 0.5–1.0 m (Schwing et al., 2002). There are also sea-level anoma-lies caused by ocean circulation. The North Atlantic Current (also called the North Atlantic Drift or Gulf Stream) is an important warm-water current track-ing across the Atlantic from the Caribbean Sea. The combination of water mass transport and warmer sea surface temperatures mean that sea level within the current rise about 15 cm higher than sea level outside it (Fu et al., 1987).
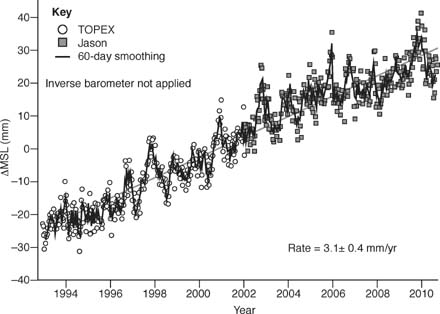
Figure 2.11 Variations in sea level in the period 1993–2010 from TOPEX and Jason satellite data with the seasonal signal removed. Data are available from the TOPEX website at http://sealevel.colorado.edu/results.php (Copyright © 2010 University of Colorado, reproduced with permission.)
The coastal zone is one of the most densely populated regions of the Earth and the ability to predict future change in sea level is of importance to the global community. Not surprisingly, much research effort and funding is directed towards making such predictions. A simple extrapolation of existing trends in sea-level rise (1–2 mm yr-1) into the future is inadequate, not least because recent records show a non-linear trend in sea-level rise. This approach also ignores time lag effects in the atmosphere and ocean to increased greenhouse gas concentrations, and does not consider future greenhouse gas emission rates.
Tide gauge data show the upward trajectory of sea-level change over recent decades. The Fourth Assessment Report (published in 2007) of the Intergovernmental Panel on Climate Change (IPCC) concludes that the average rate of eustatic sea-level rise during the twentieth century as a whole was 1.7 mm yr-1 but that this rate increased dramatically from the 1990s, with sea-level rise in the period 1993–2003 amounting to 3.1±0.7 mm yr-1 (Bindoff et al., 2007). Comparison of the present rate of sea-level rise with the geological rate over the last 2000 years (0.1–0.2 mm yr-1) implies a relatively recent acceleration in the rate of sea-level rise. Of this rise, approximately half is by thermal expansion of the ocean due to higher water temperatures (both on the surface and at depth). This reflects the increase in global surface temperature of 0.74°C over the century 1906–2005. Approximately one quarter of the total sea-level rise is through enhanced melting of small glaciers and ice caps (Figure 2.12). The relatively low (or even negative) contributions of the Greenland and Antarctic ice sheets may reflect their larger size which makes them less vulnerable to present climate change, and a possible increase total ice volume due to increased precipitation. However, more recent analysis by Rignot et al. (2011) shows that ice mass loss from Greenland and Antarctica is increasing and will be the major contributor to sea-level rise over the next decades.
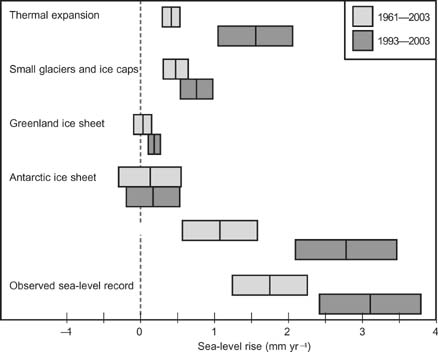
Figure 2.12 Estimates of the contribution to total sea-level rise by various factors for total sea level in the years 1961–2003 (light grey boxes) and 1993–2003 (dark grey boxes). The vertical line is the mean estimated value, with the width of the box representing the degree of error. (Redrawn and modified from Table 5.3 in Bindoff et al., 2007.)
The importance of obtaining good estimates of future sea-level rise has been one of the main aims of the IPCC. To obtain reliable predictions of future sea-level rise, coupled atmosphere-ocean general circulation models (AOGCMs) have been run for a range of CO2 emission scenarios. These models consider interactions between the ocean, atmosphere and land surface with respect to global energy balance, biosphere and hydrological cycle, including future patterns of temperature and precipitation. Results show that thermal expansion is a major factor contributing to future sea-level rise, with rates of 1.3±0.7 mm yr-1 in 2000–2020 rising to rates of 1.9±1.0 to 3.8±1.3 mm yr-1 by 2080–2100 (depending on emission scenario) (Meehl et al., 2007). All AOGCM outputs show that there is wide spatial and temporal variation in sea-level rise. Smaller rises are noted in the Southern Ocean and larger rises in the Arctic region. The results indicate that sea level is predicted to be 0.18–0.59 m higher than 1990s levels by the 2090s (temperature increase over the same period is 2–3°C).
• Eustatic sea-level changes are worldwide in extent and related to a change in the quantity of ocean water. Relative sea-level changes are of regional/local extent and are mainly related to isostatic adjustments in the Earth’s surface, in particular associated with the increased (decreased) load by expanding (melting) glaciers.
• During the Pleistocene a large number of glacial climate cycles occurred, which caused dramatic fluctuations in eustatic sea level. During warm interglacials, sea levels were relatively high and comparable to today’s sea level. During cold glacials, water was stored in ice sheets and so sea levels were up to 130 m lower than present.
• After the last glaciation, the Earth warmed and glaciers started melting leading to eustatic sea-level rise. This was initially rapid (2 cm yr-1 from 11,000–7000 years BP), but slowed down from 7000–5000 years B P, reaching present sea level at about 6000 years B P.
• Eustatic sea level is presently rising by 2–3 mm yr-1 as a result of global warming. This is expected to accelerate throughout the present century and the Intergovernmental Panel on Climate Change predicts that by the 2090s sea level will be 0.18–0.59 m higher than it was in the 1990s.
 Reflective questions
These questions are designed to test your comprehension of material covered in this chapter. Suggested answers to these questions can be found on this book’s website.
2a. Describe the major controls on sea-level change in (1) arctic and (2) equatorial environments.
2b. Outline some of the problems in distinguishing between eustatic and isostatic controls on sea level.
2c. What can coastal responses to past sea-level change tell us about likely responses to future sea-level change?
2d. Why might there be uncertainty in IPCC estimates of future contributions to sea-level rise?
Bindoff, N.L., Willebrand, J., Artale, V., Cazenave, A., Gregory, J., Gulev, S., Hanawa, K., Le Quéré, C., Levitus, S., Nojiri, Y., Shum, C.K., Talley, L.D. and Unnikrishnan, A., 2007. ‘Observations: Oceanic Climate Change and Sea Level’. In: S. Solomon, D. Qin, M. Manning, Z Chen, M. Marquis, K.B. Averyt, M. Tignor and H.L. Miller (eds) Climate Change 2007: The Physical Science Basis. Contribution of Working Group I to the Fourth Assessment Report of the Intergovernmental Panel on Climate Change. Cambridge University Press, Cambridge, 386–432. (This is the IPCC chapter that relates specifically to sea-level change, available from www.ipcc.ch/.)
Gehrels, R., 2010. ‘Sea-level changes since the Last Glacial Maximum: an appraisal of the IPCC Fourth Assessment Report’. Journal of Quaternary Science, 25, 26–38. (This is a useful commentary alongside the IPCC chapter, above.)
Chappell, J. and Shackleton, N.J., 1986. ‘Oxygen isotopes and sea level’. Nature, 324, 137–140. (This is a classic paper describing glacial-interglacial sea-level cycles.)
Pirazzoli, P.A., 1996. Sea-level changes: The last 20,000 years. Wiley, Chichester. (Comprehensive review of Pleistocene and Holocene sea-level changes.)


 Case Study 2.1 Isostatic uplift and sea-level change in Scotland


