|
This chapter presents the major properties of wave-dominated and tide-dominated estuary types with respect to their hydrodynamic processes and resultant landforms. Features present within the intertidal zone are first described, and then estuary hydrodynamic processes are discussed, including the interactions of fresh river and saline marine water. Tidal and sediment dynamics within estuaries are described in detail because they control patterns of water circulation and deposition of fine sediments.
|
Dalrymple et al. (1992, p.1132) define an estuary as ‘the seaward portion of a drowned valley system which receives sediment from both fluvial and marine sources and which contains facies influenced by tide, wave and fluvial processes.’ Potter et al. (2010, p.497) adopt a slightly different definition, being a ‘body of water that is either permanently or periodically open to the sea and which receives at least periodic discharge from a river(s)’. Modern estuaries associated with today’s rivers first developed when coastal river valleys were flooded at the end of the postglacial marine transgression. Sea levels stabilised around 6000 years BP, and since that time estuaries have been infilling. Estuaries that received a large sediment influx relative to their accommodation space have completely infilled and are now prograding as coastal deltas (Chapter 6). Estuaries that received a more modest sediment supply still have accommodation space available and are continuing to infill. Sediment can enter an estuary from both the land (river) and the sea (waves and tides). The fundamental difference between deltas and estuaries is that, averaged over many years, the net sediment transport in deltas is seaward whereas in estuaries it is landward. Deltas are progradational systems that are presently extending the coastline, whereas estuaries occupy coastal embayments that are presently infilling.
The possible combinations of coastal processes (river, waves and tides), together with additional processes such as flocculation that are uniquely estuarine, result in a variety of estuary types. As estuaries infill their valleys, an evolving morphodynamic regime further increases this variety. Not surprisingly then, estuaries are among the most complex coastal environments. This chapter presents a summary of estuarine morphology, and discusses major estuarine processes that are not dealt with elsewhere in this book.
In an important paper, Dalrymple et al. (1992) propose that most estuaries can be divided into three zones, termed the inner zone, central zone and outer zone, which have different energy regimes, sediment types and morphologies (Figure 7.1). River processes are most significant at the estuary head (landward end or inner zone) and diminish towards the estuary entrance (seaward end or outer zone). The significance of marine processes has the opposite spatial pattern. Considering fluvial and marine processes together, the energy regime in the inner zone is river-dominated, in the outer zone it is marine-dominated (waves and tides), and in the central zone it is mixed (both tide and river processes). The effect of waves is mostly restricted to the seaward margin of the outer zone. The inner and outer zones are the most energetic and are predominantly zones of sediment transfer. Dalrymple et al. (1992) argue that for estuaries to be infilling, the averaged net bedload transport direction must be landward in the outer zone. This, combined with the net seaward-directed transport in the inner zone, results in sediment convergence in the central zone which is therefore a sediment sink. The inner and outer zones generally contain the coarsest sediment and the central zone the finest sediment.
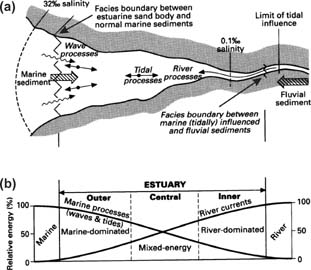
Figure 7.1 (a) Plan view of an estuary showing facies and hydraulic boundaries. (b) Chart showing the change in energy regime along the estuary axis, i.e. the changing mix of wave, tide and river processes. (From Dalrymple et al., 1992.) (Copyright © 1992 Society for Sedimentary Geology, reproduced with permission.)
7.2.1 Estuary classification
The physical properties of estuaries vary dramatically depending on palaeovalley configuration, entrance conditions and degree of infilling. The first is determined by geological inheritance, the second by the predominance of waves or tides at the coastline, and the third by the amount of available sediment. There are many estuary classification schemes, but here we use the one proposed by Dalrymple et al. (1992) which considers both morphology and processes. The two end-members of the scheme are wave- and tide-dominated estuaries, each of which has characteristic energy regimes and morphology. The terms wave- and tide-dominated are based on assessment of the relative energy levels of waves and tides in the outer zone of the estuary, which may experience spatial and temporal variability. In reality, most estuaries may show only some elements of the archetypes discussed here, and palaeovalley configuration and sediment supply may be of greater importance.
The outer zone of a wave-dominated estuary consists of a barrier system that may be subject to washover during storms and a tidal inlet (Figure 7.2). Barriers are considered in more detail in Chapter 8. Deltas associated with the jet-like tidal flow through the narrow inlet develop both outside (ebb-tide delta) and inside (flood-tide delta) of the estuary (Figure 7.3). The outer zone is dominated by wave processes, but their effects decline rapidly with distance from the coast, due to wave breaking over both the barrier and tidal deltas. There is also a rapid decline in tidal energy with distance from the coast due to the restricted inlet cross-section, but some tidal energy persists into the estuary to shape the flood-tide delta. The outer zone is often composed of medium-size marine sands. A distinguishing characteristic of wave-dominated estuaries is the very low energy level in the central zone. If the estuary is relatively young with high accommodation space, a deep central mud basin accumulates the finest sediments, analogous to a prodelta environment. If the estuary is mature, then the central zone is infilled and dominated by salt marshes or mangrove flats composed of predominantly muddy sediments. The inner zone consists of a bay-head delta deposited by the river flow exiting the alluvial valley, typically as a plane jet. The morphological features previously described for the plain and front environments of fluvial-dominated deltas (Section 6.3) can also be recognised in bay-head deltas within wave-dominated estuaries, albeit at a generally smaller-scale.
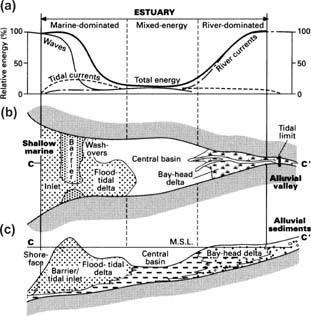
Figure 7.2 (a) Chart showing the change in energy regime along the axis of a wave-dominated estuary. (b) Plan view of the estuary showing positions of principal morphological features. (c) Section view along the estuary axis showing stratigraphy. (From Dalrymple et al., 1992.) (Copyright © 1992 Society for Sedimentary Geology, reproduced with permission.)
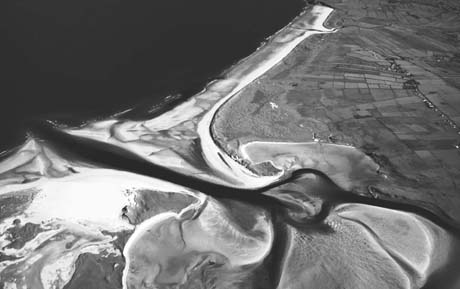
Figure 7.3 Oblique air photo of an estuary mouth in western Ireland showing the prominent flood-tide delta. (Image copyright © 2010 Irish Marine Institute, reproduced with permission.)
The outer zone of a tide-dominated estuary consists of linear sand bars that delineate tidal channels (Figure 7.4). The appearance is similar to a tide-dominated delta but these bars do not extend beyond the drowned valley, since the system is infilling a coastal embayment rather than building out the coastline. This outer zone is dominated by tidal processes, and tidal energy often increases landward due to tidal shoaling (Section 7.3.2). Although waves are subordinate, their influence can sometimes extend farther into a tide-dominated estuary, simply because the entrances of these estuaries are more open than wave-dominated estuaries. Due to high-energy tidal currents in the outer zone, the sediment is predominantly sand. Wave energy in the central basin is insignificant, whereas tidal energy is still relatively high, hence the central zone of tide-dominated estuaries is more energetic than that in wave-dominated estuaries. The relatively straight multiple channels of the outer zone reduce to a single meandering tidal channel in the central zone. This channel is influenced by river processes’ high discharge periods, but is tide-dominated for most of the time and includes extensive intertidal morphology including salt marsh or mangrove flats. The central zone is a sink for fine sediment, but sediment accumulates here not because of a rapid decline in energy, but due to the role of gravitational circulation and tidal distortion on cohesive sediment dynamics (described in Section 7.4). Due to the persistent tidal energy in the central and inner zones, fluvial sediments become progressively mixed with estuarine sediments and there is no discrete fluvial delta. The pattern of straight channels in the inner and outer zones and a meandering channel in the central zone is characteristic of tide-dominated estuaries.

Figure 7.4 (a) Chart showing the change in energy regime along the axis of a tide-dominated estuary. (b) Plan view of the estuary showing positions of principal morphological features. (c) Section view along the estuary axis showing stratigraphy. (From Dalrymple et al., 1992.) (Copyright © 1992 Society for Sedimentary Geology, reproduced with permission.)
7.2.2 Tidal channels and the intertidal zone
Up to this point we have only considered energy gradients and their control on morphology along the estuary axis. At any position along this axis, there is also an energy gradient towards the estuary lateral margins. This is mostly due to the relationship between bed elevation and tidal water levels. For example, consider the channel cross-section shown in Figure 7.5, noting that maximum tidal current velocities generally occur at mid tide, and lowest velocities at slack water around high and low tide. That part of the channel below mean low water is the subtidal zone, which is almost always submerged and conveys water at all tidal stages. The subtidal channel is the most energetic zone, because it conveys both maximum flood and ebb currents. That part of the channel situated between mean low water and mean high water is the intertidal zone, which is alternately submerged and exposed during every tidal cycle. The lower intertidal zone is submerged during maximum tidal currents, but water is shallower and current velocities are correspondingly smaller so its energy level is moderate compared to the subtidal zone. The upper intertidal zone is not submerged for long time periods and is never exposed to the maximum tidal currents, due to its elevation above mid-tide, so its energy level is low. That part of the channel situated above mean high water is the supratidal zone, which is a low energy environment only submerged during spring high tides and is therefore mostly exposed.
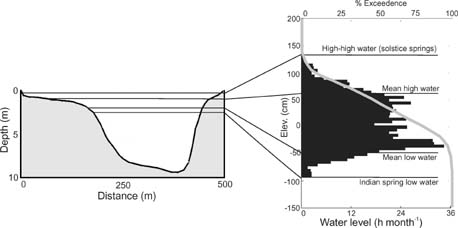
Figure 7.5 Tidal patterns at Gentlemans Halt, Hawkesbury River, New South Wales, Australia. Left panel shows a cross-section of the estuary channel. Right panel shows a histogram (black bars) and percentage-exceedence curve (grey line). The histogram represents the number of hours per month that the water level is located at each elevation in the intertidal zone. The percentage-exceedence curve shows the percentage of time in the month that each elevation in the intertidal zone is submerged.
While tidal currents are the most important energy source in estuaries, small wind waves breaking in shallow water along channel margins can cause considerable erosion. At Gentlemans Halt (Australia), for example, the water level is most often located just above mean low water and just below mean high water (Figure 7.5). These two locations on the intertidal profile therefore experience the effects of wind waves most often, and so are marked by local increases in profile steepness due to erosion. Similarly, the lower intertidal zone is most often exposed to scour by maximal tidal currents and is therefore steeper than the upper intertidal zone.
In most estuaries the lower intertidal zone is devoid of vegetation, due to high bed shear stress preventing seedlings taking anchor in the sediment. The upper intertidal zone is less energetic, and in tropical and subtropical environments is frequently colonised by mangroves (Figures 7.6 and 7.7a), which are halophytic (salt-tolerant) tree and shrub species that have developed growth habits and physiological strategies to survive in saline or brackish conditions. Rhizophora species have prop or aerial roots that provide a large surface area for oxygen absorption, and salt water is excluded by high osmotic pressure within the plant’s body. Avicennia species have vertical, above-ground roots known as pneumatophores, which help anchor the plant into the substrate. Excess salt is extruded from the sap and leaves. Both mangrove types can trap sediment and buffer erosion by waves and storms (see Case Study 11.1). It is common for Avicennia to grow on exposed channel margins with Rhizophora growing in more sheltered positions. In temperate environments the same ecological niche is occupied by salt-tolerant grasses and reeds known collectively as salt marsh (Figure 7.7b) that extends from the upper intertidal to supratidal zones. Plants found here have to cope with submergence during high tide, which restricts sediment aeration and prevents gas exchange, and exposure during low tide, which leads to desiccation. Adaptations to these conditions commonly include high osmotic water pressure and leaf succulence which reduces water loss. Typical salt marsh species such as Salicornia and Spartina perform a similar function as mangroves by trapping sediment and stabilising estuary margins. In subtropical environments salt pans may develop if localised salt concentrations become too high for even the most salt-tolerant species to survive.
The upper intertidal or supratidal zones may be drained by small intertidal creeks that feed into the main estuary channel (Figure 7.6). Due to their elevation these creeks are dry for a significant part of the tidal cycle. At high water, when the creeks are full (or overflowing on spring tides), the tidal current is usually slack. The strongest currents occur late in the falling tide, which occurs because the water level in the main channel drops more quickly than the water can drain from the tidal flat, resulting in a strong hydraulic gradient which can drive currents with peak velocities of up to 1 m s−1 (French et al., 1993). Current speeds across the tidal flat and marsh, outside of the channels, rarely exceed a few cm s−1. The sudden change in flow conditions as the water level moves from the channel confines and onto the intertidal platform results in a decrease in suspended sediment concentration, deposition rate and grain size with distance from the channel. Sediment grain size typically grades from mixed sand and mud to primarily mud farthest from the channel (Figure 7.8). While the sedimentological behaviour shown in Figure 7.8 is generally correct, it does not consider local topography and roughness affecting the flow and which can have a significant effect on the rate of vertical accretion in mangroves and salt marshes (Case Study 7.1).
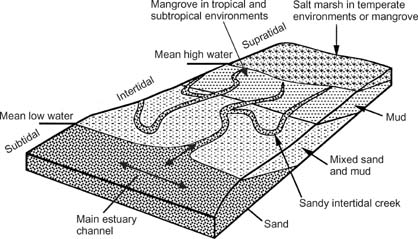
Figure 7.6 Diagram showing typical morphology and sediment distribution for the intertidal margin of an estuary channel. (Modified from Boggs, 1995.)

Figure 7.7 (a) In subtropical and tropical environments, the upper intertidal and supratidal zone may contain mangrove species like these in the Hawkesbury River, New South Wales, Australia. (Photo: M.G. Hughes.) (b) In temperate environments, the supratidal zone may consist of salt marsh such as in this example from Gibralter Point, southwest England. (Photo: G. Masselink.)
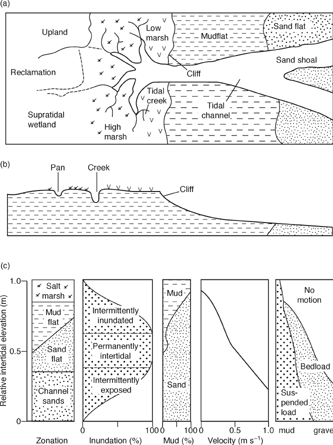
Figure 7.8 Variations in sedimentary properties across a typical muddy shoreline. (a) Schematic plan view of low-tide sandflat, intertidal mudflat and upper intertidal saltmarsh. (b) Schematic cross-section across the area in part a). (c) Variations in sediment properties, inundation period, mud content, water velocity and sediment behaviour. (From Woodroffe, 2002. Based on data from the Wash and Bay of Fundy after Amos, 1995.) (Copyright © 2002 Cambridge University Press, reproduced with permission.)
 Case Study 7.1 Salt marsh accretion rates
The potential accelerated rate of sea-level rise in the near future makes salt marshes particularly vulnerable environments to flooding and erosion. The expected response of these environments to sea-level rise depends primarily on the rate of sediment supply. If sediment supply matches the rate of sea-level rise then vertical accretion of the salt marsh surface will maintain the marsh area. If the sediment supply rate is insufficient then the marsh will erode and become drowned. The actual response of salt marsh systems will reflect the heterogeneity of the intertidal morphology (Figure 7.8). One of the longest time-series of measurements of salt marsh accretion comes from a macrotidal, back-barrier salt marsh (Hut Marsh) on Scolt Head Island, Norfolk, east England (Figure 7.9).

Figure 7.9 (a) Map showing geomorphological setting of Hut Marsh on Scolt Head Island, north Norfolk, England. (b) Map showing five-year mean vertical-accretion rates measured on Hut Marsh (1986–91). (From French et al., 1995.) (Copyright © 1995 Coastal Education and Research Foundation, reproduced with permission.)
Across Hut Marsh, French et al. (1995) found that there is an inverse relationship between accretion rate and marsh elevation. The north, east and west margins of Hut Marsh are the most elevated, and have accretion rates of 0–3 mm yr-1 (Figure 7.9b). The widest range in accretion rates occurred around the mid-tide level, because accumulation rates consistently higher than average are found along the margins of intertidal creeks. The centre and southeast corner of Hut Marsh display the densest networks of inter-tidal creeks, and marsh accretion rates in these areas reach 6 mm yr-1. These larger accretion rates result from high suspended sediment concentrations in the channelised flows (c. 1000 mg l-1), which spill overbank on spring high tides and settle adjacent to the channel margin. Similar spatial patterns of marsh accretion are seen in a high-resolution LiDAR topographic study from the River Dee estuary, northwest England (Moore et al., 2009).
7.2.3 Estuary evolution and infilling
Sediment accumulation within estuaries over decadal to centennial time scales results in estuary infilling, and their morphodynamic behaviour evolves towards that of a coastal delta. This can be observed and monitored in two different ways. First, by a decrease in estuary area caused by progradation around estuary margins. This can take place by growth of a bay-head delta or by salt marsh accretion. Second, by estuary shallowing, which can be tracked by changes in bathymetry. Both these processes result in a decrease in size of the tidal prism, which can have implications for long-term changes in tidal harmonics and water quality within the estuary. Lane (2004) shows how the River Mersey estuary (northwest England) changed in the period 1906–97. Based on similar map and chart data, the estuary’s volume decreased by 0.1 per cent per yr-1 over this period but there was no change in the dominant M2 and S2 tides. This suggests the estuary is still maintaining hydrodynamic stability despite changes in volume.
Dalrymple et al. (1992) believe that, as estuaries infill and their morphody-namic behaviour changes from an estuary to a delta, the meandering tidal channel in the central zone of tide- and mature wave-dominated estuaries also changes. The presence of tight meanders indicates that net bedload transport is landward in the channel seaward of the meanders, so the system is behaving as an estuary. The absence of the meandering zone indicates that the net bedload transport is seawards, so the system is behaving as a delta.
Wave-dominated estuaries infill through seaward progradation of the bay-head delta and landward extension of the flood-tide delta (Figure 7.10). Eventually, fluvial and marine sands bury the central basin muds. As the central basin shrinks, the tidal channel in the outer zone links up with the fluvial channel in the inner zone to produce a meandering tidal channel. At this point in time, from its seaward to landward end, the wave-dominated estuary has the straight-meandering-straight tidal channel that characterises tide-dominated estuaries. From this time on, the evolutionary path of the two estuary types is similar. Tide-dominated estuaries begin by rapidly infilling their outer zone through energetic tidal currents that redistribute sand into broadening and seaward-extending sand ridges. As this process continues the three estuary zones steadily migrate seaward along the drowned valley, progressively infilling it. The position of the meandering tidal channel also migrates seaward, eventually reaching the present coastline where the straightened channel upstream can then convey sediments directly to the coastline and begin building a delta. Infilling of wave-dominated estuaries is also enhanced where increased wave energy at the estuary mouth increases littoral drift and closes off the inlet.
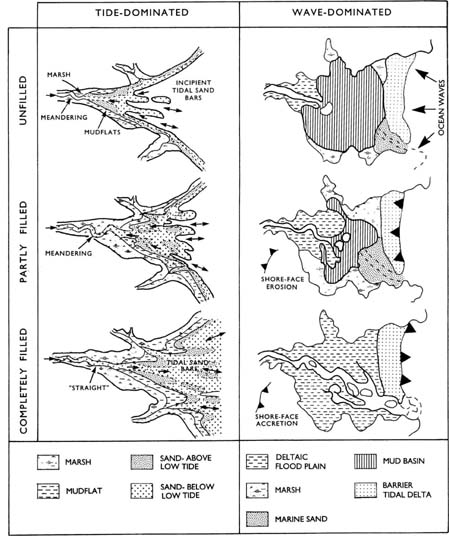
Figure 7.10 From top to bottom, stages in the filling of a wave- and tide-dominated estuary. (From Trenhaile, 1997. Originally modified from Roy et al., 1980 and Dalrymple et al., 1992.) (Copyright © 1997 Oxford University Press, reproduced with permission.)
7.2.4 Controls on estuary evolution and infilling
Patterns of estuary evolution and infilling reflect the role of external forcing, on long time scales, by sea-level change, tectonic subsidence, fluvial sediment supply and sediment compaction; and hydrodynamic processes of tides and marine–fresh water interaction that contribute to sediment transport and deposition within the estuary (described in Section 7.3). An important influence on hydrodynamic processes is estuary shape, which reflects regional geologic structure. Several studies have examined geologic influences on estuary dynamics. For example, the narrow bedrock channel of the Guadiana river estuary (Portugal) strongly attenuates the incoming tide and gives rise to net seaward sediment transport that is quite different to the tide- and wave-dominated estuary models (Garel et al., 2009). Burningham (2008) shows that the location of river channels, exposed at low tide in broad, sandy estuaries in northwest Ireland, is strongly controlled by the position of bedrock headlands on the sides of the estuaries.
Climate can influence estuary hydrodynamics, sedimentary processes and geomorphology, in two main ways. First, variations in precipitation within the estuary’s catchment can lead to variations in the amount and timing of river discharge and sediment supply. Such ‘pulses’ of river water and sediment can be associated with single, intense storms or climate cycles such as El Niño–Southern Oscillation. For example, discharge of the Quequén Grande river (Argentina) increases dramatically by a factor of 3 to 12 during El Niño events that bring high rainfall to the catchment, and leads to elevated sea level and enhanced sedimentation in the estuary (Isla, 2008). Second, variations in nearshore wave climate and storminess can drive sediment onshore and help narrow, close, or alter the shape or position of barriers fronting wave-dominated estuaries. For example, in the northeast Pacific wave height and sea level increase and winter storms become more intense during El Niño years. This increases the volume of water exiting on the falling tide in Willapa Bay (Washington State, USA), leading to river channel incision and erosion of the estuary barrier (Morton et al., 2007). Variations in water circulation and sediment transport patterns within estuaries are often sensitive to human activity within the catchment. Estuaries located near urban centres or in agricultural catchments are particularly vulnerable to changes in water quality, and nutrient and sediment transport (Case Study 7.2).
Case Study 7.2 Estuaries under pressure: Chesapeake Bay
Chesapeake Bay is the largest estuary in the USA and is structurally complex, with large variations in width, a shallow average depth of 6.46 m, and water input from 50 major rivers of which the Susquehanna and the Potomac are the most important. The shallowness of the bay and its highly indented coastline mean that water circulation patterns are very complex. The tidal range of the bay is generally less than 1 m, but tidal currents are strongly flood-dominated. In addition, residual currents during neaps are also around 50 per cent stronger than during springs (Li and Zhong, 2009), and low river discharge during the summer and autumn are associated with water stratification and low water quality.
Although the physical geography and water circulation patterns in Chesapeake Bay have contributed to some significant environmental problems, human activity within the watershed is also important. Large cities including Baltimore and Washington DC contribute waste water, sewage, nutrients and heavy metals into the bay. These impact negatively on aqua-culture production and biodiversity.
An important monitor of the vitality of Chesapeake Bay is water quality, which encompasses nutrient and suspended sediment loads, dissolved oxygen content, and chlorophyll level. High nutrient levels in incoming river water causes phytoplankton blooms whose high oxygen demands then lead to low dissolved oxygen content in the bay’s water. Based on the abundance and diversity of diatoms and chemical indicators in estuary sediments, Cooper and Brush (1993) show that sedimentation rates, total organic context and anoxic water conditions (where 0 mg O2 l-1) have changed dramatically since initial European land clearance within the watershed around 1760 AD. Low oxygen content and high nitrogen and phosphorus loads remain a significant issue affecting biodiversity within the bay. In order to address these problems, the Chesapeake Bay Program was set up as an interdisciplinary partnership of bay users, with the aim of increasing water quality and restoring intertidal habitats (http://www.chesa-peakebay.net). This includes regulating water input and water treatment, reducing shoreline erosion, planting aquatic grasses, and encouraging fish migration up tributary rivers.
A key element of estuary hydrodynamics is the mixing of salt and fresh water masses that are delivered to the estuary by tidal and river flows, respectively. In Chapter 3 we discussed how tides are generated, but this does not explain tidal behaviour inside estuaries. We first consider the factors controlling estuarine mixing, and demonstrate how partial mixing can produce estuarine currents that are additional to tide and river flows. We then describe how channel morphology can influence tidal behaviour.
7.3.1 Stratification, mixing and gravitational circulation
Whether fresh river water and saline coastal water remain segregated or combine in an estuary is determined by the effectiveness of molecular diffusion and turbulent mixing. Molecular diffusion refers to the movement of salt molecules from areas of high to low concentration in the salt and fresh water bodies, respectively. The length scale of diffusion mixing is very small. Turbulent mixing is far more effective and involves the movement of parcels of fresh water into the salt water body and vice versa by eddies, which leads to partially- or well-mixed estuaries. When these processes are ineffective, the two water masses remain segregated and the estuary is stratified.

Figure 7.11 Diagram illustrating three main types of estuaries based on density stratification: (a) stratified, (b) partially-mixed and (c) well-mixed estuary. Water masses are indicated by shading on the front face of each block. Salinity contours (arbitrary scale) are indicated by thin lines on the side face of each block in (a) and (b) and on the top face of the block in (c). In (a) and (b) vertical mixing is indicated by thin arrow and non-tidal currents are indicated by thick arrows. (Modified from Pethick, 1984.)
Stratified estuaries commonly occur along microtidal coasts where there is sufficient river discharge to develop a fresh surface water mass, but the discharge rate is insufficient to completely expel the lower saline water mass from the estuary or generate sufficient turbulence to cause effective mixing (Figure 7.11a). Salinity contours (isohalines) are horizontal and close together, forming a halocline. A salt wedge, defined on the upper surface by the halo-cline and on the lower surface by the estuary bed, thins up the estuary where it sits below the fresh river water, and is generally stationary, although it may migrate in response to variations in fluvial discharge or the tide. If it becomes too dynamic, however, turbulence is generated and the stratification breaks down. In stratified estuaries, mixing occurs along the interface between the fresh and salt water mostly by molecular diffusion, and is therefore rather weak, which helps to maintain stability of the stratification.
Partially-mixed estuaries develop if the tidal energy is sufficient to cause increased shear along the halocline and the development of internal waves (e.g. Figure 6.11a). These waves, and the turbulence caused by shearing between river/tidal flow and the estuary channel, results in considerable mixing (Figure 7.11b). Salinity contours dip steeply near the surface and near the bed, marking layers of predominantly fresh and salt water. In the central part of the water column, however, the salinity contours are gently sloping and indicate mixing between the fresh and salt to produce a brackish layer. The salinity decreases up the estuary at both the surface and at depth.
Well-mixed estuaries occur when mixing is so effective that the salinity gradient in the vertical direction vanishes entirely. If well-mixed estuaries are sufficiently broad for the Coriolis force to be effective, the river and sea water may become horizontally segregated (Figure 7.11c). This is best developed on the flood tide when the fresh and marine water masses are flowing in opposite directions. Looking downstream in the Southern (Northern) Hemisphere, the river flow is steered by the Coriolis force towards the left (right) bank and the landward-directed flooding tide is deflected left (right) towards the opposite bank. During the ebb in both hemispheres, both the tide and river flow are deflected towards the same bank.
Case Study 7.3 Spencer Gulf, Australia: An inverse estuary
The small volume of river water draining into the Spencer Gulf, South Australia, means that saline coastal waters in the Gulf are not significantly diluted, and the salt content in the water at the shallow head of the estuary increases due to high evaporation in this arid, subtropical environment. This results in a strong salinity gradient along the estuary axis, with maximum salinities at the head of the estuary (Figure 7.12).
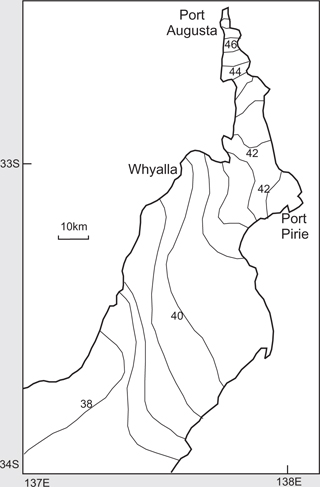
Figure 7.12 Map of Spencer Gulf, South Australia, showing depth-averaged salinity contours in practical salinity units (PSU), March 1984. Ocean water is typically about 35 PSU. Note the increase in salinity northwards toward Port Augusta at the estuary head. (Figure provided by M. Tomczak.)
Given the direct relationship between water salinity and density, a strong salinity gradient corresponds to a strong density gradient. Following ourderivation of the pressure-gradient force in Box 3.1, we can determine the hydrostatic pressure P at any given depth as
P = ρgh
where ρ is water density, g is gravitational acceleration and h is height of water above the depth of interest. Now consider an estuary with a horizontal water surface, but a difference in water density between the entrance and head of the estuary. The hydrostatic pressure at the entrance PE and head PH is, respectively

where ρ is water density at the estuary entrance and Δρ is the difference in density between the estuary entrance and estuary head. The pressure gradient along the estuary is then

Along any horizontal plane in the water column there is a pressure-gradient force produced by the density gradient, which drives a current from the area of high pressure to the area of low pressure. In normal estuaries where salinity decreases towards the head of the estuary it will be a landward-directed current. In inverse estuaries where salinity increases towards the head of the estuary, such as the Spencer Gulf, it is a seaward-directed current.
In some estuaries water circulation is relatively weak compared to tidal currents, but is sufficient to influence the net transport of fine suspended sediment. This gravitational circulation consists of a near-bed current that is directed landward and a surface current that is directed seaward (Figure 7.11b). The circulation is best developed in partially-mixed estuaries because they have a strong horizontal salinity gradient along the estuary axis. The pressuregradient force (Box 3.1) is caused by a gradient in water surface elevation, but in partially-mixed estuaries this force is due to a gradient in water density, which drives water from the high pressure (most saline) region at the estuary entrance to the low pressure (least saline) region at the estuary head. This landward flow is generally only apparent near the bed, because the seaward river flow near the surface usually overwhelms it. In arid environments where fresh water discharge into an estuary may be absent for long periods of time and where there is high evaporation, water salinity can actually increase towards the head of the estuary. This is referred to as an inverse estuary in which the gravitational circulation is directed seawards (Case Study 7.3).
7.3.2 Tidal dynamics in estuary channels
In Chapter 3, we showed that the tide is a shallow-water wave and that its speed C is given by
 |
(7.1) |
thus
 |
(7.2) |
where g is gravitational acceleration, h is water depth, L is tidal wavelength and T is tidal period. For a semi-diurnal tide with a period of 12.42 hours the tidal wavelengths for various water depths are listed in Table 7.1. The Amazon River, Brazil, has a tide-affected channel length of 850 km and can accommodate several tidal wavelengths (Defant, 1961). High tide therefore occurs at several locations along the estuary length at any one time. Most estuaries, however, can only accommodate a single or a fraction of a single tidal wavelength. For example, the Hawkesbury River, New South Wales, Australia, has a tidal length of 145 km and an average depth of 5 m, so it can accommodate about one half of a tidal wavelength. This means that the time of high tide at the estuary head corresponds with low tide at the estuary mouth.
Table 7.1 Tidal speed and wavelength based on linear theory for shallow water waves. Calculations made using Equations 7.1 and 7.2
| Depth (m) |
Tidal speed (m s-1) |
Tidal wavelength (km) |
| 2 |
4.4 |
198 |
| 4 |
6.3 |
280 |
| 6 |
7.7 |
343 |
| 8 |
8.9 |
396 |
| 10 |
9.9 |
443 |
| 15 |
12.1 |
542 |
| 20 |
14.0 |
626 |
| 25 |
15.7 |
700 |
| 30 |
17.2 |
767 |
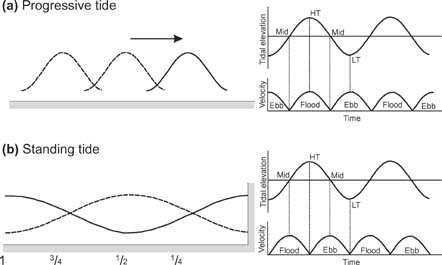
Figure 7.13 Diagram showing the nature of (a) progressive and (b) standing tides. Left-hand panels show the dynamic behaviour of the water level along the estuary. The fractions shown beneath the standing tide indicate the location of the estuary entrance if the estuary length is an integer-multiple of one-quarter the tidal wavelength. Right-hand panels show relationships between tidal water level and current velocity.
Tidal behaviour in long estuary channels (those longer than about one quarter of a tidal wavelength) is quite different to that in short estuaries. In long estuaries, the tide displays progressive and/or standing wave behaviour, whereas in short estuaries a time-varying hydraulic gradient between the tidal water levels outside and inside the estuary produces periodic water level oscillations and currents. In this section we first discuss the tidal dynamics of long estuaries and then the dynamics of short estuaries.
The movement of the tide wave in an estuary controls the vertical change in water level and the horizontal motion of the water column. The vertical rise in water level from low to high tide results from the passage of the wave front, and the fall from high to low results from the passage of the rear of the wave. For roughly half the tidal period, a horizontal current flows in the landward direction and is called the flood current. Similarly, for the other half of the tidal period an ebb current flows in the seaward direction. Between the flood and ebb currents, during which time the flow direction reverses, the current velocity is at its lowest, and is termed slack water. The timing of water level rise and fall relative to the ebb and flood currents depends on whether the tide behaves as a progressive or a standing wave.
If we consider a theoretical tidal channel that is straight and infinitely long, so that no reflection occurs, then the tide behaves as a progressive tide (Figure 7.13a). At successive positions along the estuary the time of high and low tide occurs increasingly later, in other words there is a tidal lag. At any particular point in the estuary, the maximum flood velocity occurs at high tide, the maximum ebb velocity occurs at low tide, and slack water occurs at mid-tide. Progressive tide behaviour can also occur where the estuary is sufficiently long for friction to diminish the height of the tide wave to zero before it reaches a significantly reflective boundary.
As tides travel up-river, they reflect from channel margins, channel bends and a rising river bed. In particular situations the reflected tide and the incoming tide interact to form a standing tide. If we consider a straight channel that has a vertical boundary at the estuary head and an incoming tide that is perfectly reflected at this boundary, the resulting standing wave pattern is shown in Figure 7.13b. There is generally an antinode at the estuary head and a node at the estuary entrance. An antinode will occur if the estuary length is an even multiple of one-quarter of the tidal wavelength, and a node will occur if the estuary length is an odd multiple. Maximum tide range occurs at the antinodes and minimum tide range at the nodes. In the case of a perfect standing tide, the tidal range at the antinodes inside the estuary will be twice the range of the coastal tide outside the estuary. Moreover, the maximum flood velocity occurs at mid-tide on the rising tide, the maximum ebb velocity occurs at mid-tide on the falling tide, and slack water occurs at high and low tide (Figure 7.13b). If the estuary length is one-quarter of the wavelength, then high water occurs simultaneously throughout the estuary, as does low water.
Wright et al. (1973) show that a standing tide is responsible for producing the funnel shape typical of many macrotidal estuaries. In order for a channel shape to be stable the system must maximise entropy, or in other words, eliminate any gradients in the sediment transport rate along the channel. A funnel shape, which narrows and increases in tidal range towards the estuary head, maximises entropy. This increasing tidal range is precisely the behaviour that a standing tide displays in an estuary that is one-quarter of the tidal wavelength (Figure 7.13b). It should be no surprise, therefore, that the length of the estuary funnel is usually one-quarter of the tidal wavelength.
Although there are some estuary configurations that favour either progressive or standing tides, in most cases the tide displays a combination of both. Slack water within estuaries commonly occurs 1–2 hours after high or low tide and maximum current velocity occurs shortly after mid-tide. Often the tide behaviour is more progressive near the estuary mouth and more standing near the estuary head, where most reflection occurs.
Estuary channels tend to narrow and shallow with increasing distance from the coast. The reduction in water depth up-estuary causes a reduction in the speed and hence the wavelength of the tide (Equation 7.1). This is the same effect as with shoaling wind waves (Section 4.5.2). In order to conserve the energy flux, the energy density must increase so that the wave height, or in this case the tidal range, must increase. Opposing this shoaling and convergence effect is friction between the tide and the estuary channel, which dissipates energy and thus reduces the tidal range. These two competing processes are rarely balanced, and three scenarios are possible (Figure 7.14):
• Synchronous estuaries are those where shoaling and friction effects are balanced in the lower estuary so that the tidal range is constant with distance from the coast. Eventually, however, friction becomes overwhelming and the tidal range decreases to zero at the tidal limit (Figure 7.14a).
• Hyposynchronous estuaries are those where friction is of overriding importance everywhere and the tidal range decreases throughout the estuary (Figure 7.14b).
• Hypersynchronous estuaries are those where shoaling is dominant in the lower estuary and there is an increase in tidal range with distance from the coast. Eventually, however, friction overwhelms the shoaling effect and the tidal range decreases to zero at the tidal limit (Figure 7.14c).
Long estuaries tend to be hypersynchronous and short estuaries hyposynchronous, but the synchronicity can be strongly influenced by estuary entrance conditions (Box. 7.1).
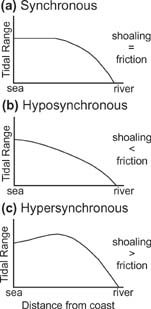
Figure 7.14 Graphs showing tidal range as a function of distance from the coast, which illustrate the definition of: (a) synchronous, (b) hyposynchronous and (c) hypersynchronous estuaries. The relative strength of shoaling versus friction effects is also indicated in each case. The scale on the axes is arbitrary.
Box 7.1 Synchronicity in New South Wales estuaries

Figure 7.15 Left-hand panels show the elevations of mean high water, half tide level and mean low water as a function of distance from the coast for three estuaries in New South Wales, Australia. Tidal range, and thus synchronicity, is indicated by the change in vertical distance between mean high and low water along the estuaries. Aerial photographs of each estuary, highlighting the differing entrance conditions, are shown in the right-hand panels. The estuaries are: (a) Hawkesbury River, (b) Lake Macquarie and (c) Manning River. (Tidal elevations are modified from New South Wales Government, 1992.) (Satellite images are modified from Geoscience Australia’s OzEstuaries database.)
The narrow continental shelf and steep shoreface along the coast of New South Wales (Australia) means that 96 per cent of the offshore wave energy reaches the coastline (Wright, 1976). The modal deepwater significant wave height is 1.5 m, and wave height exceeds 4 m for 1 per cent of the time (Lawson and Abernathy, 1975). Given the energetic wave regime and a microtidal range of only 1.6 m, the estuaries along this coast are all wave-dominated, but the variation in hinterland relief and sediment supply has yielded a variety of estuary entrance conditions.
The flooding of deeply incised river valleys and a low sediment supply have produced long ria-type estuaries with open, hydraulically-efficient, hypersynchronous estuaries (Figure 7.15a). Flooding of broad shallow river valleys and a low sediment supply has produced short barrier-type estuaries with constricted, hydraulically inefficient entrances. Frictional attenuation is of overwhelming importance over the entire short estuary length, and they are hyposynchronous (Figure 7.15b). The flooding of moderately incised river valleys with a large sediment supply has produced long river-type estuaries that also have constricted entrances. These estuaries display mixed synchronicity. Frictional attenuation is significant through the short entrance channel, but once inside the estuary the tidal channel is sufficiently long to permit shoaling to occur (Figure 7.15c).
A common feature of long estuaries is tidal distortion, which is usually expressed as a short rising tide and a longer falling tide. Tidal distortion reflects a progressive steepening of the wave front as it travels along the estuary (Figure 7.16a). Off the coast, the tidal range is a small proportion of the water depth so there is little difference in the speeds of the crest and trough. Inside the estuary, however, the tide is a significant proportion of the water depth and the deeper water under the crest travels faster than the shallower water under the trough. This can be demonstrated by re-writing Equation 7.1 as
 |
(7.3) |
where h̄ is the local tidally-averaged water depth in the estuary and a is tidal amplitude (−a for low tide and +a for high tide). Figure 7.16b shows the speeds of the tide crest and trough and the speed differential as a function of water depth. For water depths of 20 m and more the two speeds are similar and the speed differential tends towards zero, so that the tide is symmetric. In shallower water depths, particularly < 5 m depth, the speed differential increases rapidly with a corresponding increase in tidal distortion. In some cases the distortion becomes so pronounced that the front of the tide is vertical, much like the front of a breaking wave in the surf zone, and is termed a tidal bore. Because the discharge volume through the channel on the flood tide closely matches the discharge volume on the ebbing tide, the inequality between the flood and ebb durations must produce a velocity-magnitude asymmetry between the tidal currents (Figure 7.16c). In order for the discharge volume to be conserved, the shorter duration of the flood current requires it be of larger magnitude than the ebb current.
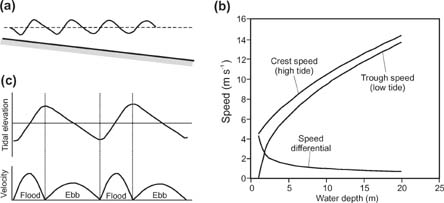
Figure 7.16 (a) Diagram showing the increasing distortion of the tide wave as it progresses along the estuary. (b) Graph showing the velocity of the crest (high tide) and trough (low tide) of a shallow water wave as a function of water depth, calculated using Equation 7.3. The velocity differential between the two increases markedly in very shallow water depths. (c) Graphs showing the relationship between tidal water level and current velocity. Note the velocity-magnitude asymmetry between the dominant flood current and the subordinate ebb current. Scales on the axes are arbitrary.
Wave-dominated estuaries are often short (less than one-quarter the tidal wavelength) and their entrance channel is restricted, so the tide does not display wave-like behaviour inside the estuary. The periodic rise and fall of the water level in these estuaries results in different water levels inside and outside of the entrance. When the coastal tide outside the estuary is rising it eventually becomes higher than the water inside, so the water surface slopes into the estuary and drives the flood current. The total volume of water entering the estuary on the flooding tide is called the estuary’s tidal prism, and it raises the water level in the estuary by an amount roughly corresponding to the volume of water divided by the surface area of the estuary. In a similar fashion, when the tide outside the estuary is falling it eventually becomes lower than the water inside, so the water surface slopes out of the estuary and drives the ebb current. The volume of ebbing water then reduces the water level in the estuary by a corresponding amount.
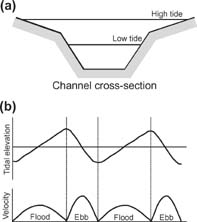
Figure 7.17 (a) Channel cross-section characteristic of short, wave-dominated estuaries in which the volume of water in the intertidal channel is a substantial proportion of the total channel volume. (b) Graphs showing the relationship between tidal water level and current velocity. Note the velocity-magnitude asymmetry between the dominant ebb current and the subordinate flood current. Scales on the axes are arbitrary.
While the coastal tide is the driver of water levels and currents inside short estuaries, it is not the same situation as the tide wave propagating through long estuaries. Nevertheless, tidal distortion and velocity-magnitude asymmetry also occur in short estuaries, although the mechanism is different to long estuaries. Friedrichs and Aubrey (1988) demonstrate that tidal distortion can also develop due to channel shape. Consider a channel that has a large cross-sectional area in the intertidal zone relative to the subtidal zone (Figure 7.17a). Between mid- and high tide, when the maximum flood current velocity is expected to occur, there is inefficient water exchange through the estuary. This hydraulic inefficiency is due to large roughness elements in the upper intertidal zone. As a result the flooding tide is slow to turn and therefore has a longer duration than the ebbing tide (Figure 7.17b). Between mid- and low tide, when the maximum ebb current velocity is expected to occur, almost all of the flow volume is conveyed in the subtidal part of the channel, which is hydraulically efficient. As a result the ebbing tide is quick to turn and therefore has a shorter duration than the flooding tide. If the ebb tide is shorter than the flood tide then conservation of discharge volume demands that it must have the largest velocity-magnitude (Figure 7.17b).
The sense of velocity-magnitude asymmetry can be consistent throughout an estuary or vary along the estuary channel. Estuaries or channel reaches that display a flooding tide that is larger in velocity-magnitude and shorter in duration than the ebbing tide are said to be flood-dominant, whereas those that display an ebbing tide that is largest in magnitude and shortest in duration are ebb-dominant. Flood- or ebb-dominance often translates directly to net landward or seaward sediment transport, respectively. Velocity-magnitude asymmetry need not be large in order to produce a dominant sediment transport direction. In Section 5.5.3 we showed that sediment transport rate is related to stream power, or product of the flow velocity and bed shear stress (Equation 5.33). Since the bed shear stress is related to the flow velocity squared (Equation 5.21), the sediment transport rate is related to the velocity cubed. Thus a small difference in velocity-magnitude asymmetry can lead to a large net difference in sediment transport. In general, flood-dominant estuaries tend to infill their entrance channels by continually pushing coastal sediment landward and thus are often intermittently closed, whereas ebb-dominant estuaries tend to flush sediment seawards from their entrance channels and thus are often stable (Friedrichs and Aubrey, 1988). This relationship between flood- or ebb-dominance and net sediment transport direction really only holds for sandy sediments, for which there is a direct and consistent relationship between bed shear stress and sediment transport rate. In the case of finer, cohesive sediments there are other factors that complicate the prediction of net sediment transport based on velocity-magnitude asymmetry.
In some estuaries there is a well-defined zone in which the suspended sediment concentration (i.e. water turbidity) is on average higher than the waters farther seaward or landward (Figure 7.18). This turbidity maximum zone (TMZ) has suspended sediment concentrations of the order of 100 mg l−1 in microtidal estuaries such as the Hawkesbury River, Australia (Hughes et al., 1998), and up to 20,000 mg l−1 in macrotidal estuaries such as the River Severn, UK (Kirby, 1988). The position of the TMZ varies with tidal stage and river discharge (Figure 7.18). for example, the TMZ in the River Seine (France) moves seaward when the river discharge increases, and oscillates back and forth during the ebb and flood stages of each spring tide (Avoine, 1981). The magnitude of the peak suspended sediment concentration observed in the TMZ is determined by the amount of fine sediment stored in the zone and the strength of the tidal currents available to stir the sediment into suspension.
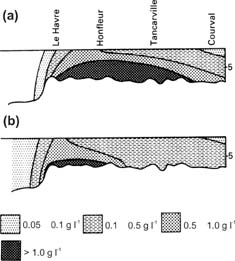
Figure 7.18 Section view along the axis of the Seine Estuary, France, showing the TMZ during two different river discharges: (a) 200 m3 s−1 and (b) 800 m3 s−1. (From Dyer, 1994; modified from Avoine, 1981.) (Copyright © 1994 Blackwell Publishers, reproduced with permission.)
7.4.1 Generation mechanisms
In partially-mixed estuaries, gravitational circulation results in a weak seaward-directed flow in surface waters and a weak landward-directed flow in bottom waters (Figure 7.19). If the superimposed tidal currents are approximately symmetrical, this gravitational circulation is sufficient to control the net transport of suspended sediment. Fine sediment brought downstream by the river will begin to settle upon reaching the estuary. Nevertheless, once the sediment settles to the bottom waters it will experience a net transport landward over many tide cycles. There is a null point in the estuary where the near-bed river current and the near-bed part of the gravitational circulation are roughly equal in their competency to transport sediment. Since the currents are equal but opposite in direction, this null point is where the sediment carried landward by the gravitational circulation will accumulate. In reality tidal currents smear the null point along the estuary axis into a null zone, or TMZ, that is roughly the dimension of the tidal excursion length (the horizontal distance a parcel of water is moved over a tide cycle). The TMZ is located near the landward limit of salt intrusion, usually where water salinities are in the range 1–5 ppt, and thus insufficient to competently drive the gravitational circulation any farther landward. In macroti-dal estuaries the role of tidal distortion in generating a TMZ becomes paramount. In long estuaries, the tidal distortion is such that flood currents display the largest velocities, although they are of shorter duration than ebb currents. The farther landward the tide travels, the more enhanced this velocity-magnitude asymmetry and resultant sediment flux becomes (Figure 7.20). Averaged over many tide cycles, residual sediment transport is landward along the estuary, so the null point in macrotidal estuaries is located farther landward than in microtidal estuaries.
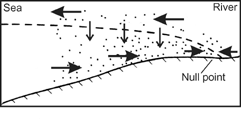
Figure 7.19 Section view of a partially-mixed estuary showing the pattern of non-tidal currents (bold arrows), sediment settling (thin arrows) and the position of the null point for suspended sediment transport. The concentration of suspended sediment is indicated by the concentration of dots. (Modified from Dyer, 1986.)
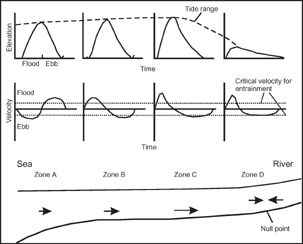
Figure 7.20 Section view of a well-mixed macrotidal estuary showing the change in tidal distortion, velocity-magnitude asymmetry, and net sediment transport direction along the length of the estuary. (Modified from Allen et al., 1980.)
7.4.2 Entrainment and velocity-suspension lags
The TMZ is always most active and suspended sediment concentrations are always largest during spring tides. During neaps, the suspended sediment concentrations usually decline dramatically, and in some cases the turbidity maximum may disappear altogether. Although the link between the magnitude of tidal current velocities and suspended sediment concentration in the TMZ is obvious, it is not straightforward. For example, over a spring-neap tidal cycle in the Tamar Estuary, southwest England, the maximum and minimum suspension concentrations in the TMZ lag behind the timing of maximum and minimum tide range by up to several days (Uncles et al., 1994). Moreover, within a single tide cycle, the maximum and minimum concentrations lag behind the timing of maximum and minimum current velocity by up to several hours. These velocity-suspension lags suggest complexity in the sediment entrain-ment process that goes beyond our discussion in Section 5.5.1, and arises from the cohesive nature of the fine sediments that dominate the TMZ.
Dyer (1998) describes several factors unique to cohesive sediments that can lead to velocity-suspension lags. For example, sediment compaction increases and porosity and water content decrease with depth in a muddy substrate. We discussed in Section 5.5.1 how the entrainment of cohesive sediment depends on these bulk properties. Sediment at the surface is least compacted and has the highest water content so it is most easily entrained, but this source can become rapidly exhausted. As the bed is eroded, more compacted and resistant sediments become exposed, thus requiring increasingly larger shear stresses to sustain the same suspension concentration. This can lead to a situation where sediment already in suspension can be maintained by shear stresses smaller than those required to erode the bed. Another important factor is the low settling velocity of silts and clays. The fact that it may take longer for a suspension to settle than it takes the tide to accelerate, decelerate and reverse direction can lead to complex time-lag relationships between bed shear stress and suspension concentration. In summary, the combined effect of cohesive sediment behaviour and unsteady tidal currents means that the suspension concentrations in the TMZ are rarely in equilibrium with hydrodynamic forcing. This is particularly true of muddy, macrotidal estuaries that have highly-concentrated suspensions (e.g. Allen et al., 1980).
7.4.3 Settling of highly-concentrated suspensions: Fluid muds
When suspended sediment is settling during slack water, near bed concentrations in the TMZ of some estuaries reach levels greater than 10 g l−1. These highly-concentrated near-bed suspensions are termed fluid mud, and they have a different settling behaviour to the more common dilute suspensions. When the tidal current goes slack, the suspension goes through a sequence of settling, deposition and consolidation. The suspension may start out being relatively uniform with depth, but eventually an interface develops between clear water above and the suspension below (Figure 7.21). This interface, termed the lutocline, marks a sharp vertical change in suspended sediment concentration and the fluid’s bulk density. Above the lutocline, sediment is free to settle at its single particle or aggregate fall velocity. Below the lutocline, the sediment experiences hindered settling, because the concentration of particles is so high that the paths for settling towards the bed are narrow and convoluted, and the upward drag of escaping fluid is significant. The fluid escapes vertically because the lutocline position in the fluid is steadily falling over time so that more sediment is being accommodated into less volume. This increases the pore water pressure causing water to be expelled upwards. At some point the bulk density at the bottom of the suspension is so high that no further settling can take place, and this marks the surface of the depositing bed. As deposition continues from the bottom of the suspension, the bed rises up towards the falling lutocline. When the two meet deposition is complete and the process of consolidation continues through the slow expulsion of pore water.
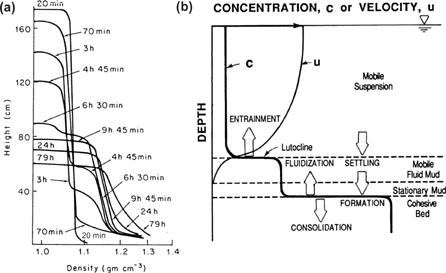
Figure 7.21 (a) Density profiles through time measured in an experimental suspension. (From Been and Sills, 1981.) (Copyright © 1981 Thomas Telford , reproduced with permission.) (b) Diagram showing a near-bed suspension concentration profile and relationship between the current velocity profile and the fluid mud layer. (From Mehta, 1989.) (Copyright © 1989 American Geophysical Union, reproduced with permission.)
The time scale for fluid mud to completely settle is long compared with that of the semi-diurnal tide, so the current goes from slack back to maximum velocity before settling is complete. If the settling of fluid mud is taking place as the tide is going into neaps, then the velocity profile during subsequent tides may not penetrate the lutocline and the fluid mud beneath will continue to settle as a stationary suspension. If settling is occurring during slack water on springs, however, then the velocity profile on subsequent tides will almost certainly extend below the lutocline and a mobile fluid mud layer develops (Figure 7.21b). Because of the extreme sediment concentrations involved, mobile fluid mud layers can result in enormous quantities of sediment movement over a single tidal cycle.
• Estuary systems involve the net landward transport of sediment. The large-scale morphology of an estuary is controlled by palaeovalley configuration, entrance conditions and degree of infilling. Based on their entrance conditions estuaries can be either wave- or tide-dominated. Flood-dominant estuaries develop due to distortion of the tide wave as it progresses along the estuary. Ebb-dominant estuaries develop due to the difference in the hydraulic efficiency of the intertidal and subtidal channel.
• Wave-dominated estuaries have barrier, tidal inlet and tidal delta morphologies, and have a high-energy outer and inner zone and low-energy central zone. The coarsest sediments are found in the inner and outer zones, and finest sediments in the deep central basin.
• Tide-dominated estuaries have linear sand ridges and multiple straight channels with a single meandering channel, broad intertidal mud flats, salt marshes or mangroves. Outer, central and inner zones are relatively high energy compared with wave-dominated deltas, with coarsest sediments found in the outer and inner zones, and finest sediments in the central zone.
• In long estuaries (greater than one-quarter of the tidal wavelength), the tide displays wave-like behaviour. A lag between the timing of high (and low) tide at the coast and at the head of the estuary is a common element of progressive waves. In short estuaries, a time-varying hydraulic gradient between water levels outside and inside the estuary produces periodic water level oscillations and currents.
• The turbidity maximum zone (TMZ) is where the largest suspended sediment concentrations occur and is best developed in the central zone of long, muddy estuaries. Gravitational circulation is most important in partially-mixed micro/mesotidal estuaries, and velocity-magnitude asymmetry is most important in well-mixed macrotidal estuaries.
 Reflective questions
These questions are designed to test your comprehension of material covered in this chapter. Suggested answers to these questions can be found on this book’s website.
7a. In your own words, describe the major differences in morphology between wave- and tide-dominated estuaries.
7b. Outline the main sedimentary processes that take place in the intertidal zone of estuaries.
7c. Explain the relationships between the different mixing processes and the development of stratified and well-mixed estuaries.
7d. Consider some of the implications of the tidal prism and velocity-magnitude asymmetry of the flood and ebb tides with respect to sediments and landforms found within estuaries.
Dalrymple, R.W., Zaitlin, B.A. and Boyd, R., 1992. ‘Estuarine facies models: Conceptual basis and stratigraphic implications.’ Journal of Sedimentary Petrology, 62, 1130–1146. (Provides a summary of the major geological and sedimentological aspects of estuaries and the estuary classification scheme used in this chapter.)
Dyer, K.R., 1986. Coastal and Estuarine Sediment Dynamics. Wiley, Chichester. (An advanced text on estuaries that includes chapters on estuarine sedimentation and cohesive sediment dynamics.)
Dyer, K.R., 1998. Estuaries: A Physical Introduction. Wiley, Chichester. (A comprehensive introduction to tidal dynamics, stratification and mixing in estuaries.)
Prandle, D., 2009. Estuaries: Dynamics, Mixing, Sedimentation and Morphology. Cambridge University Press, Cambridge. (An advanced text on estuary dynamics, including monitoring and modelling.)


 Case Study 7.1 Salt marsh accretion rates


