CHAPTER 2

OUT OF BALANCE
Debts, Surpluses, and the Broken Global Economy
The study of economics is pretty much the study of choices. The fundamentals begin with choices—the choice to produce and the choice to consume, yielding supply and demand. Economists study incentives, behaviors, physical inputs, and productivity. But what matters most is the basic will to produce and the desire to consume. That’s pretty much the beginning and end of all economic activity.
And when economies are working normally, it usually isn’t all that hard for political leaders and central bankers to influence supply and demand. Yet in recent years, as I’ve said, things haven’t been working normally. In the new age of oversupply, all the rules are changing.
In normal times, managing an economy is like managing a busy urban intersection. Veteran policy makers and central bankers are like traffic cops. They’ve been around long enough to know what’s happening and how to get motorists to behave in certain ways: speed up, slow down, turn left or right.
What’s happened in the past fifteen years or so is that the familiar intersections of economic life have been transformed. New superhighways carrying vast quantities of capital and labor are now feeding into the intersections of commerce. But the intersections haven’t been reconstructed to handle this influx and the traffic cops don’t agree on how to handle the relatively sudden swell of economic traffic. And who can blame them? Western economic policy makers have never before seen a few billion new workers, and trillions of dollars in new capital, pour into the global economy.
To make matters worse, economists who lead policy debates don’t all have the same theories of how “drivers” in the global economy behave individually. And, more and more often, they disagree about such basics as how to get economic players to speed up, slow down, or turn. In fact, they even disagree about what the role of economic traffic cops should be.
No wonder the past few years have been among the most confusing in world economic history.
A Closer Look at Global Imbalances
The huge new global imbalances that arose in the 1990s are not exactly a secret. Less obvious, though, is just how fundamentally the rise of the emerging nations has remade the global economy—and the ways this shift fueled the Great Credit Bubble—and how all of that explains why the advanced nations can’t get out from under the present slump.
Sure, we’ve all heard a million times that globalization has changed everything. But what most people don’t realize is that these changes go far beyond call centers in India or factories in China. The most profound change of all has been capital flows from surplus to debtor nations—flows that have proved devastating for developed economies over the past fifteen years. Yet even now, how exactly this imbalance arose is not well understood. That’s a problem, because many of the drivers of imbalances are still in place.
So let’s walk carefully through why this situation arose—and why we ended up with chaos at the global macroeconomic intersection.
Step one is identifying the three major players in the story. I classify them as follows:
■ The traditional advanced economies of the northern hemisphere, excluding Japan: the United States, Canada, and the nations of the European Union;
■ Emerging/LOw-Wage current Account Surplus Economies and Energy-exporting Nations, for which I have created a somewhat cumbersome acronym—ELOWASEENS (“eh-lo-wah-seens”). The ELOWASEENS, by 2006, included China, Russia, Saudi Arabia, Singapore, Kuwait, South Korea, Malaysia, Thailand, Indonesia, Qatar, Nigeria, Venezuela, and Libya. I have left aside India and Brazil (otherwise considered powerhouse emerging markets) because in 2006 they were still only on the cusp of being able to sustain current account surpluses. They are nevertheless very large nations with huge populations that are likely to further destabilize the global macroeconomic intersection—and are all but ELOWASEENS. But in 2006, at the climax of the credit bubble in the developed world, they were not quite yet a force in the overall equation.
Now you may ask, what is a nation’s “current account” to begin with? Good question: the current account balance (surplus or deficit) of a country, together with gross domestic product and trade balances, is among the key statistics in measuring the relative size and trading position of countries. Somewhat more simply put, if a nation takes in more goods in trade than it sells to other nations (measured in payments), after adjusting that equation for the net of earnings on foreign investments minus payments made to foreign investors, and general cash transfers, that country (or region) is running a current account deficit. If the inverse is true, the country is said to be in current account surplus.
Currently, and for many years now, the world’s biggest current account surplus is earned by China, and the biggest deficit is incurred by the United States. So it is basically economists’ calculation of what nations are “in the red” (consuming more than they produce) versus “in the black” (producing more than they consume). Pretty simple when you think about it that way, right?
Okay, back to what happened.
In order to explain how the prevailing global imbalances have changed everything, we need to look at the world economy before and after these imbalances emerged. In the following pages, I do this by examining the relationships among and within each of the world’s three main economic players for two different points in time.
First, I look at “before”—1995. While most Americans spent that year obsessed with the trial of O. J. Simpson, I think of 1995 as the year right before the world economy was turned upside down. The Internet and other information technologies were about to dramatically boost productivity in the advanced nations, but that hadn’t happened yet. AOL’s dial-up service—“you’ve got mail!”—was still the main way people accessed the Web. Meanwhile, the big economic boom outside the rich countries, in the ELOWASEENS, was just getting under way. These nations were coming into their era of great expansion and were just starting to pile up their huge account surpluses.
Second, I look at 2006 as my “after” point, when the global imbalances had fully emerged. The big focus of media attention in 2006 was the disastrous war in Iraq, but actually a bigger catastrophe was in the making as the developed world’s credit and asset bubble reached an apex.
Comparing these two points in time, 1995 and 2006, is startling. The macroeconomic “traffic” flowing through the world economy not only grew substantially during this period, but the direction of the flows changed considerably—with traditionally poorer nations becoming huge creditor countries.
This revolutionary change happened without any makeover of the global monetary system or implementation of other global reforms that might have updated the macroeconomic intersection. The fall of the Iron and Bamboo curtains was, in many ways, as significant as the end of World War II. Yet there was nothing like a United Nations or a Bretton Woods Conference to create a new global financial system. No new institutions were created, like the IMF or World Bank were after the war. While everything in the global economy changed, the infrastructure to manage it remained untouched.
Perhaps this should not be viewed as all that surprising, because in 1995—six years following the fall of the Berlin Wall and the Tiananmen Square incident—the principal source of trade pressures on rich nations was still within the developed world. The main challenge to the economic dominance of North America and Europe—initially, in light manufacturing and, later, heavy manufacturing and advanced product design employment—came from Japan.
By 1995, Japan’s economy was in the doldrums and America’s hysteria about that country’s rise had long since abated. Books like Michael Crichton’s Rising Sun were no longer flying off the shelves as Americans fretted about a takeover by Tokyo. But Japan was still seen as America’s main economic rival. The United States and the Western European nations were still collectively running big current account deficits in 1995 with Japan (and also, to a lesser extent, the energy-exporting nations).
Increasingly, though, Japan was a manageable rival. The competition with Japan—which had pursued an export-based trading model since the 1960s and was joined by the four “Asian Tiger” nations during the 1990s—was no big deal as advanced nations emerged from their recession of the early 1990s. That’s because the United States and the rest of the developed world were embarking upon a productivity explosion as the Internet and other technological breakthroughs emerged.
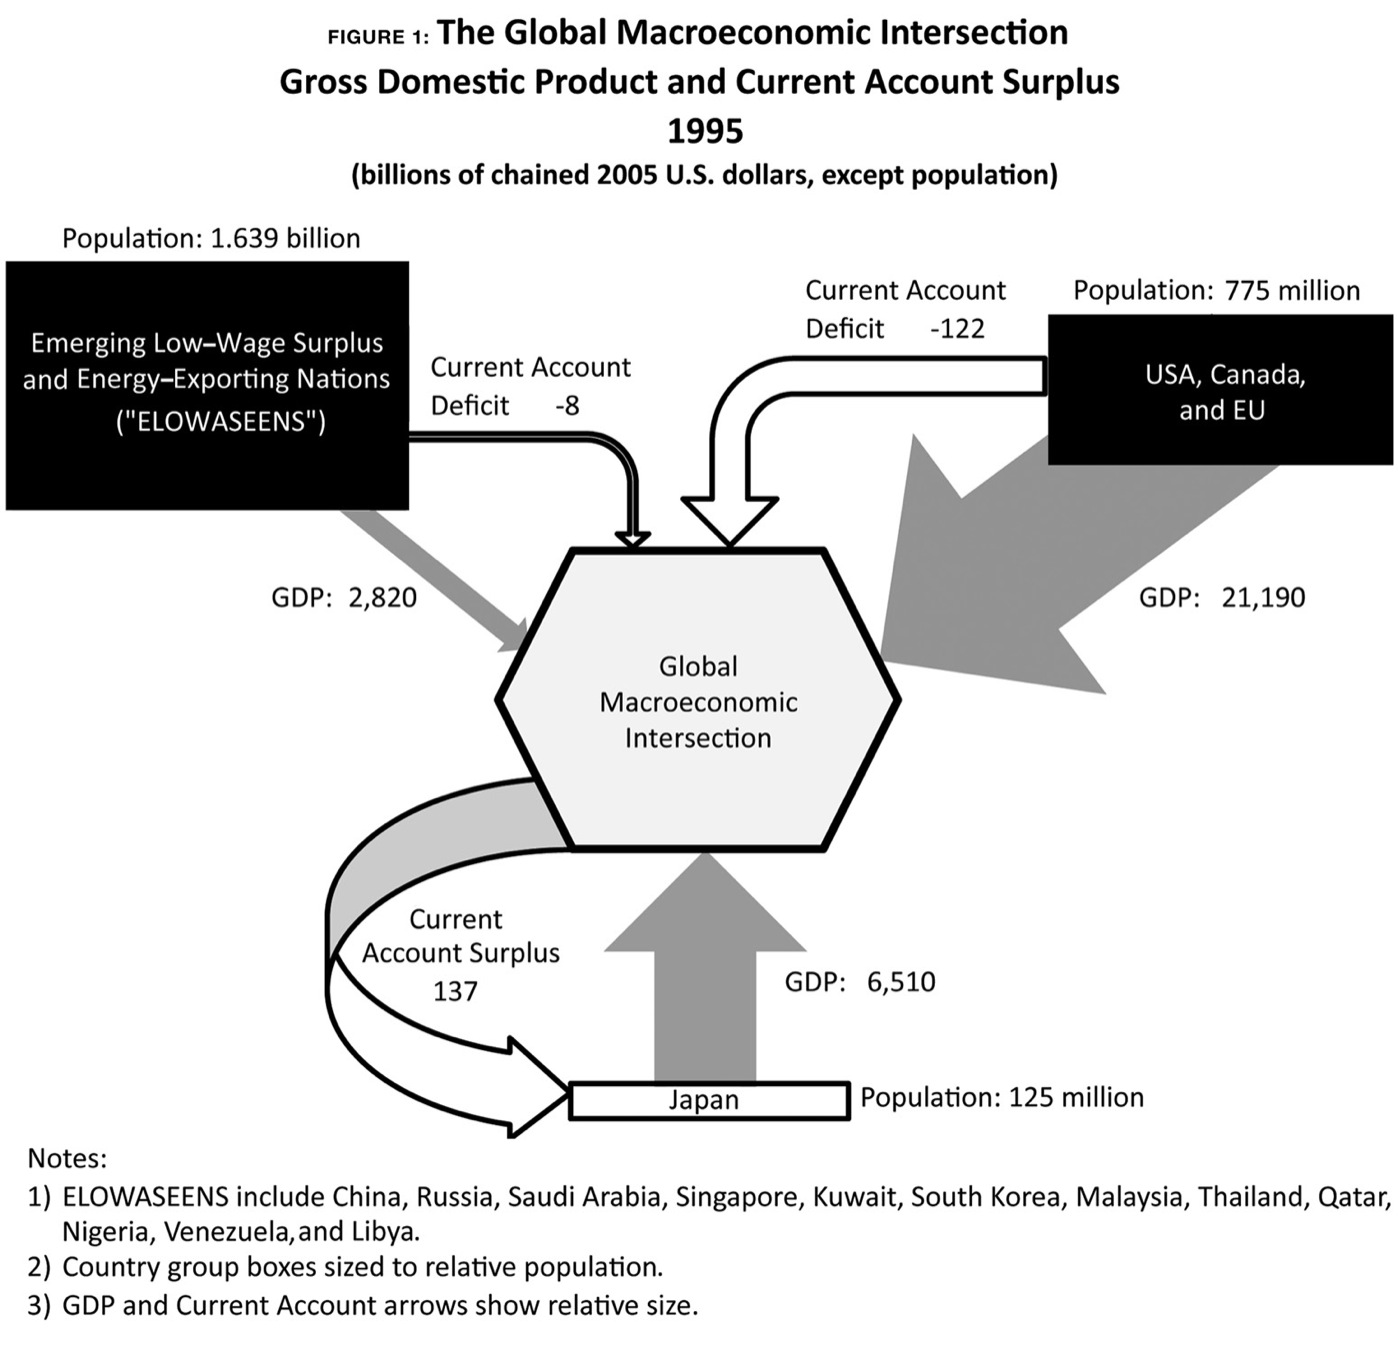
At the same time, the ELOWASEENS were only beginning to stir. China, long a sleeping giant, was still having its morning coffee in 1995. These countries were not yet piling up the account surpluses that are so familiar today. Indeed, they actually had a slight account deficit with the developed world in 1995, and an aggregate GDP of only $2.8 trillion (in 2005 dollars).
In 1995, then, the global macroeconomic intersection of the three groups of nations we are examining in this chapter looked like the drawing in figure 1 on the following page:
At this stage, the accelerated growth of information technology—chiefly, the Internet and its many applications—initially forestalled the rise of huge global imbalances. This new technology was not just the basis of new businesses in developed countries—from Amazon to wireless firms—but made any number of existing companies more efficient and profitable. The late 1990s shaped up as something of an economic golden age, especially in the United States, which enjoyed the longest peacetime expansion in its history. Political scientists talked of the dangers of American hegemony in a “unipolar” world, while dot-com gurus forecast an endless array of riches. The number of American millionaires grew by leaps and bounds. Even the federal budget deficit, to everyone’s surprise, began to disappear. The swiftly burgeoning economic China and other nations were barely discussed.
Yet already, evidence was everywhere that the twenty-first century would not be another American century. Among other things, it wasn’t long before America’s golden advantage, the Internet, was to put work by poorer countries and became a driver of their growth—and new global imbalances. After all, the Internet added immeasurably to the ability of emerging market exporters and processors to expand rapidly in the late 1990s and into the early 2000s. Ironically, the Internet (developed by the United States) made it easier than ever to move production overseas and, in time, to move services as well—even legal services.

For a time, though, during the late 1990s and first few years of the new millennium, the impact of information technology in the West—chiefly the United States—gave the countries of North America and Western Europe a huge boost in productivity and capacity. But in no small sense, the Internet bubble was not dissimilar to the gold rush, one of the great misallocation of capital resources of all time (and coincidentally, I suppose, both were centered in San Francisco and its environs).
The less attractive attributes of the bubble were excused by many with reference to theories of “creative destruction,” a term originating with Karl Marx but promulgated in the context of the benefits of potentially wasteful investment theorized by the Austrian American economist Joseph Schumpeter (a story for another book). But notwithstanding the huge productivity boost that resulted from the IT revolution, it reduced pressure on the advanced nations to focus on labor-intensive productivity enhancement—such as heavy infrastructure redevelopment and expansion—even as they faced the challenge from a huge pool of cheap labor abroad. In fact, it should be noted that technology actually reduced the need for workers.
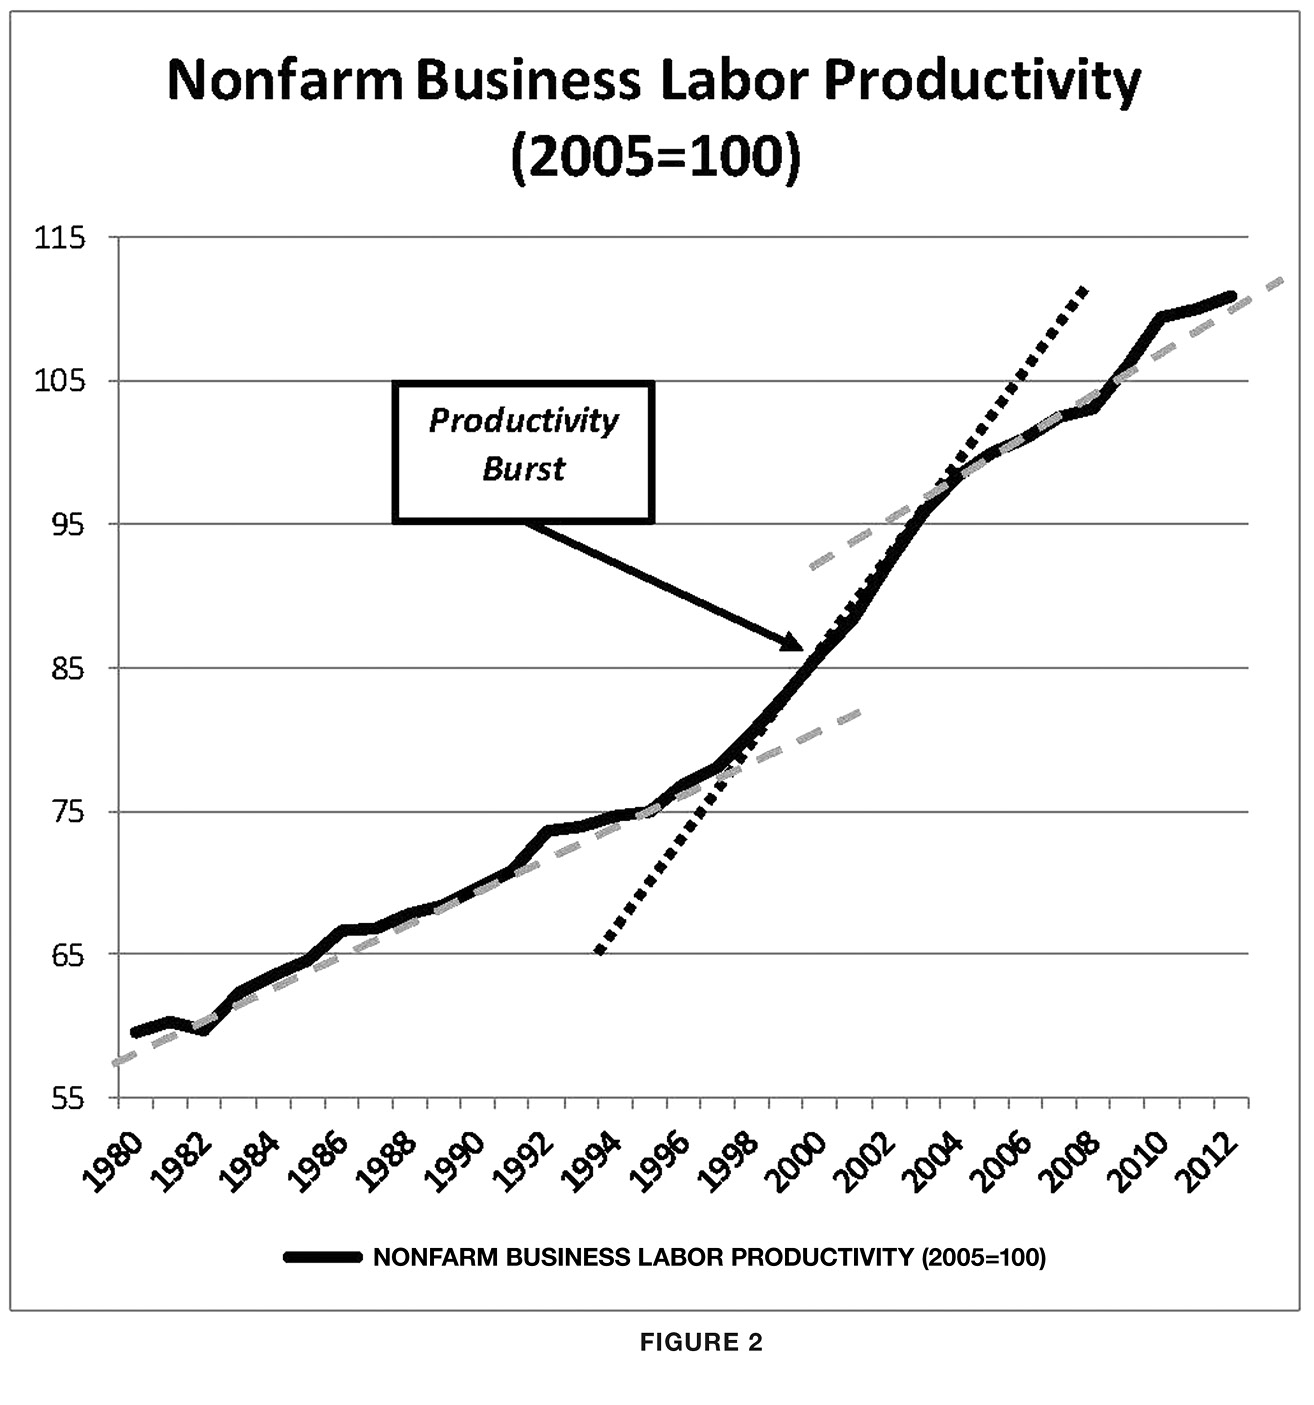
The magnitude of this increased productivity in the United States is illustrated in figure 2, which shows the dramatic rate of change in productivity growth during the boom compared to the periods immediately before and after. The steep growth reflected in the trend line marked “Productivity Burst” was akin to productivity growth at the advent of other major technological leaps in telecommunications and transportation. The years just before the turn of the new millennium were remarkably similar, as many commentators noted, to the era a century earlier when innovations like electricity and the assembly line were coming into widespread use.
Thanks to this burst, the advanced nations had an enormous head start on emerging nations that were just throwing off the burden of socialism. Arguably, the rich countries had plenty of time to plan for the tsunami of competitive labor and resources that were about to challenge their standard of living. After all, the emerging market “usurpers” didn’t step forward overnight. They had to transform their industrial, communications, transportation, financial, and political sectors in order to be competitive.

China, for example, had to build all sorts of things during the 1990s to connect its vast labor force to the rest of the world (things that those of us in the advanced nations often take for granted): a new national highway system, modern airports, and the urban water and electrical systems needed to accommodate tens of millions of peasants pouring into rapidly expanding industrial cities. The percentage of Chinese living in cities increased from 17 percent in 1978 to 46 percent in 2009 to just over 50 percent by year-end 2012, with much of that migration—the largest in human history—occurring during the 1990s.1 Amid its growing pains, China didn’t look anything like the economic superpower we see today.
Also, some of the emerging countries—especially the Asian Tigers—initially overborrowed in hard-currency denominated loans; not a smart move. And the resulting Asian financial crisis beginning in the summer of 1997 tempered the accelerating pace of expansion in the ELOWASEENS for a brief period, giving the advanced nations further breathing room.
So what did the developed world do during the 1990s to plan for the enormous changes in the global economy that winning the Cold War had set in motion?
Pretty much nothing, as I discuss in more detail in the next chapter.
And among the ominous trends that emerged in the late 1990s was the way that developing nations handled all their surplus money. The lesson that emerging nations drew from the 1997 Asian financial crisis was that they should abjure borrowing in other currencies and boost their savings rates. Instead of issuing debt in the currencies of their trading partners, they began to accumulate foreign reserves in the currencies of their trading partners and invest those reserves in the debt securities of hard-currency nations—particularly in U.S. Treasury securities, with China’s share alone growing from less than $60 billion at the end of the 1990s to over $1.1 trillion by the end of 2011.2
Two other phenomena can be traced to 1997. By the end of that year, U.S. real household median income began to stall. Such inflation-adjusted income would reach an all-time peak in 1999 that would never again be repeated to the present day.3 Yet even as incomes stalled in the late 1990s, inflation-adjusted housing prices in the United States began bubbling relentlessly upward.
The five-year period from 1997 through 2002 was highly transitional, encompassing rapid productivity growth in the advanced nations, the demise of the Internet bubble, the introduction of the euro, the global terrorist events of 2001 and the military aftermath, together with the ongoing acceleration of growth in the ELOWASEENS and their inexorable accumulation of excess savings.
Oh, and let’s not forget China’s entry into the WTO in 2001, along with its gaining permanent “most favored nation” status from the United States that same year.
The global economy turned upside down with remarkable speed. In 1997, the aggregate current account deficits of the United States, Canada, and the European Union was just $94 billion. By 2002, that figure had ballooned to $467 billion—a stunning shift.4 The rise of the ELOWASEENS remade the global economy in just five years.
These shifts contributed to subdued inflation in the United States, which hovered generally between 1.5 percent and 3 percent during this period, except in 2000, when inflation spiked slightly higher. That’s because lower-cost imports, particularly from low wage countries, tempered any overall rise in prices. Prices for things like microwave ovens and cell phones fell sharply, offsetting rising prices for other things, such as health care and college tuition. Walmart was opening an average of two discount stores every week between 1997 and 2002 and pressuring its key suppliers to move to China in order to lower costs.
As a result, central banks could reduce short-term interest rates after 2001 without incurring much in the way of an inflation penalty. This, of course, fueled demand from private-sector borrowers even further. Suddenly, cheap money was everywhere.
Thus, the stage was set for the period we normally associate with the credit bubble—but, in truth, the period 1997 through 2002 was its first act.
PILEUP AT THE GLOBAL MACROECONOMIC INTERSECTION
Let’s return now to the global macroeconomic intersection. By 2002, the emerging nations of the world, growing by leaps and bounds, were firmly tied to the broader global economy. The vast populations of the ELOWASEENS were now linked to the free markets by the economic and trade equivalents of modern highway interchanges—interchanges that had been under construction for a dozen years prior—in communication, shipping, capital access, and financial services. Nowhere were these linkages more visible than in China, where massive port and shipping facilities were built or expanded, particularly in Guangdong Province and to the north in Tianjin, to handle the goods from factories that, in some cases, operated around the clock.
And just down the road, albeit linked to the global economy more by an access road than by a highway interchange, were the additional 1.2 billion people of India, which was still marginally in deficit but growing rapidly. Japan, meanwhile, remained an export powerhouse with big trade surpluses throughout this period, even as its economy otherwise stagnated.

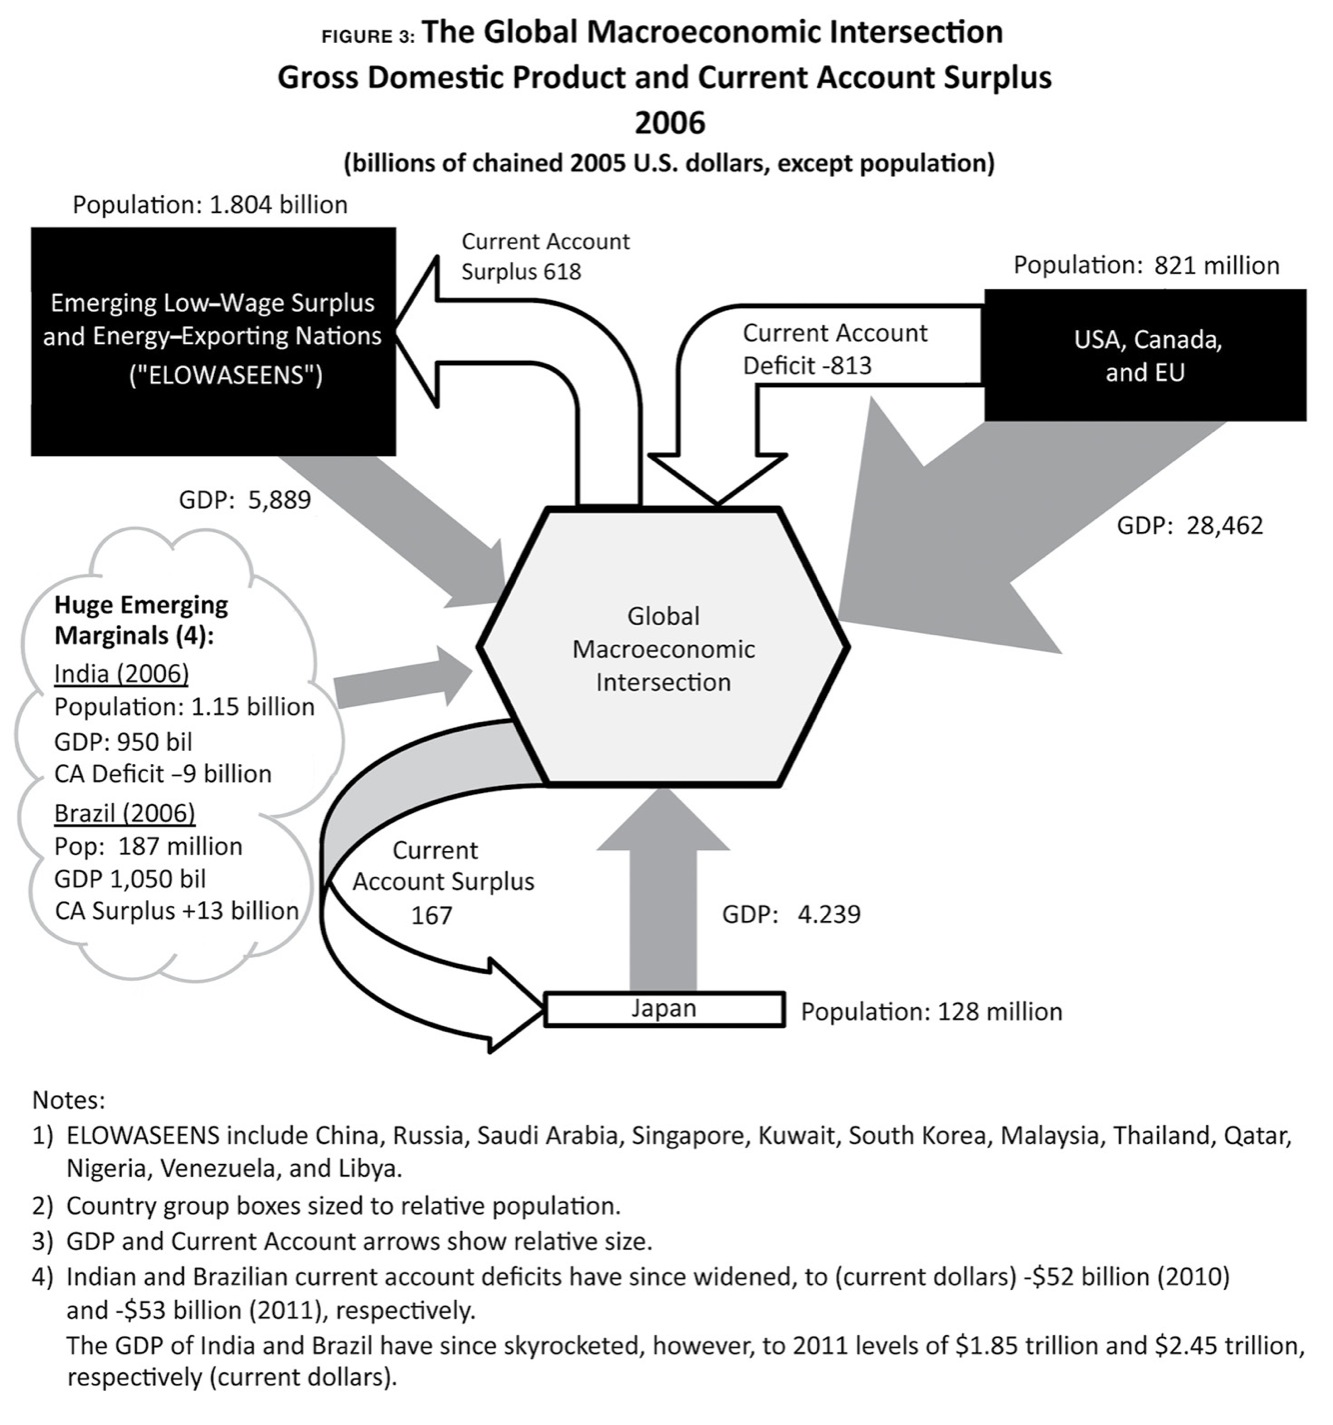
By 2006, the last full year of the credit bubble, our complex global economic intersection was therefore dramatically altered from its state in 1995. The GDP of the ELOWASEENS had more than doubled in size to $5.9 trillion, while the combined GDP of the United States, Canada, the European Union, and Japan rose by a scant 18 percent during the same period.5
Of far more importance, the current account deficit (and remember, these figures are all in “constant”—i.e., inflation-adjusted—dollars) for the United States, Canada, and the European Union had ballooned by 566 percent, to $813 billion from $122 billion, while the account surpluses of the ELOWASEENS had exploded to $618 billion from what had been an $8 billion deficit eleven years earlier.6 Figure 3, on the previous page, shows what the global macroeconomic intersection looked like in 2006.
And the above was hardly the end of the story. In 2011 the GDP and current account balances of the various parties looked like this in 2005 U.S. dollars:
|
GDP |
Current Account Balance |
% of GDP |
|
|
ELOWASEENS |
$7.1 trillion |
+$753.4 billion |
10.60% |
|
U.S./Canada/E.U. |
$34.3 trillion |
-$629.3 billion |
-1.84% |
|
Japan |
$5.7 trillion |
+$135.0 billion |
2.35% |
Because of the Great Recession, the deficit of the Western advanced nations had narrowed somewhat, but the ELOWASEEN surplus grew ever larger.7
• • •
All flavors of Keynesian macroeconomists rightly point out that the global economy is suffering from a demand shortage. This is correct, of course, but begs the question of why. Unless we recognize that the dramatic changes to the global macroeconomic intersection are historically unique in both context and scope, we will never have a prayer of addressing today’s economic challenges.
An insufficiency of demand is the flip side of an excess of supply. But the analytics bearing on the two versions of the same problem are different. A demand shortage can be caused by a sudden falloff in economic activity resulting from a natural shock, a war, or a debt overhang of the type discussed previously. In any case, it represents a falloff in aggregate demand relative to a static or steadily growing supply of goods and services.
But what if a historical event rather suddenly created a huge boost in supply? What if global aggregate demand was more or less steady, or even growing, but supply was growing much faster and growing independently of demand? What if the existence of inexpensive labor and capital created its own form of supply stimulus, much as lower tax rates or other policies that foster capital formation would do (in theory) in an otherwise supply-constrained economy?
If all that happened, the advanced nations would find themselves living in a changed world. And, if these nations were smart, they would change, too. Right?
Wrong. As it turned out, the developed world handled the rise of oversupply in about the worst possible way. Too much supply didn’t have to become a nightmare. But it did, thanks to missteps of historic dimensions.