
If you are going to skip a chapter (and I am not suggesting you do), this would probably be the one to omit. Not that it isn’t important, it’s just that the actual template is included in the Excel files for your perusal.
This template is a suggestion. It will not work for everybody and that was never the intention in any case. Hopefully, it will give you several ideas whilst developing your own. And when I mean “your own”, be careful: models should never be personalised. They are for business use (generally). “Template” means precisely that. Models built by colleagues should have a similar look and feel. If you think of models circulating in your office, are they all similar? Chances are that will not be the case. Using styles, spacing and hyperlinks should therefore be consistent. Opening a template will assist.
A template file is a file that has been created specifically to be a template (i.e. it is a base for building upon) and whilst the file is created in the usual way, it is saved as either a template or macro-enabled template, which it makes it (slightly) more difficult than a standard Excel file to overwrite.
Reusable files can be more problematic, even if this is what many modellers often opt to use. A reusable file is akin to dusting off an “old favourite” and attempting to fit square pegs in round holes. Why? Because this is based on an existing model, not a foundation. The danger here is not only does the model not fit the purpose it is intended for, but irrelevant aspects are not fully deleted leading to potential errors in the model.
Unless scenario modelling where different versions of files need to be kept, always try to start with a template model whereby nothing needs to be deleted.
Let’s take a guided tour of a suggested template for financial modelling. Where to start? How about on the front page? Imagine you had just opened up the file:

Do you see where the file opens up? I am situated in cell A1 on the Cover sheet. Now you might be thinking, “wow, big deal”, but reflect some more. Whenever you open up a Word of PowerPoint document it always opens in a similar location: the top of page 1. But what about Excel? Excel is the poor relation - it is the proverbial dog with no legs. Where would you find it? Wherever you left it (which reminds me, I used to have a dog with no legs - it was called Woodbine - I used to take it outside for a drag…).
Seriously, the problem with Excel is that people are not always good at tidying up after themselves. As mentioned when discussing how to construct a model layout, saving a workbook so that all sheets are repositioned back to cell A1 and restoring the model back to the front worksheet are just examples of good manners.
This sheet does more than this though. It actually tells me who built it. No need to go to File->Properties (wherever that is this week) and finding out the model has been attributed to someone who actually passed away back in 1997. Moreover, this model actually provides contact details so that end users can get in touch with the author to ask questions where necessary. If you are a model developer, does that put the Fear of God into you? Well, perhaps it should. If we were all a little more accountable for the dross that is often referred to as a “financial model” then maybe we would take more pride in our Excel doodling and meanderings.
Aside from the shameless plug on the sheet (logo), did you notice the other key element on this worksheet? Cell A3 contains a hyperlink that leads us on to our Table of Contents:

Clicking on the aforementioned hyperlink takes us to the top of the Table of Contents worksheet, our dedicated navigation page. Do note that the destination cell chosen has been given a range name (HL_Navigator). See? I have been following my own advice.
With the overall error check (another hyperlink) clearly visible in cell G4, the sheet title and workbook name clearly visible in accordance with my layout suggestions earlier, it is clear to an end user with no guidance whatsoever how to access other worksheets.
There are two other points to note on this worksheet. Firstly, the section heading, “Table of Contents” in row 7, has been given a section number. You may think this is unnecessary on this worksheet as it is the only section. That is true, but on other worksheets, there may be more sections. We want our worksheets all to have a similar look and feel. Other sheets may have more sections. In that case, section numbers would be useful (e.g. to make it easier to discuss a printout of the model with a third party over the telephone). Cell B7 has not been hard coded. The number has been deduced by formula:
=MAX($B$6:$B6)+1
This will add one to the largest value located in column B prior to the row the formula is on. This way, if sections are reordered later, the numbering will update automatically (depending upon how you cut or copy the sections).
The second point concerns generating the Table of Contents itself. Contrary to many recipients’ beliefs, this has not been created manually. Remember that I discussed macros earlier and argued that they were ideal for menial, repetitive tasks? Well, this is one such example.

In this template, I have added a macro that creates the Table of Contents: it generates the worksheets in order and their associated hyperlinks. This is a macro that I would retain only whilst developing the model. Once all sheets have been constructed and the order has been finalised, there would no longer be a reason for this macro.
This macro was created as follows. On the Table of Contents worksheet, called ‘Navigator’ in the graphic (below), right click on the sheet tab and select ‘View code’.
This launches the Visual Basic Editor. Ensuring the right-hand pane is the code for ‘Worksheet’ and ‘Activate’, code may then be added to the right-hand pane which will run each time the worksheet is selected:

The actual code to use is reproduced below, including comments that explain how it works:

This book is not about Visual Basic for Applications, so if you wish to understand it more, feel free to read through the comments and experiment. No doubt some of you may just copy the code, set it and forget it (works for me)!
The next sheet in the template may surprise you. Many modellers will spend time setting up fancy colour schemes, complete with shading, conditional formatting and so on - and not explain their system of formatting anywhere. As a model auditor, I salute you. All that effort for nought. Together with an element of luck, a successful business thrives on three key components:
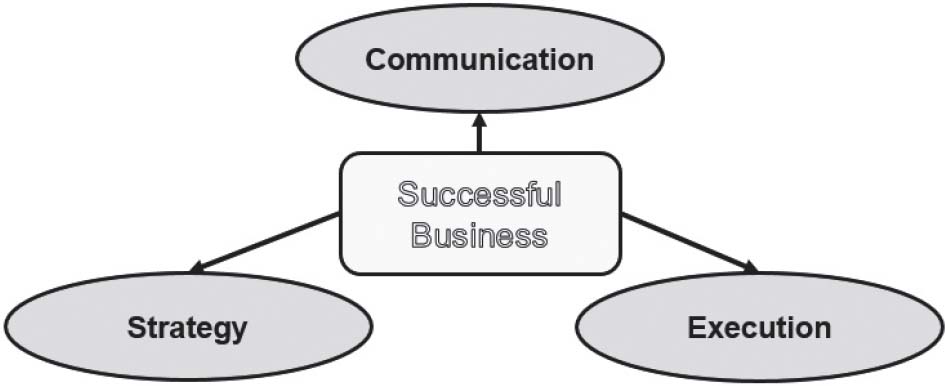
From a modeller’s perspective, the key component here is communication. The aim of a financial model - aside from quantifying potential business critical decisions - is to communicate the business plan and understand variances so that remedial actions may be taken in a timely manner. If instead you have wonder formulae such as
=IF(ISERROR(IF(INDEX(‘TI’’S & LC’’s’!$K$31:$BN$31,MATCH(‘XYZ (BS)’!R$8,’TI’’S & LC’’s’!$K$8:$BN$8))<0,0,INDEX(‘TI’’S & LC’’s’!$K$31:$BN$31,MATCH(‘XYZ (BS)’!R$8,’TI’’S & LC’’s’!$K$8:$BN$8)))=TRUE),0,IF(INDEX(‘TI’’S & LC’’s’!$K$31:$BN$31,MATCH(‘XYZ (BS)’!R$8,’TI’’S & LC’’s’!$K$8:$BN$8))<0,0,INDEX(‘TI’’S & LC’’s’!$K$31:$BN$31,MATCH(‘XYZ (BS)’!R$8,’TI’’S & LC’’s’!$K$8:$BN$8))))
you pretty much deserve all you get - and the same can be said for excluding a Styles Key:
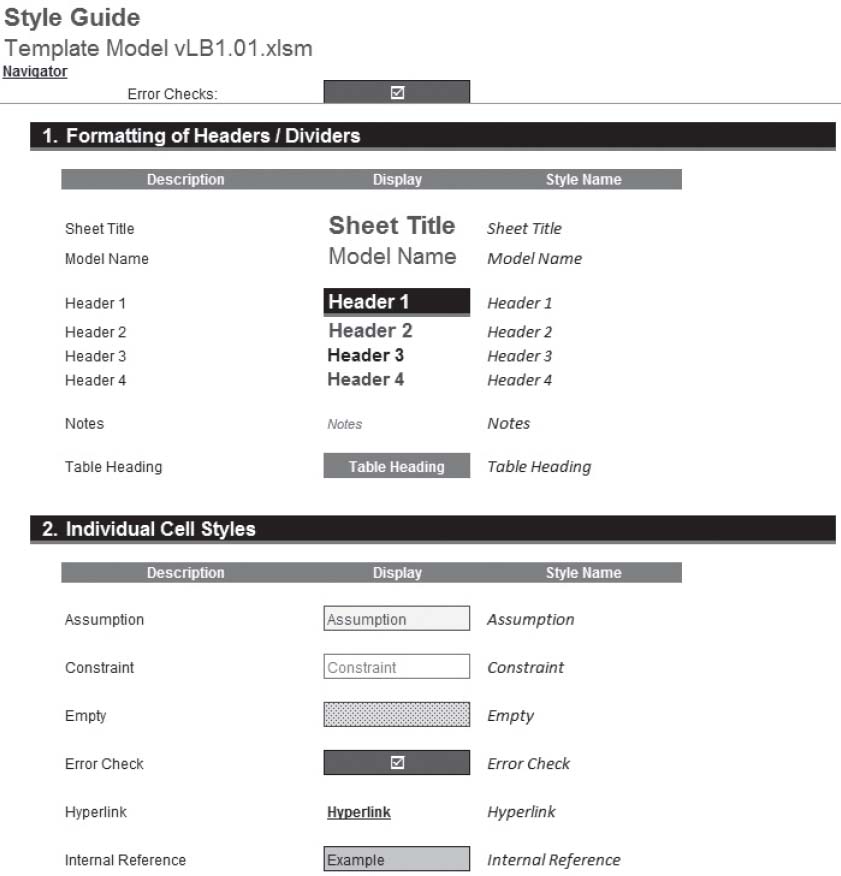
The above is an extract from the template model. There are actually more styles set up in this workbook than displayed above. I would imagine most people and / or organisations would probably not want our colour scheme. That is no problem. Changing an existing style is simple. Within the ‘Styles’ group of the ‘Home’ tab (ALT + H + J), right click on the style you wish to modify and click, er, ‘Modify…’:

This gives rise to the ‘Style’ dialog box:

Clicking on the ‘Format’ button (in some versions of Excel this may be ‘Modify’) then allows you to revise the Style as discussed previously. Given the Style Guide worksheet has all styles displayed using their respective styles, so as you change a style, the style displayed on the worksheet will change accordingly.
Before a template goes “live”, developers should agree on spacing, check methodologies and colour schemes. This makes it easier for one modeller to take over another’s work and it also promotes brand identity / consistency.
The next sheet, Model Parameters, also explains to the end user key constants:

I have talked previously about the distinction between a variable and a constant (constants are sometimes referred to as constraints or parameters). Variables are just the standard inputs of a model, whereas constants are values that are entered to ensure transparency so that end users may understand certain constraints that the model is operating under. In this template, as previously suggested, these constants are not only labelled but are also assigned range names (note that the Name Box in the image above contains the range name Rounding_Accuracy).
Other types of parameters may be entered here. Our firm works in the professional services industry so we include a ‘Client Name’ input (row 12). That may not be relevant to you, but you might wish to include project name, team leader, category, etc.
The model name is just that wonderful name explained previously:
=IFERROR(MID(CELL(“filename”,A1),FIND(“[“,CELL(“filename”,A1))+1, FIND(“]”,CELL(“filename”,A1))-FIND(“[“,CELL(“filename”,A1))-1),”“)
PhD’s available upon request.
The next worksheet is critical for any financial model: you need to get the time series correct. Too often in models, developers hard code the dates but this leads to a lack of flexibility in the model going forward. I have already explained the mechanics of a Timing worksheet:

Relax, I am not planning to walk through all of this again. My intention here is simply to show you its application, but I will point out one interesting observation. Have you noticed the shaded cell in cell I9 in the image above?
This is a “deliberately blank” cell. In an exam, you may have encountered a page such as

Actually, that has always irked me. By stating that, “This page has been left blank intentionally” the page isn’t blank. Anyway, I digress. The shaded cell in I9 (above) is analogous to this notion: the cell is required to be blank.
This is because the cells immediately to the right (cells J9:N9) are counters and add one to the value in the cell to its immediate left. If a number were to be entered in cell I9 the counter values would be wrong; if text were to be entered instead, all cells would display #VALUE! errors.
By styling the cell as an empty cell, cell protection can prevent the cell being typed in and at the same time convey to the end user that this cell must remain blank. This point does not really have anything to do with time series modelling, but it is salient nonetheless.
The penultimate sheet in this template is the Error Checks summary sheet:
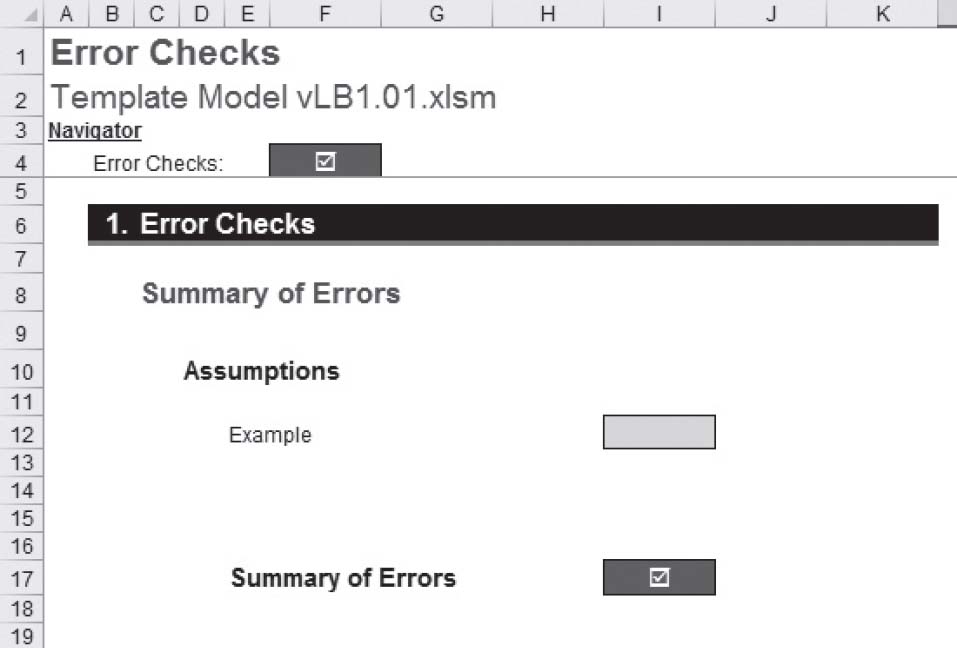
I discussed error checks and the importance of using a summary sheet in the last chapter. Cell I17 sums the error checks above it in column I, with a dummy check set up in cell I12 for illustrative purposes. Each reportable check should be linked to this sheet via a hyperlink. Then, the check in cell F4 is simply equal to the summary check (cell I17), which it also hyperlinks to. Simple!
The final sheet in the template keeps the auditors happy:

This is simply a worksheet that keeps track of significant changes. As a model auditor myself, it would be ludicrous to track every change. Can you imagine? You would have to note that you had noted a change and then note that you had noted that you had noted a change…
My general rule for detailing changes is when:
•there is a material change (say, 10% change in one of the key outputs);
•a milestone has been achieved; or
•the model is saved with a non-incremental new filename (e.g. to draw upon earlier discussions, upon saving when the filename changes from vLB1.19 to vLB2.01 rather than vLB1.20).
These are the main worksheets I would include in a template model. You and your colleagues may decide to add others, such as:
•blank time series sheet (for inputs, calculations and outputs)
•documentation worksheets
•depreciation schedules
•dashboard summary
•working capital adjustment worksheets
•taxation schedules.
That is all fine; create what works for you and try to never delete a worksheet from an existing template - it’s better to add than subtract. If necessary, create more than one template (but this may cause version control issues).
