chapter one
fundamentals
Cycling laws and regulations come and go but the laws of nature don’t change, so cyclists and bikes must ride with them. Most of the fundamentals of science actually facilitate cycling and make it possible, although at least one does, in fact, make it harder. The key is to use science and technology to minimize the disadvantages and maximize the benefits so that cycling is easier. It must be reasonably easy because interest in cycling is booming to the point where bicycle sales far outstrip those of any other vehicle type. Cycling is not only a massively popular way to travel but has also become a political touchstone because of the impact that it can have on the environment, society, and the individual. Where once world leaders waved imperiously from the steps of jetliners, they are now eager to be seen on a bike. So, health, safety, climate, and other issues fundamental to human existence are brought into this chapter, which lays down a broad, smooth track for the journey ahead.
What are the forces acting upon a bicycle?
 Am I not alone on my bike?
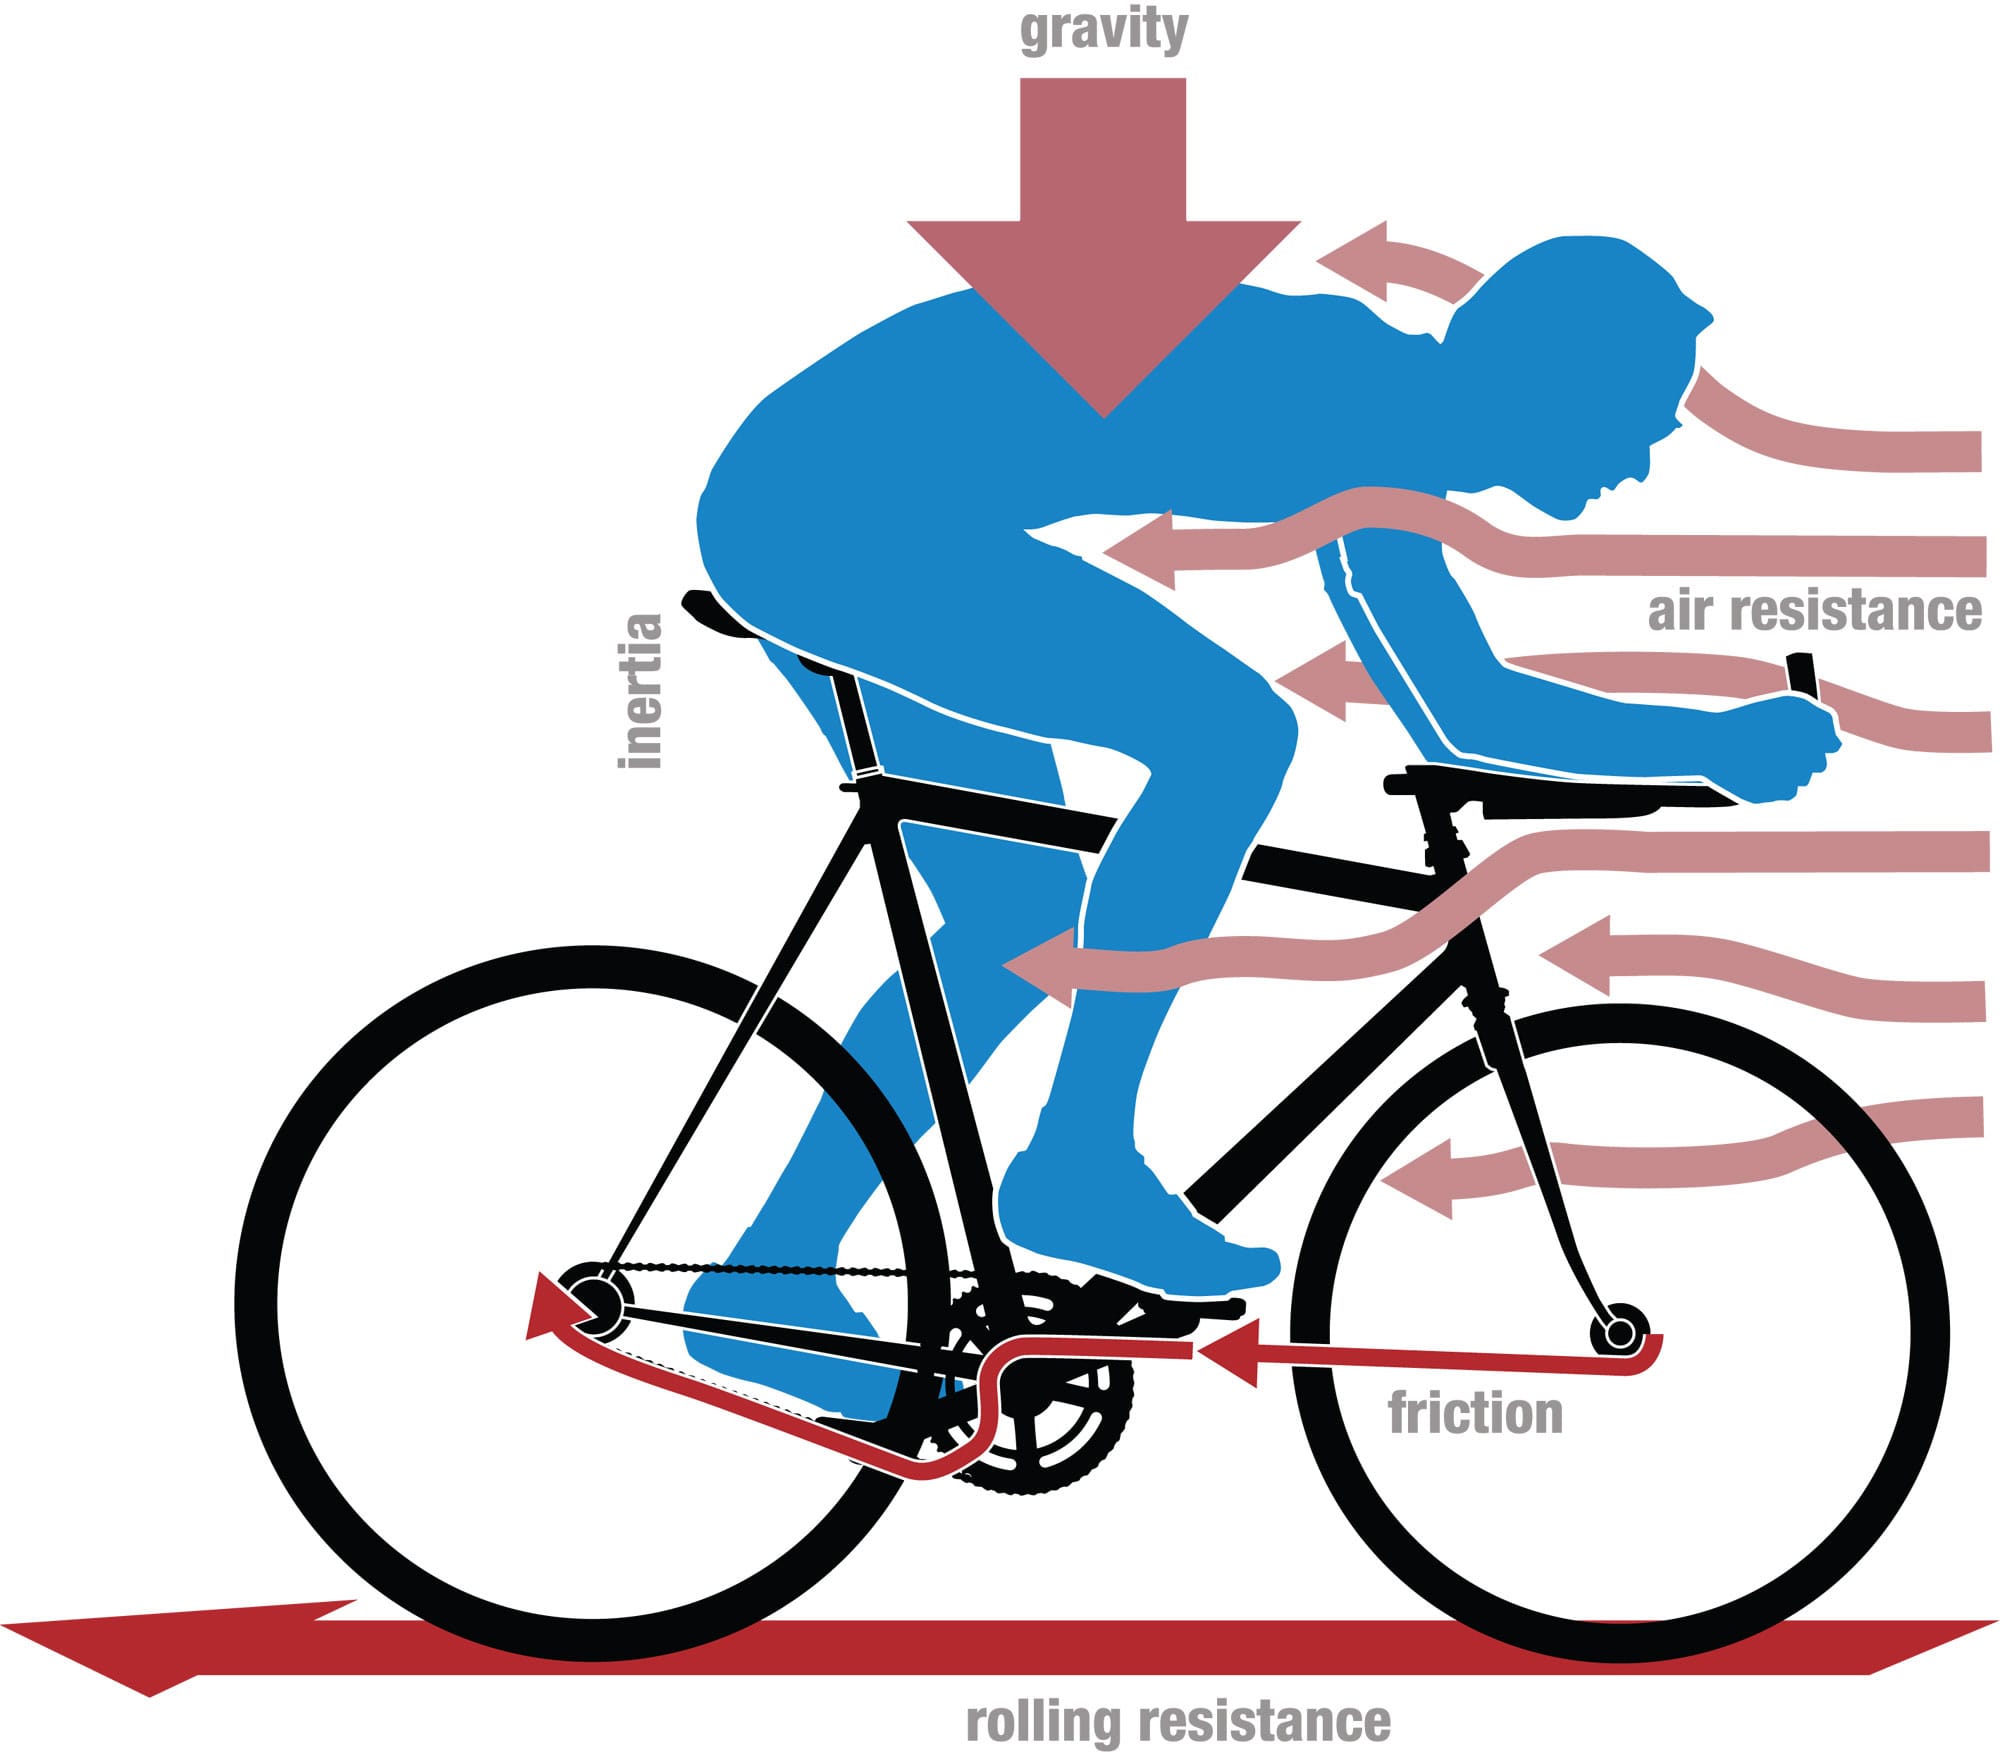
There are four external forces that every cyclist must work with or against—gravity, air resistance, rolling resistance, and friction—and a fifth effect, referred to as inertia. None of them can be utterly vanquished (and it would not necessarily be desirable to eradicate them completely). However, it is wise to understand what you’re up against so that you can minimize the negative consequences and harness the positive.
Gravity is the force that gives weight to matter. The Earth pulls everything to itself with a gravitational acceleration of about 32 ft/s2 (9.8 m/s2). In fact, gravity makes cycling possible by pressing the bike to the ground, but it makes riding uphill harder. Descending is made easier by the pull of gravity, but you never get back all the energy you put into climbing the same hill.
Air resistance generally works against the cyclist. The planet’s gravity is strong enough to hold a blanket of air some 62 miles (100 km) thick to the Earth’s surface. Cyclists couldn’t breathe without it, but must push it aside continually to make progress. This same force can be helpful, too, if you’ve got a fair tailwind.
Rolling resistance results from the fact that, when a tire comes into contact with a road, both tire and road deform a little. The road and the tire do not spring back with the same energy that deformed them, with some energy always lost to heat. This has the effect of a resisting force.
Friction helps to move the bike forward by maintaining contact between tire and road. However, friction in the bearings of the bicycle’s drivetrain—from the pedals through to the chain, gears, and hubs—can absorb up to 5 percent of the cyclist’s energy.
Riders must also overcome inertia, which is not a force at all, but an innate property of matter—its resistance to any change in its state of motion. A bicycle’s motion won’t change if there are no forces acting on it.
Forces and inertia
equipment: the bicycle
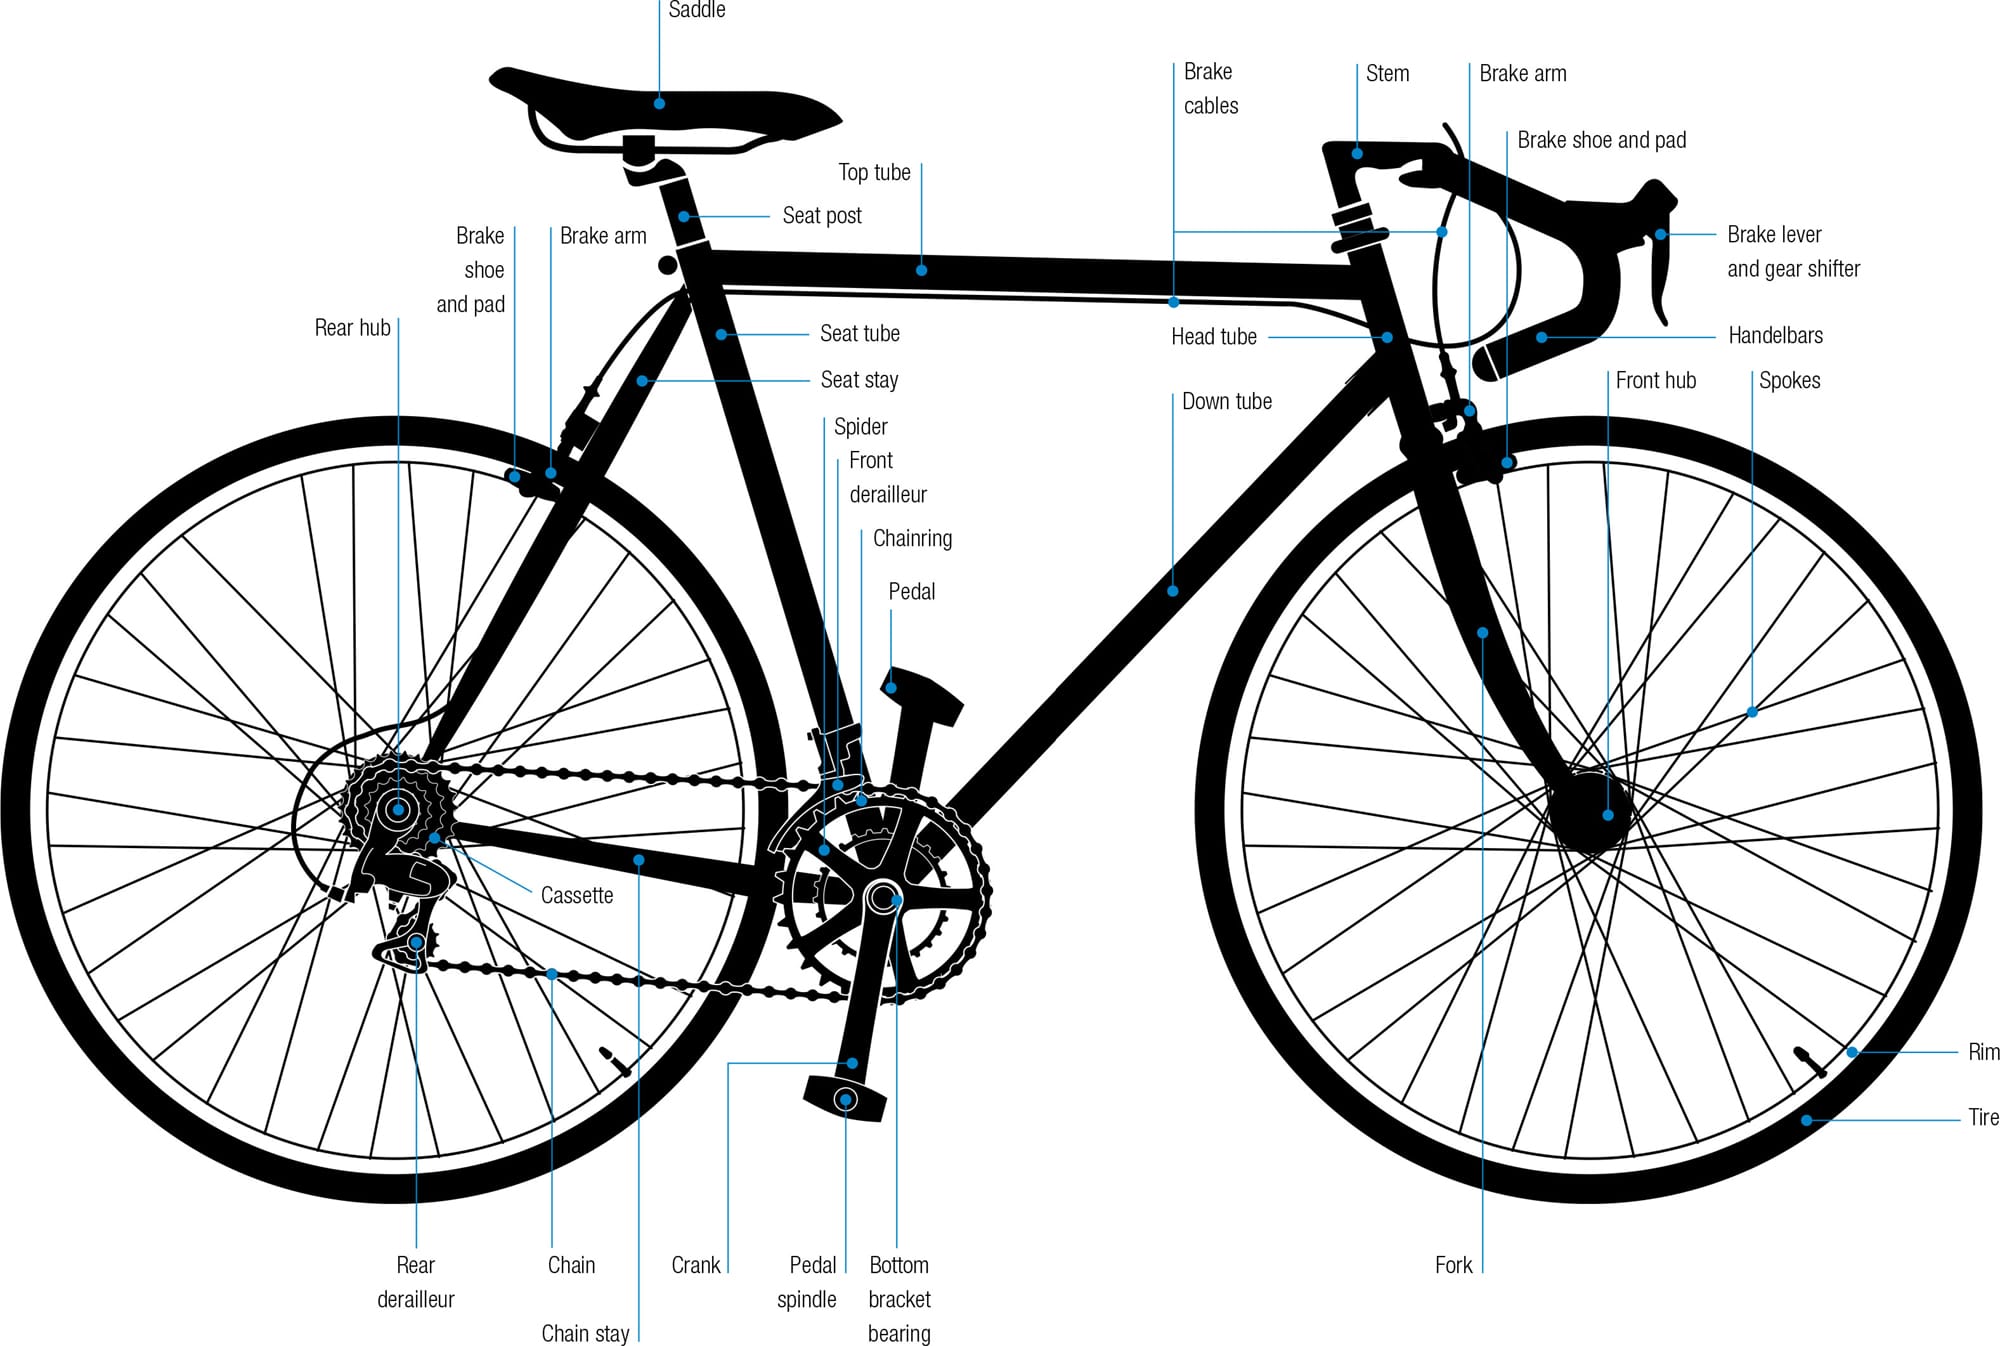
The modern bicycle is the result of two centuries of refinement, propelled by better understandings of science and technology. Bike builders and designers have repeatedly worked out novel ways to use established materials and to incorporate new materials to supplement or replace the old. Yet a cyclist from the late nineteenth century would have little difficulty in recognizing today’s bicycle because the silhouette of frame, wheels, saddle, and handlebars has remained largely unaltered. They may be alarmed by the slender saddle or amused by the 27 gears, but they would certainly be reassured by the familiar chain and spokes.
There are hundreds of parts on a bicycle, the majority exposed to full view. On the most functional bikes they each serve a mechanical purpose. Without doubt, the most important part is the frame, often described as the heart of the bicycle by people whose grasp of anatomy should disqualify them from medical practice. It is, actually, more akin to the skeleton, holding everything together, supporting many of the components and also the rider. If the metaphor is to be continued, the front fork can reasonably be equated to a limb, articulated at the headset.
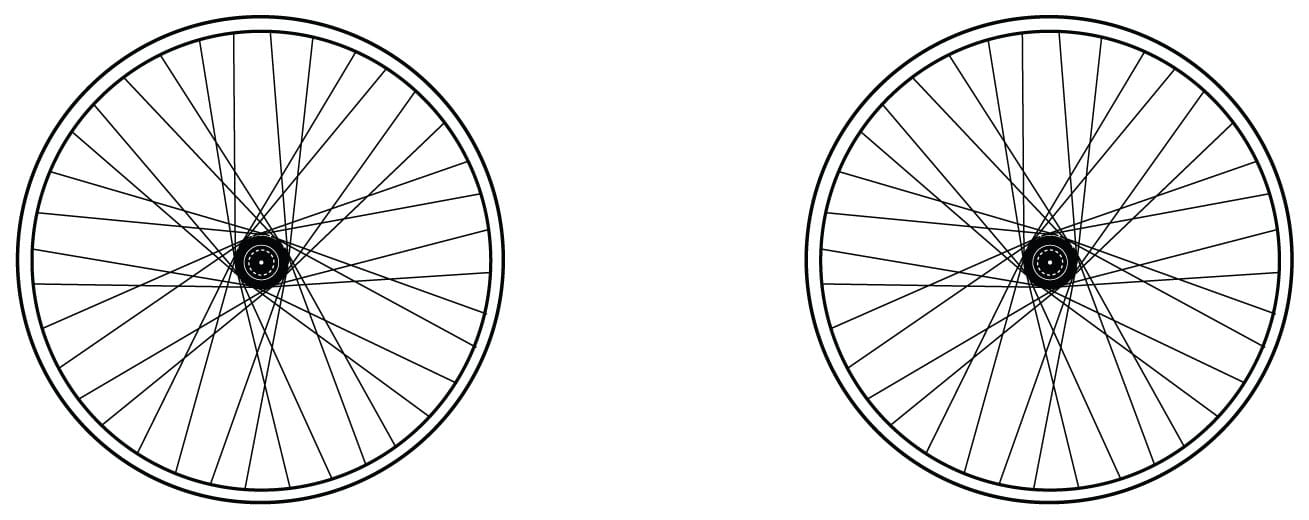
The wheels define it as a machine that is able to translate the work by the rider into motion along the ground, preferably forward. Even a Neanderthal would agree that the wheel is the most beautiful of human inventions, while kicking himself for not having thought of it first. The wheel has been fundamental in human development and its application in the bicycle is both elegant and minimalist, giving the bike its extraordinary efficiency.
The saddle’s role of seating the rider comfortably while allowing the legs to move freely has determined its unique appearance as a distorted reflection of the body parts it supports. The lines of handlebars, however, are as varied as handshakes, their contours a compromise between the need for an appropriate degree of bike control and the flailing, versatile geometry of the rider’s arms.
Pedals, cranks, chainsets, gears, and brakes are diverse in design and detail. They will continue to be refashioned as the market, marketeers, and technologies evolve. Only a handful of each year’s fresh ideas will endure. There will always be the frame, wheels, saddle, and handlebars. For all the other hundreds of components and their various configurations, only the fittest will survive.
The major components
Variations on a theme Bicycles come in scores of varieties, with differences in design, components, and materials to optimize the balance between function and cost. Every one is an assembly of parts, each of which can be changed in line with the owner’s desires, with replacements that may be mass-manufactured or handcrafted.
How efficient is cycling?
Why is it easier to ride than to walk?
Walking is fine and running is faster but cyclists go farther, quicker, for longer. Cycling is the most efficient way for a human being to use their own energy for propulsion. The bicycle is an extraordinary machine capable (at best) of converting 98.6 percent of the cyclist’s pedaling effort into spinning the wheels, while those who stride along with their feet on the ground waste a third of theirs.1
The average human walking speed is about 3 mph (5 km/h).2 At this speed, humans can travel for hours. Nevertheless, the walking movement is wasteful and inefficient. At every single step, the knee of the grounded leg bends and flexes, lowering the entire body for a moment before levering it back up to normal height. While this is going on, the spine bends a little, the hips twist, arms move to and fro, and the swinging motion of the other leg stops with an energy-absorbing impact when the foot strikes the ground.3 In fact, compared to an “ideal” walking machine, we are only about 65 percent efficient. In other words, in walking we lose about one-third of our energy to effects other than forward motion. No engineer would be proud of such an inefficient vehicle.
The bicycle, however, forces us to adopt a pose that maximizes the use of our calories. A walker moving at a particular speed could, if they rode a bike, travel three times faster without having to increase their effort at all, because the two-wheeled machine is phenomenally efficient.4 There are two reasons for this remarkable improvement. The first is the way the bike is configured to make us use our bodies more efficiently. The second is that the machine acts as a lever, multiplying the distance our feet travel around the bottom bracket with each pedal stroke into the much greater distance the tires travel along the ground.
Energy efficiency
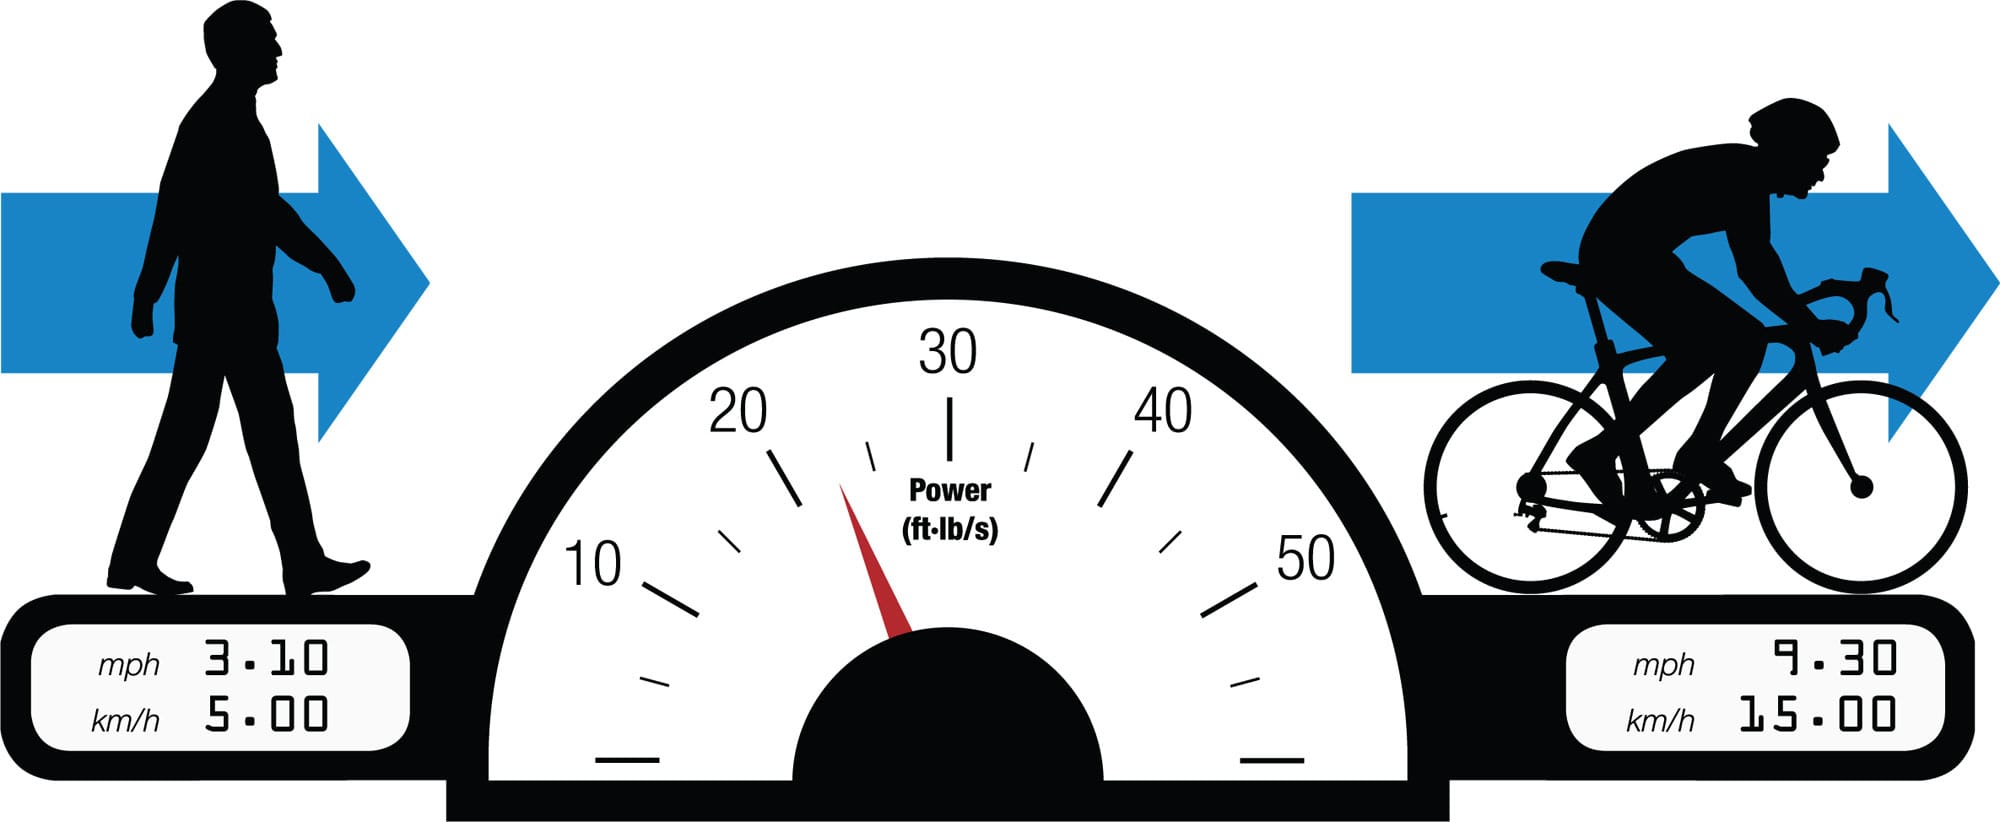
Saving on fuel If a cyclist and a pedestrian expend the same amount of power, the efficiency of a bicycle means the cyclist will be traveling three times as fast. At an average walking pace, the walker uses more than six times the amount of metabolic energy above the resting level compared to the cyclist. Running is four times as greedy of energy as riding and, at normal riding speeds, humans on foot simply drop off the scale.
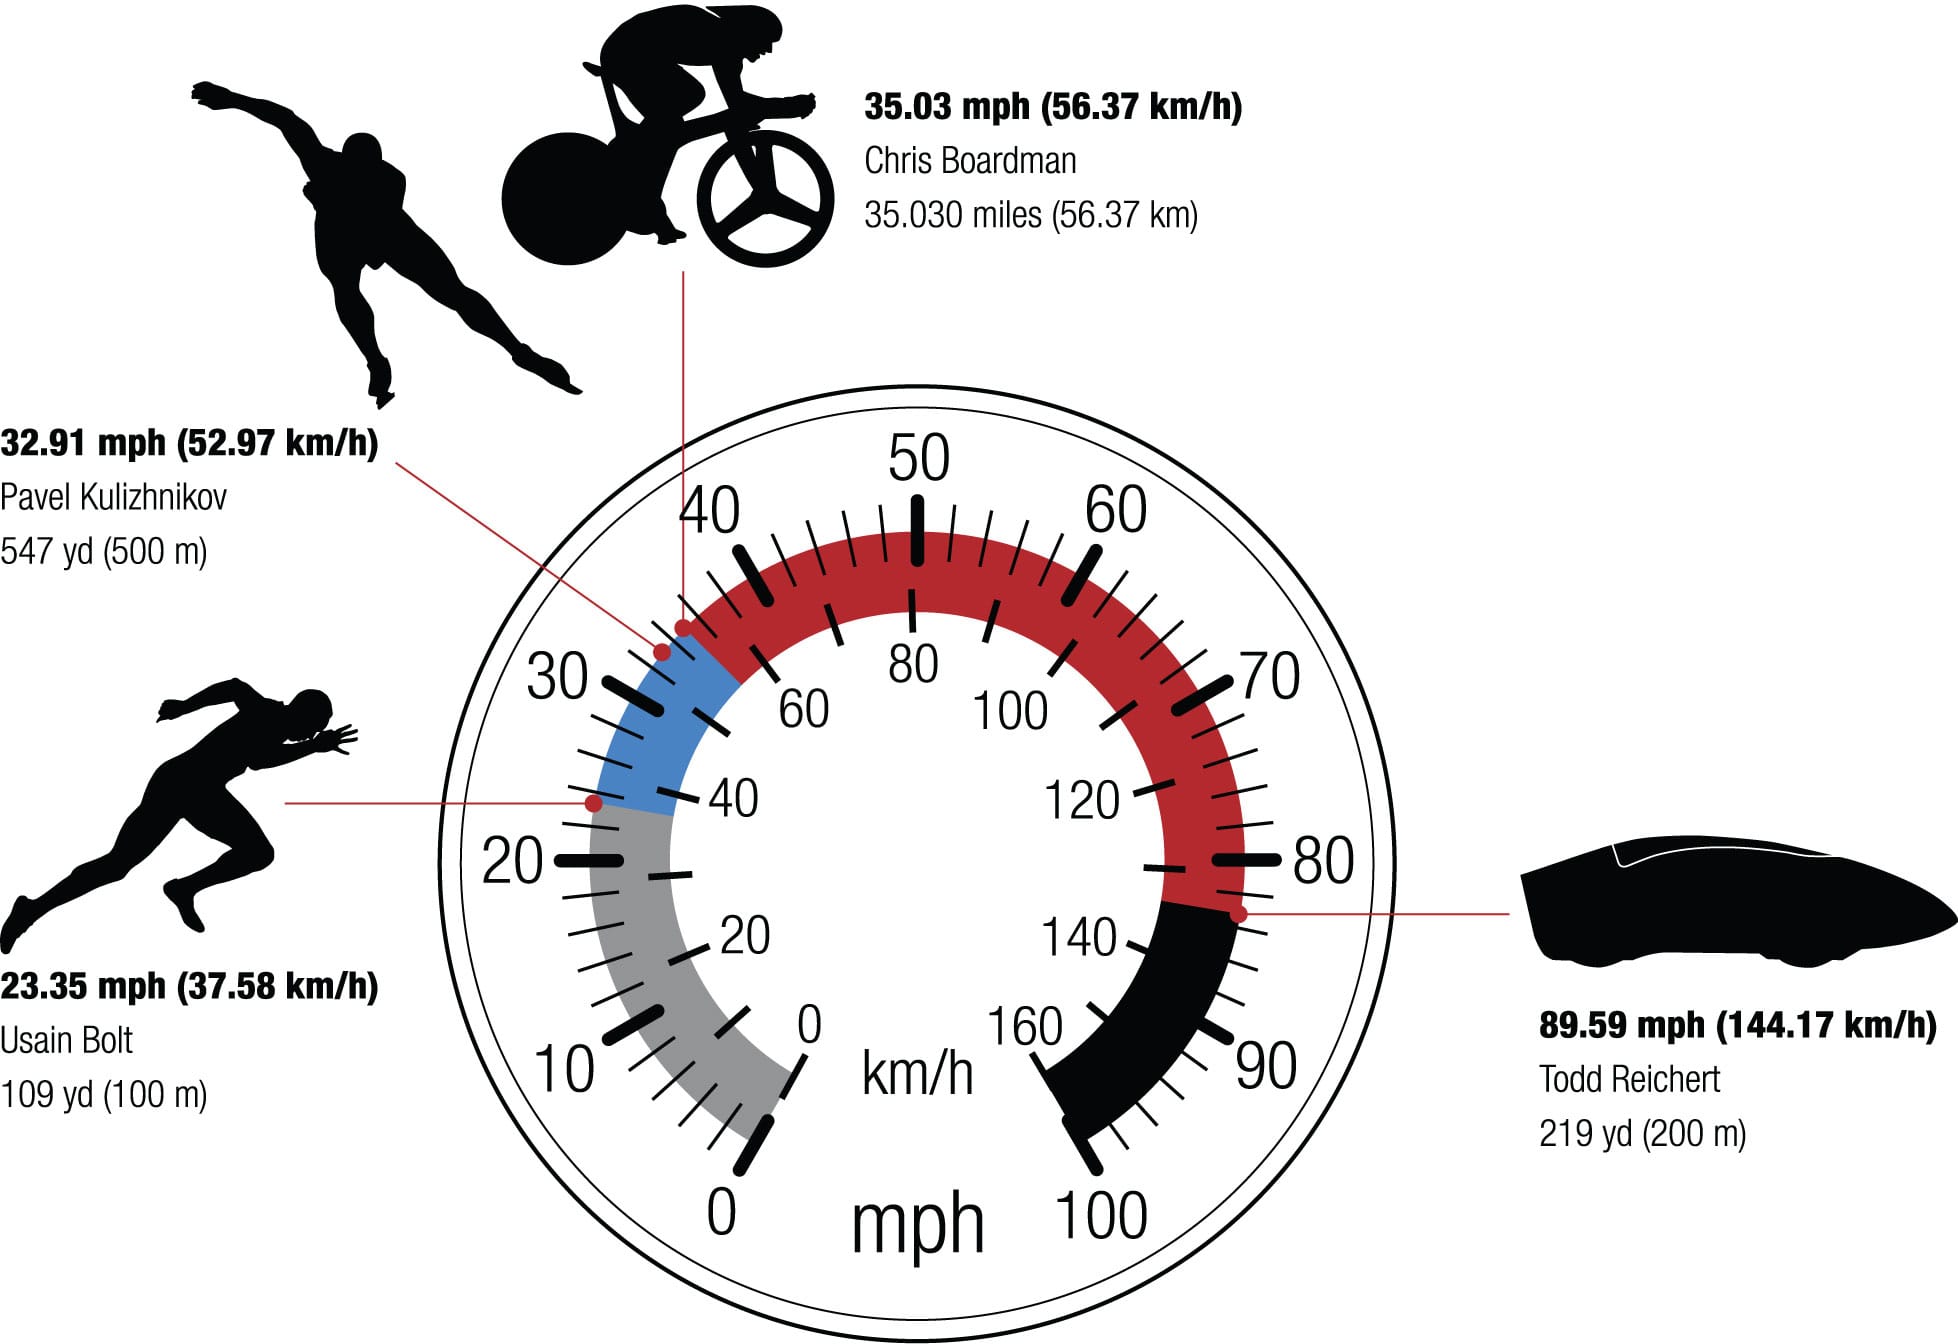
Faster and farther The plain fact is that the world’s fastest runners cannot keep up with a cyclist. Usain Bolt ran at 23.35 mph (37.58 km/h) in the 2009 Berlin World Championships, but that was for less than 10 seconds. Speed skaters, too, trail behind cyclists—even Pavel Kulizhnikov, who set a world record of 32.91 mph (52.97 km/h) over a 547-yard (500-meter) course. Thanks to the brilliant mechanical advantage of the bicycle, top cyclists can quickly outstrip both to achieve 40 mph (64 km/h) over similar distances. And no athlete in one hour could run the 35.03 miles (56.37 km) that Chris Boardman rode in that time at the Manchester (UK) velodrome in 1996. When it comes to human-powered travel, nothing beats cycling. In 2016, Todd Reichert reached 89.59 mph (144.17 km/h) riding the Eta, a recumbent bike in an aerodynamic shell.
Pedal power
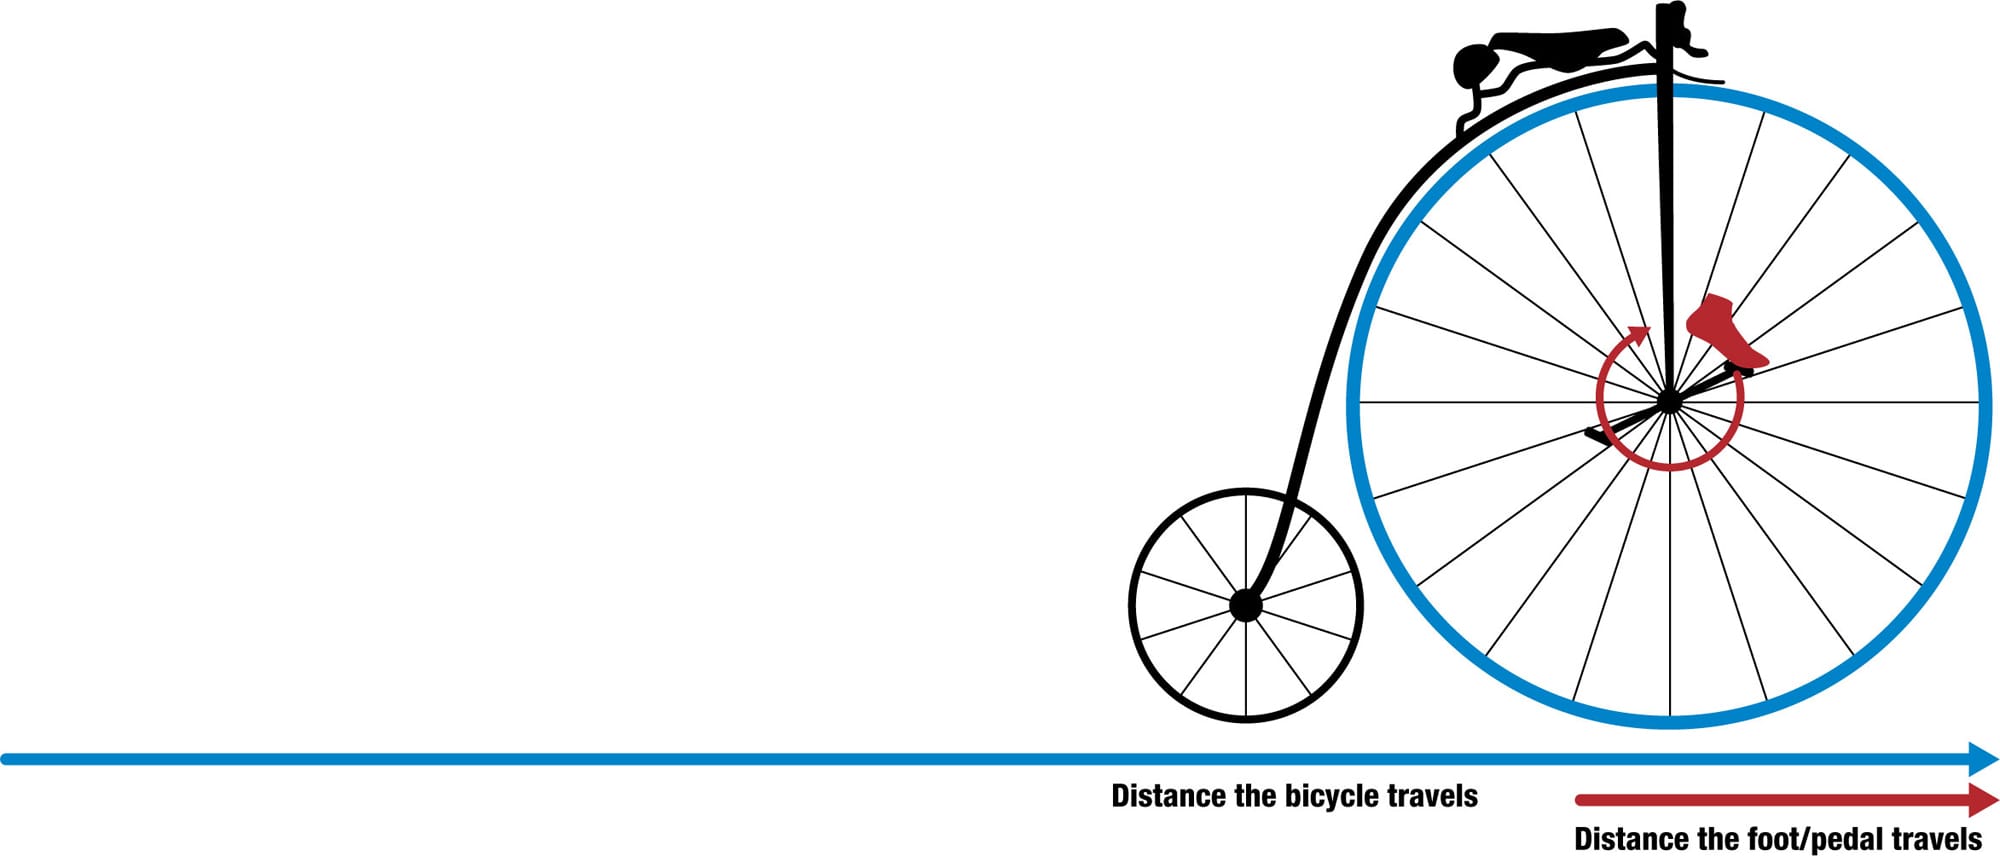
Wheel radius to crank length ratio The pedal as a lever gives a mechanical advantage which, in its simplest form, can be calculated as the ratio of the wheel radius to the crank length. As an approximate example, a direct-drive High Wheeler with a wheel radius of 30 in (75 cm) and cranks 6 in (15 cm) long amplifies the distance moved by the ratio 30/6 = 5. That is, with one revolution of the pedals, the big wheel will travel 15 ft (471.25 cm) along the ground, five times greater than the 3 ft (94.25 cm) the Victorian rider’s foot has traveled around the axle. The real magic of modern bikes is that they have gears, so the rider can choose their preferred ratio at any time.
What is the most efficient design?
Which type of bike should I choose?
While most bicycles use the same basic design, there are many variations on the theme, each with a different level of efficiency. Most have pedals, a chain, brakes, a saddle, and handlebars; many have gears. Those are about the only common areas; like most adaptable creatures, bicycles have evolved into a multiplicity of designs, each excelling in a particular niche.
Some designs are conceived to be efficient for a single purpose. A track bike, with its stiff frame and no brakes, may not be very comfortable but at a velodrome it allows the rider to reach very high speeds. A mountain bike has suspension that smooths rough terrain, but its fat, heavy tires prevent it from breaking any speed records. A hybrid may be equally at home commuting in the city and roaming the trails. The key to choosing a bicycle is to identify what area of efficiency is your key criterion. That decision will dictate the choice of wheels and frame shapes.
The vast majority of bike frames rely on engineering’s favorite shape—the triangle. It’s the strongest two-dimensional geometric shape, which is why the main part of the frame is, or approximates to, a triangle. Admittedly, the top tube may not be horizontal and a short section of head tube may add a fourth side a few inches long, but designers try to get as close as possible to a triangle because it is the most stable and rigid structure for a given mass of material. In a triangle, the three fixed tubes share the transmission of forces between them when put under pressure or stretched. The triangle can be deformed only by changing the length of one of its sides or by breaking it.
Variations on this triangular principle can be seen at the core of each style of bike, playing a key part in the relative power requirement and comfort of each model. The cycling science of frame triangles is more fully explored shown here.
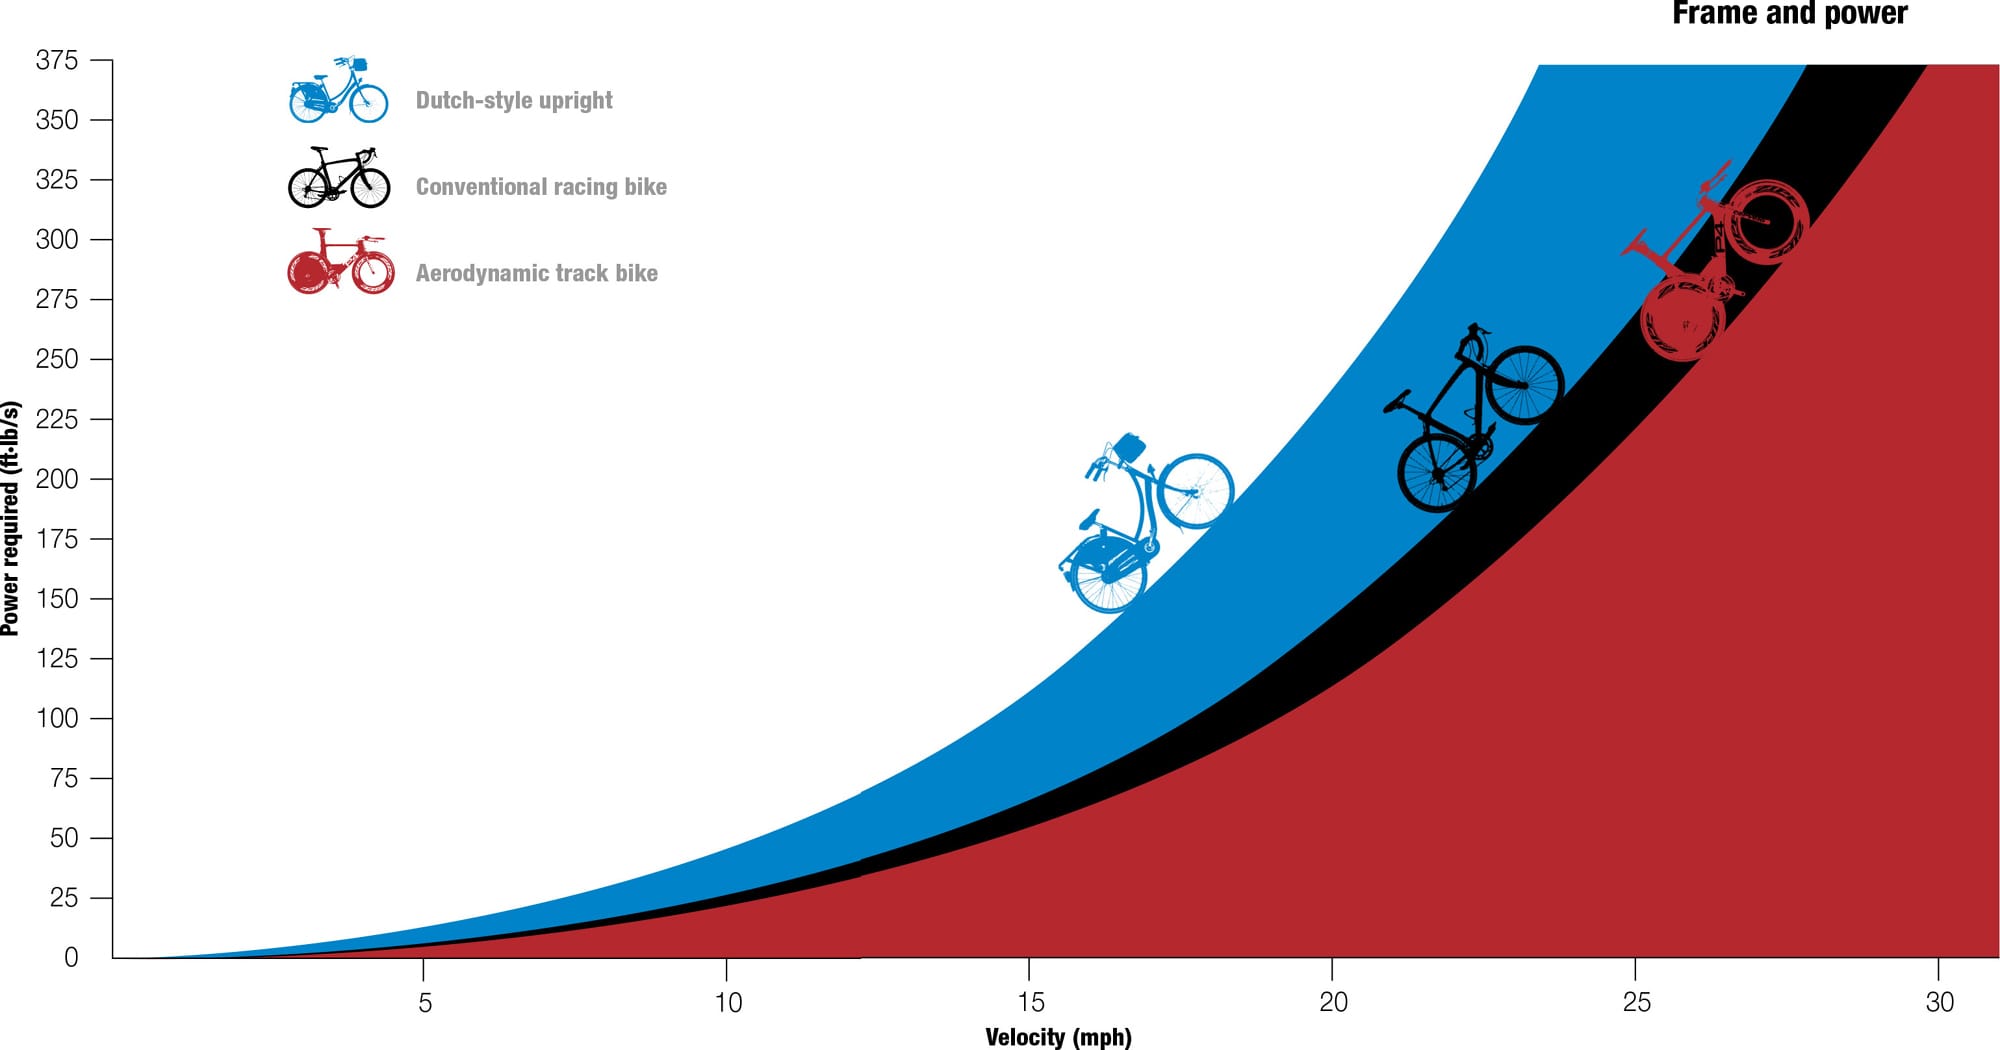
Power requirements This graph demonstrates how the power efficiency of different styles of bike becomes more significant at the top end of the speed curve. At speeds under 6 mph (10 km/h), the Dutch-style upright bicycle only needs a little more pedal power from its rider than does the sleek velo-raptor. As soon as the rider gets cranking, however, the efficiency of the upright slumps while the racing bikes start to deliver on what they were built for: speed. If you want to save energy at speed, then you have to sacrifice comfort and carrying capacity.5
Seated rider
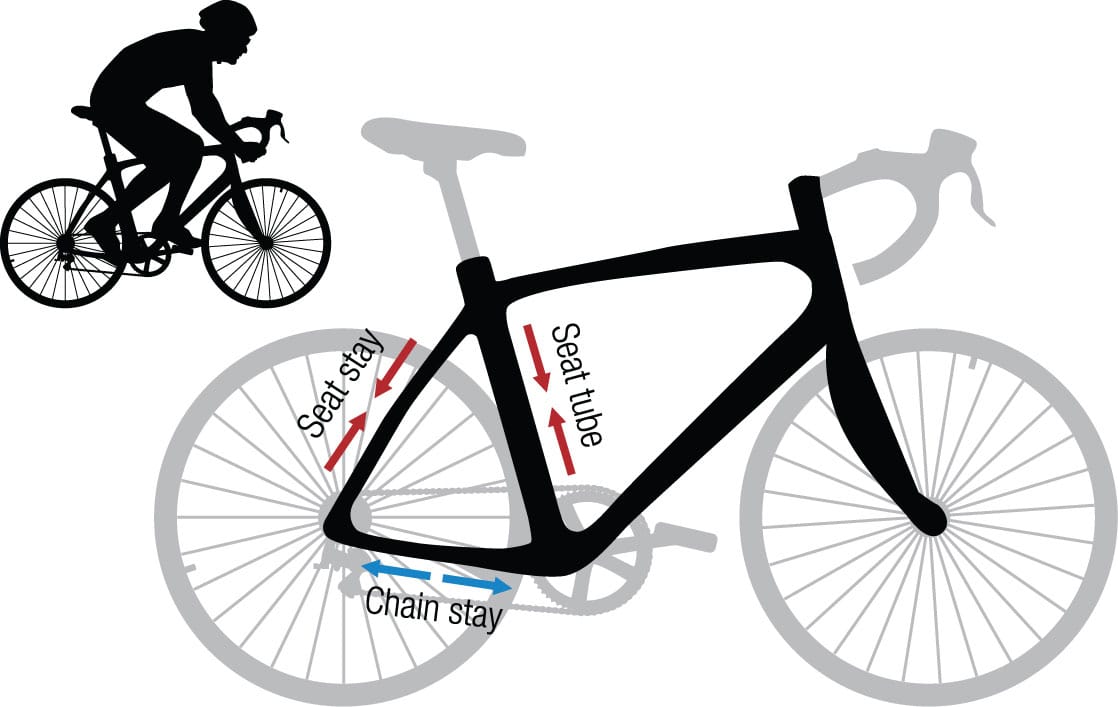
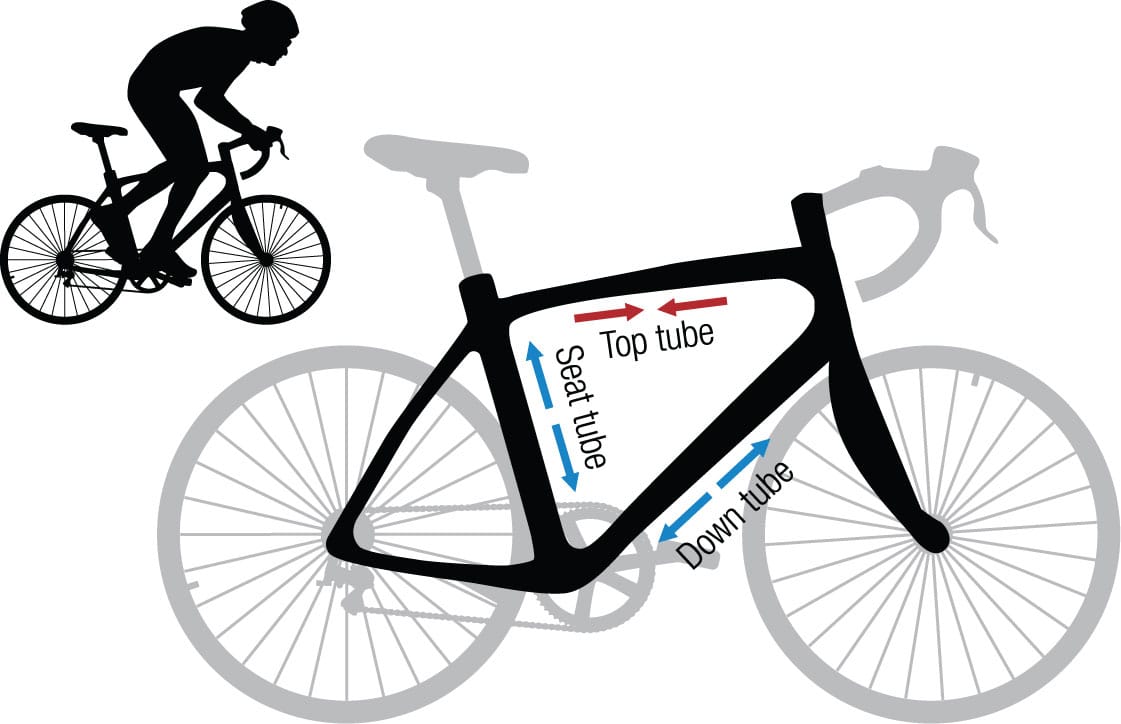
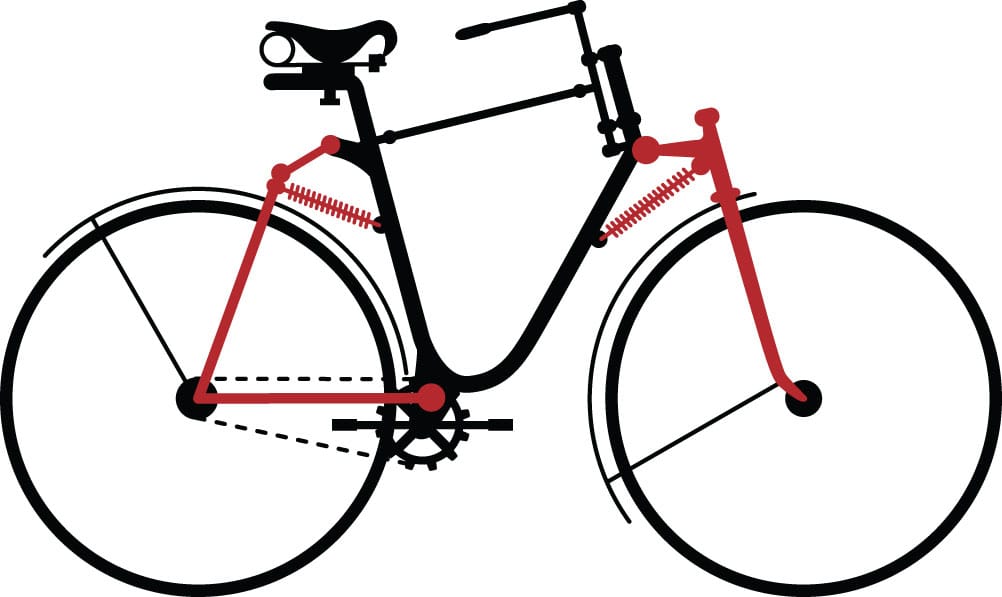
The power of triangles The triangle frame excels at the transmission of forces without distortion. When a rider sits on the saddle (left), the two adjacent sides (the seat tube and the seat stay) share that load, while the opposite side (the chain stay) is put under tension. When the rider stands up (right), the down tube and seat tube are stretched (and the bottom bracket supports their weight through the pedals), while the top tube is compressed and stops the bike from collapsing in the middle.
Standing rider
How does bike geometry relate to gender?
Why are men’s and women’s bikes different?
You’ve probably noticed that men and women are different. So are their bikes. Physiological differences mean that many models are configured differently for the two sexes. The main design changes are in frame dimensions and in the detailing of the main contact points—the handlebars and saddle.
Historically, women’s bikes did not feature the horizontal top tube, leaving an “open” frame. This allowed women to step on without having to lift a leg and expose an ankle. It also better accommodated long skirts. The fact that many women’s bikes are still designed like this is due less to science than to convention. This open-frame design does not offer the structural integrity of a closed triangle, so it is usually strengthened using extra tubing—with the penalty of increased weight. A hybrid bike without a top tube can weigh 7 oz (200 g) more than a closed-triangle frame.
Today, however, the main issues with women’s bikes are the dimensions and geometry. Women are, on average, 15 percent lighter and 8 percent shorter than men. Because one of the main functions of the frame is to place the rider in a stable, comfortable position between the wheels while pedaling at their optimum efficiency, it is clear that women’s frames should not just be smaller but should also have different proportions. The first consideration is to bring the saddle and the handlebars closer together to reduce the degree of back and arm stretch required of a woman rider. Narrower bars are used to complement the female rider’s narrower shoulders, often with a shallower drop and shorter reach. The female rider’s smaller hands are best matched to smaller gear shifters and brake levers that rest closer to the bar. Another contact point, the saddle, should also differ from that designed for a man. It needs to be wider to support the sit bones of the pelvis and have a shorter nose to prevent uncomfortable pressures on soft tissue.
Saddle science
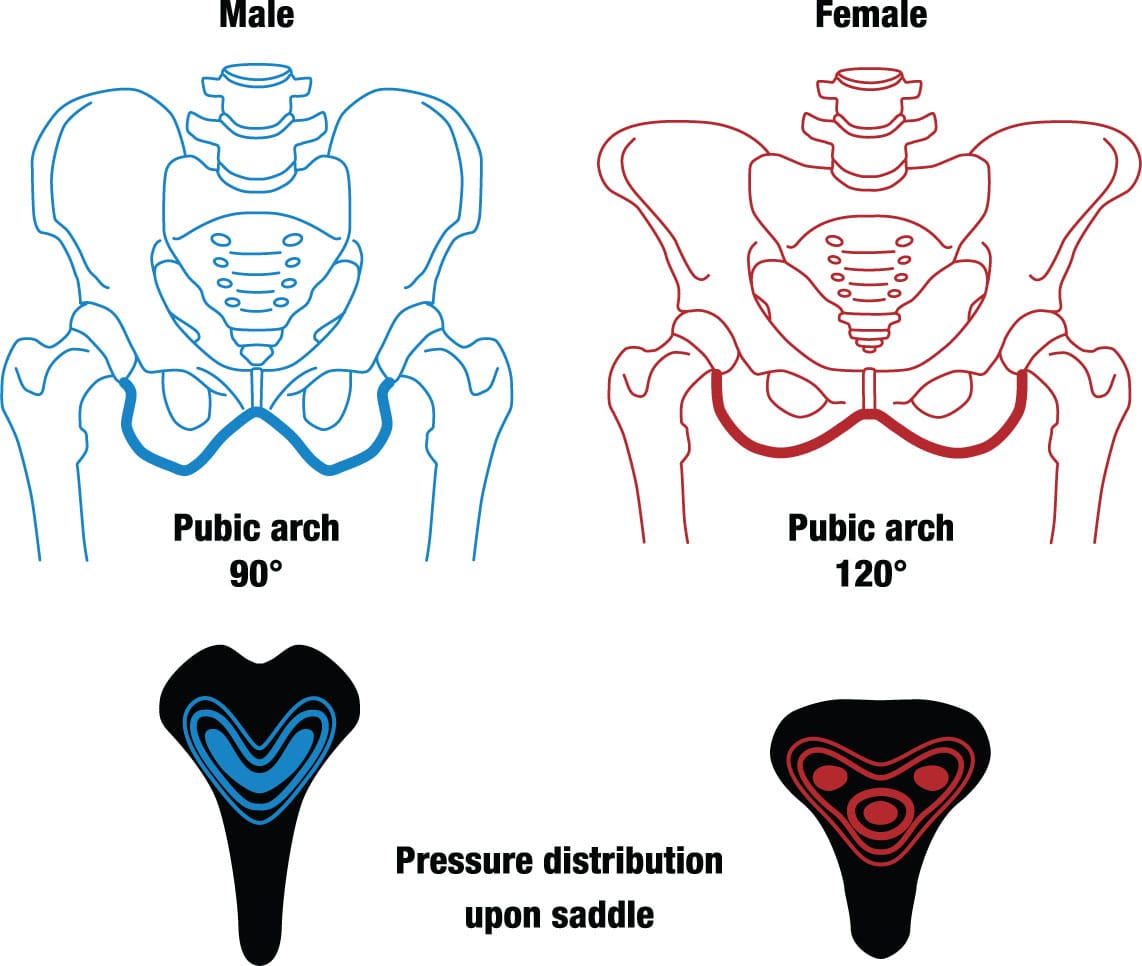
Fundamental difference The gluteus maximus muscle covers the sit bones until one sits down—then it leaves part of the pelvis, called the ischial tuberosity, unpadded and bearing the rider’s weight. It’s the saddle’s job to support this comfortably. Men don’t give birth, so these swellings of the pelvis are narrower than they are for women and the saddles are designed accordingly.
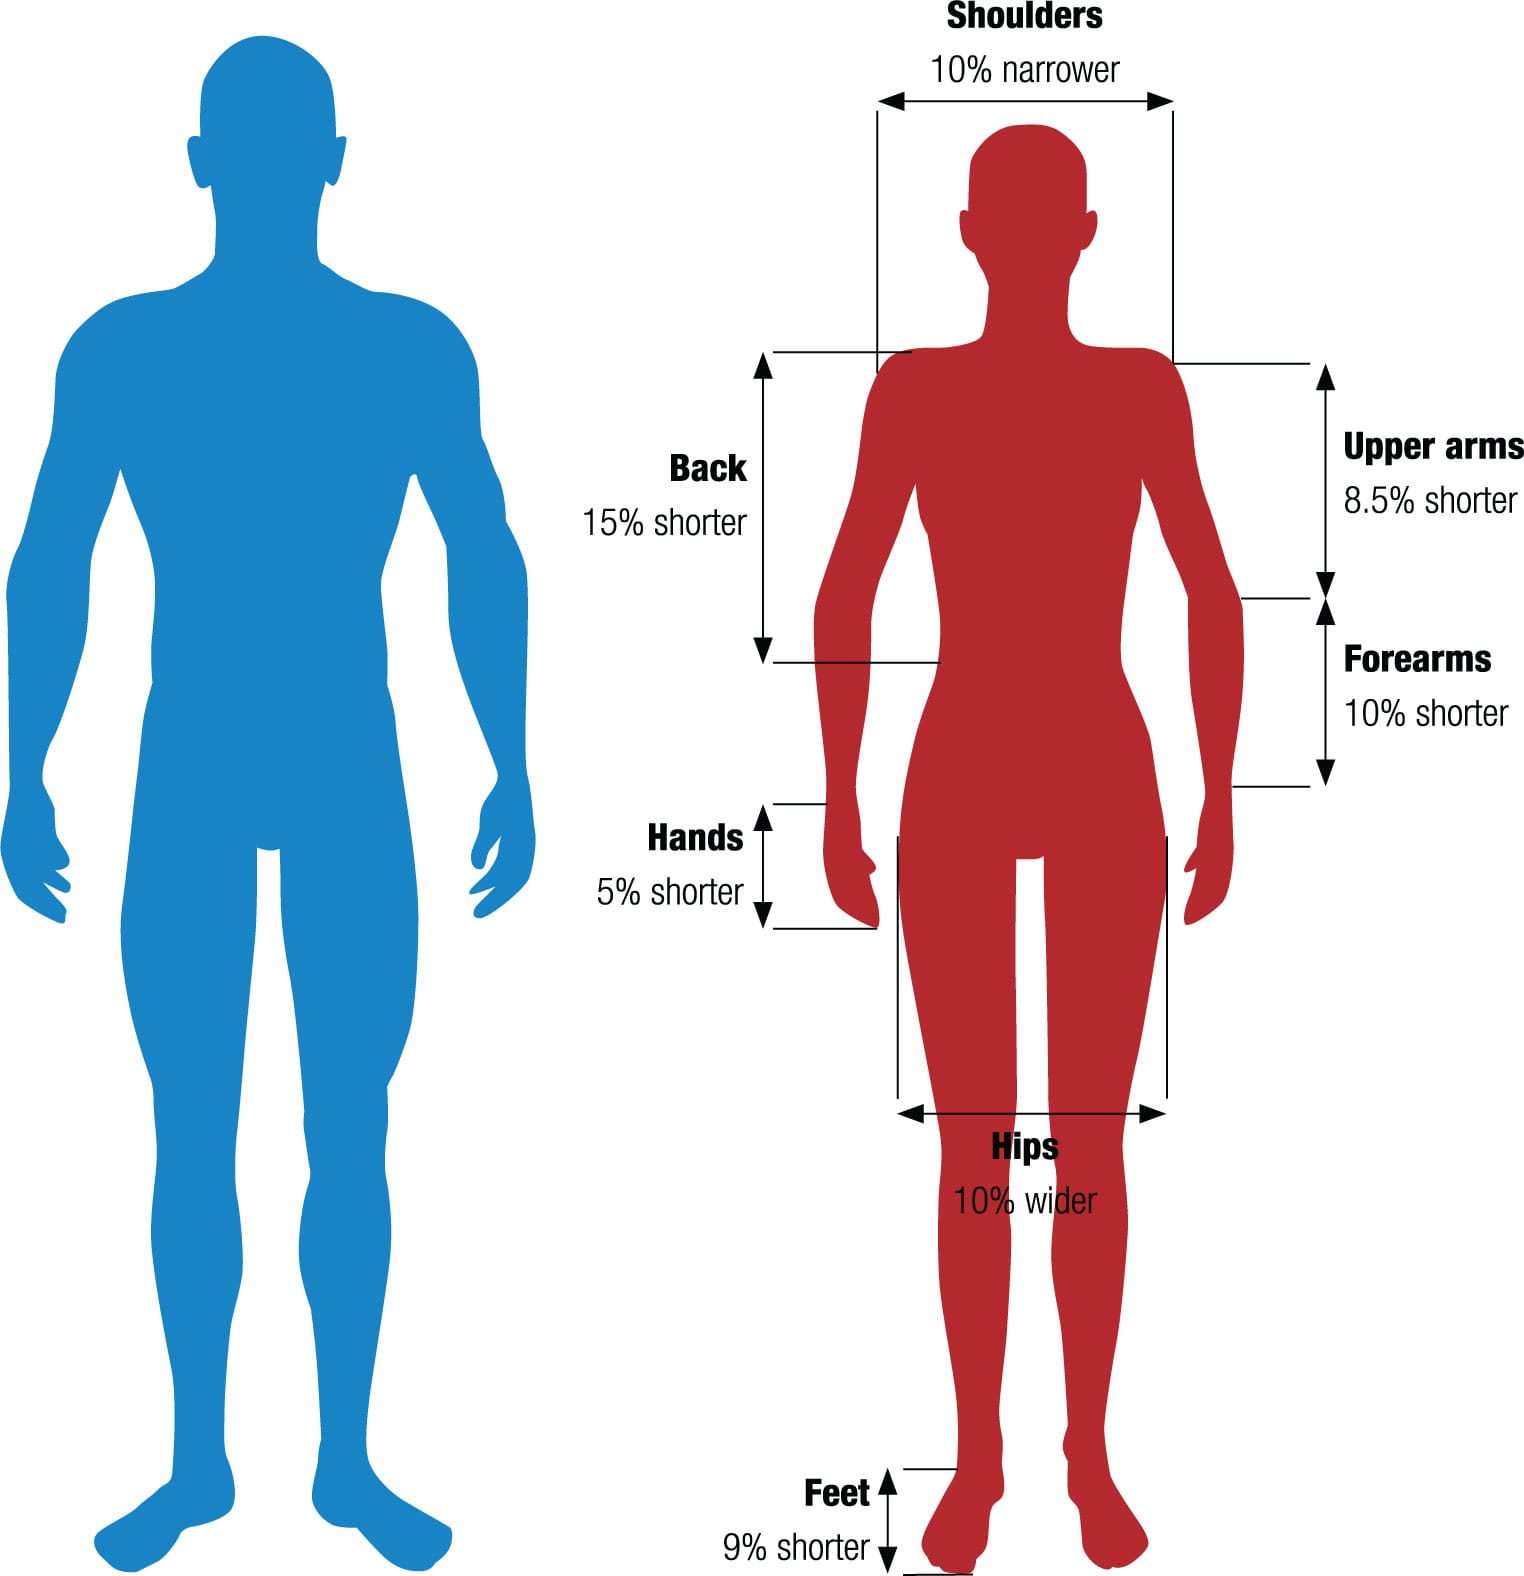
Body of evidence Research has shown that the average weight of men 20 years old or over is about 195 lb (88.3 kg), while for women it is about 165 lb (74.7 kg). Mean height for men is 5 ft 9 in (176 cm), and for women 5 ft 4 in (162 cm).6 While these general figures might suggest that women simply need smaller, less sturdy bikes than men, more important results are revealed when the anatomy is measured segment by segment. Women’s skeletons develop sooner than men’s and are fully mature at about 18 years old. Men’s skeletons continue growing, maturing about three years later than women’s—so their frames tend to be bigger and their limbs longer and thicker. Cycling is best when the bike is tailored to closely match the rider’s physique, so gender-specific models are not a ploy of marketing departments—they make riding more comfortable and efficient.
Anatomy of the bike
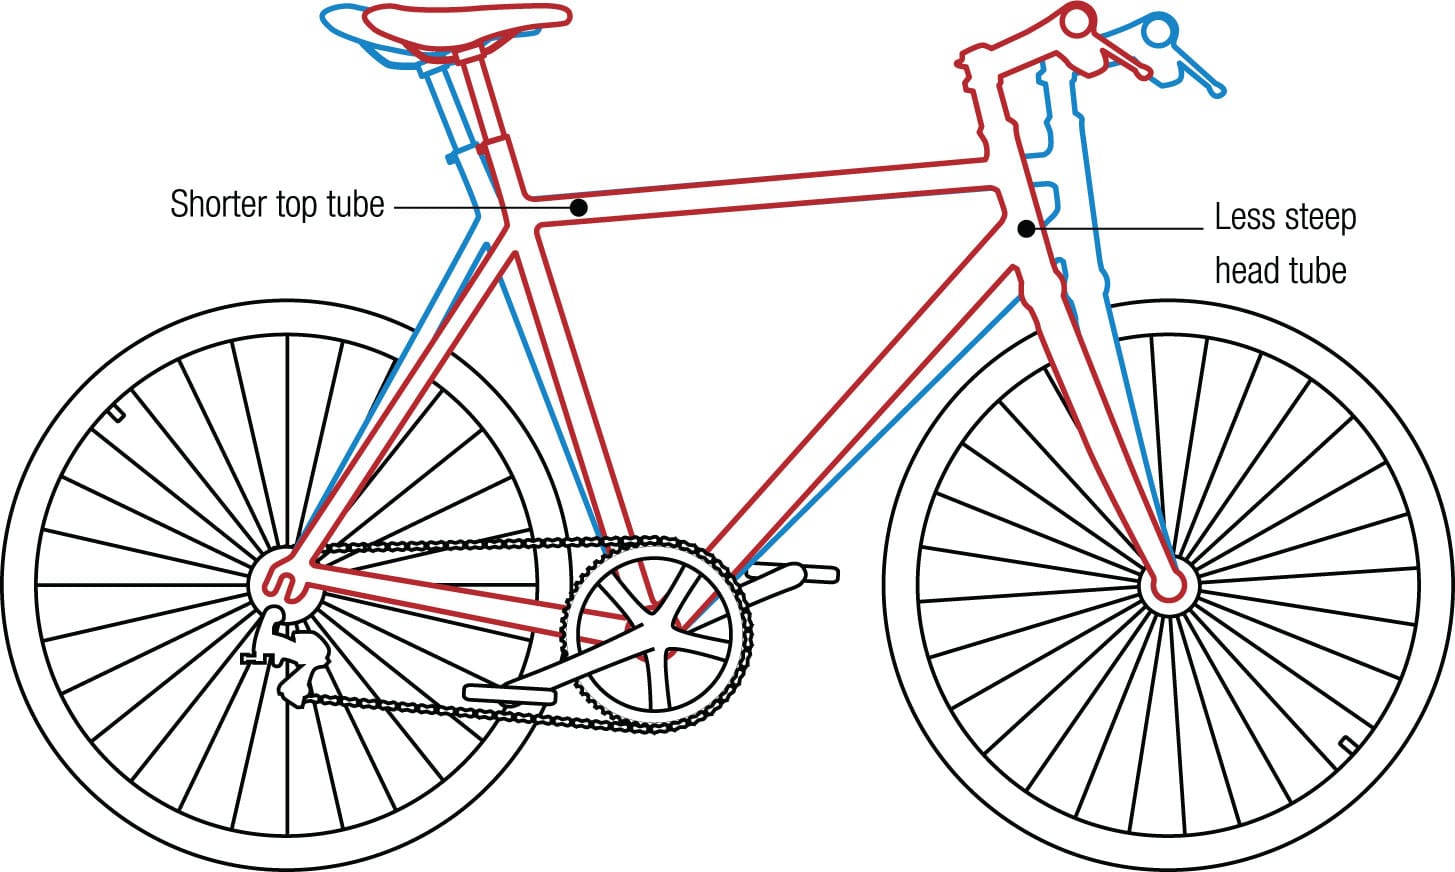
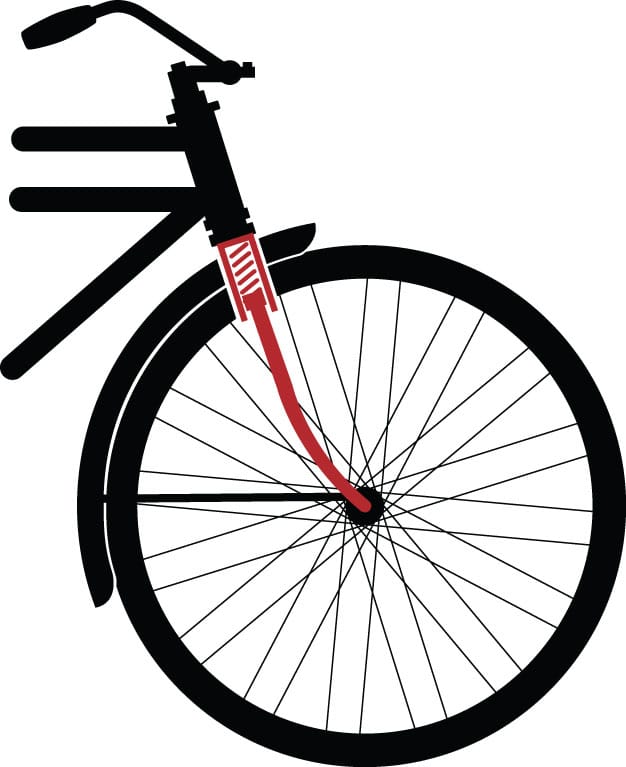
Comparative bike frames The primary difference between the male and female bike frame is the distance between saddle and handlebars. When designing a frame for a female rider, simply making the top tube shorter can have unwanted side effects: for example, it would normally make the steering more sensitive than before. The problem can be avoided by making the angle of the head tube—through which the steerer tube runs, connecting the fork to the handlebars via the stem—less steep. Assuming the geometry of the fork has not been changed, this effectively pushes the front axle farther forward, reinstating the distance between the two wheels.
What is the environmental impact of cycling?
Will cycling save the planet?
The science endorses the gut feeling that cycling has a low impact on the environment, compared to other modes of transport. For every $1,000 spent by manufacturers to make bicycles, 1 short ton of carbon is generated.7 Admittedly, this is 45 percent worse than the auto industry’s figure, but $1,000 will buy many more new bikes than cars. So, per vehicle, making bicycles is many times cleaner than making cars.
When new bikes hit the road, they are friendlier to the Earth, too. For a given journey, the energy consumed by a driver is at least 42 times more than by a cyclist, a bus passenger uses 34 times as much, and a train passenger 27 times as much. The cyclist requires less space than all but the train passenger and pedestrian. For journeys of up to 6 miles (10 km), the bike is definitely best for both rider and the planet. In terms of lifespan, life-cycle analysis at MIT shows that the bicycle consumes the lowest energy per passenger-mile across its entire life, compared to other forms of transport.8 If annual cycling distance is increased, revised life-cycle analysis calculations will boost the green credentials of the bicycle even further. And there is one more element of impact that vehicles have on the environment—noise pollution. Is there any vehicle quieter than a bicycle?
It’s all very well drawing comparisons with other modes of travel but there can be no doubt that riders do use some of the Earth’s resources to be able to cycle—in the form of food. Food production and transportation generate carbon dioxide and other greenhouse gases, the total weight of which is used as a measure of the impact on our planet. A rider cycling 1 mile (1.6 km) and metabolizing roughly 50 calories entirely from bananas would be responsible for the creation of 21/4 oz (65 g) of greenhouse gases. If instead they metabolized these calories from breakfast cereal with milk, the toll on our atmosphere would rise to 31/8 oz (90 g) of greenhouse gases. If those figures are hard to stomach, consider the impact of refueling with a cheeseburger—that’s 91/8 oz (260 g) of greenhouse gases.9
Urban travel advantages
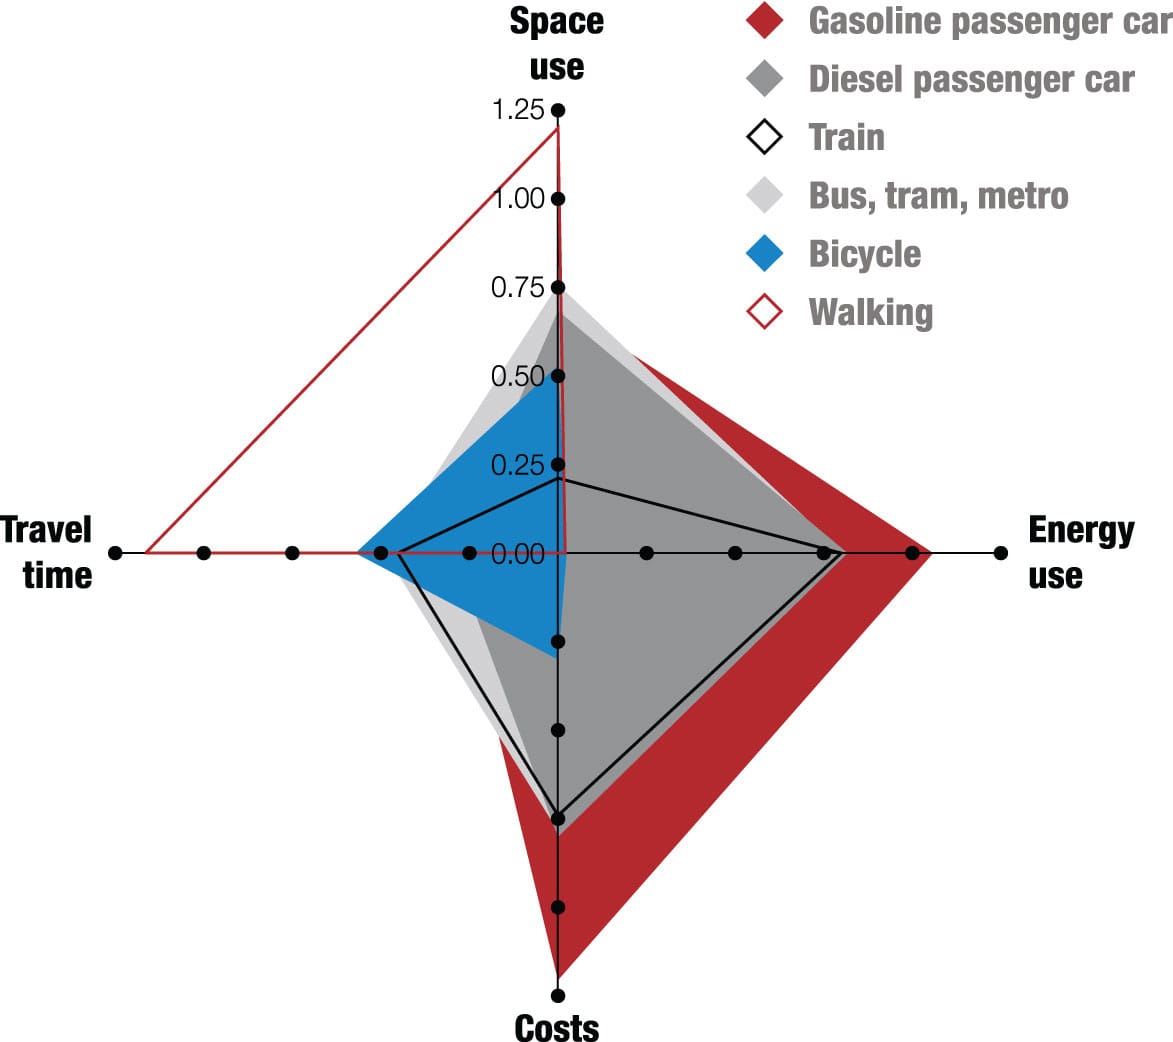
Cheaper, sustainable Researchers in the Netherlands studied four elements of urban journeys of 1.6 to 3.1 miles (2.5 to 5 km). The greater the distance from the center of the graph, the worse the score. The space-use figure was calculated by dividing the area occupied by the infrastructure by the annual distance traveled. The costs were just to the person traveling, not the cost of the infrastructure. Cycling is only marginally slower than the powered modes in these urban journeys, yet significantly cheaper and more energy-thrifty.10
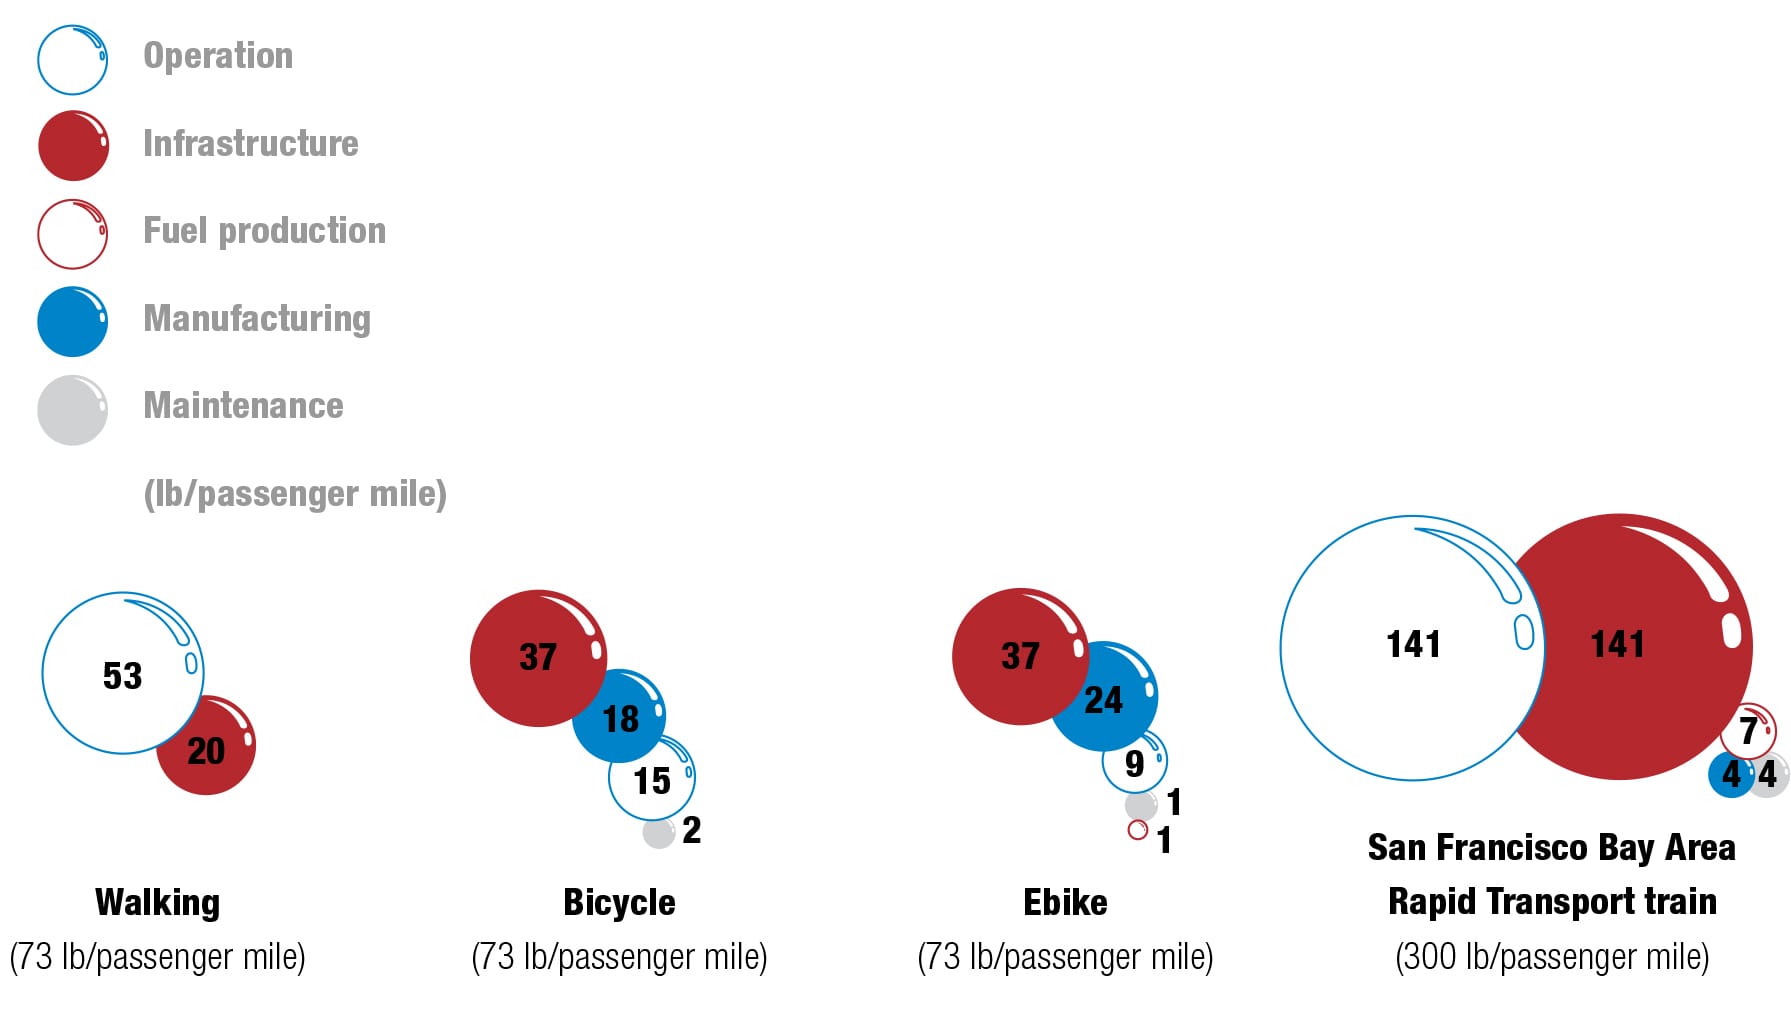
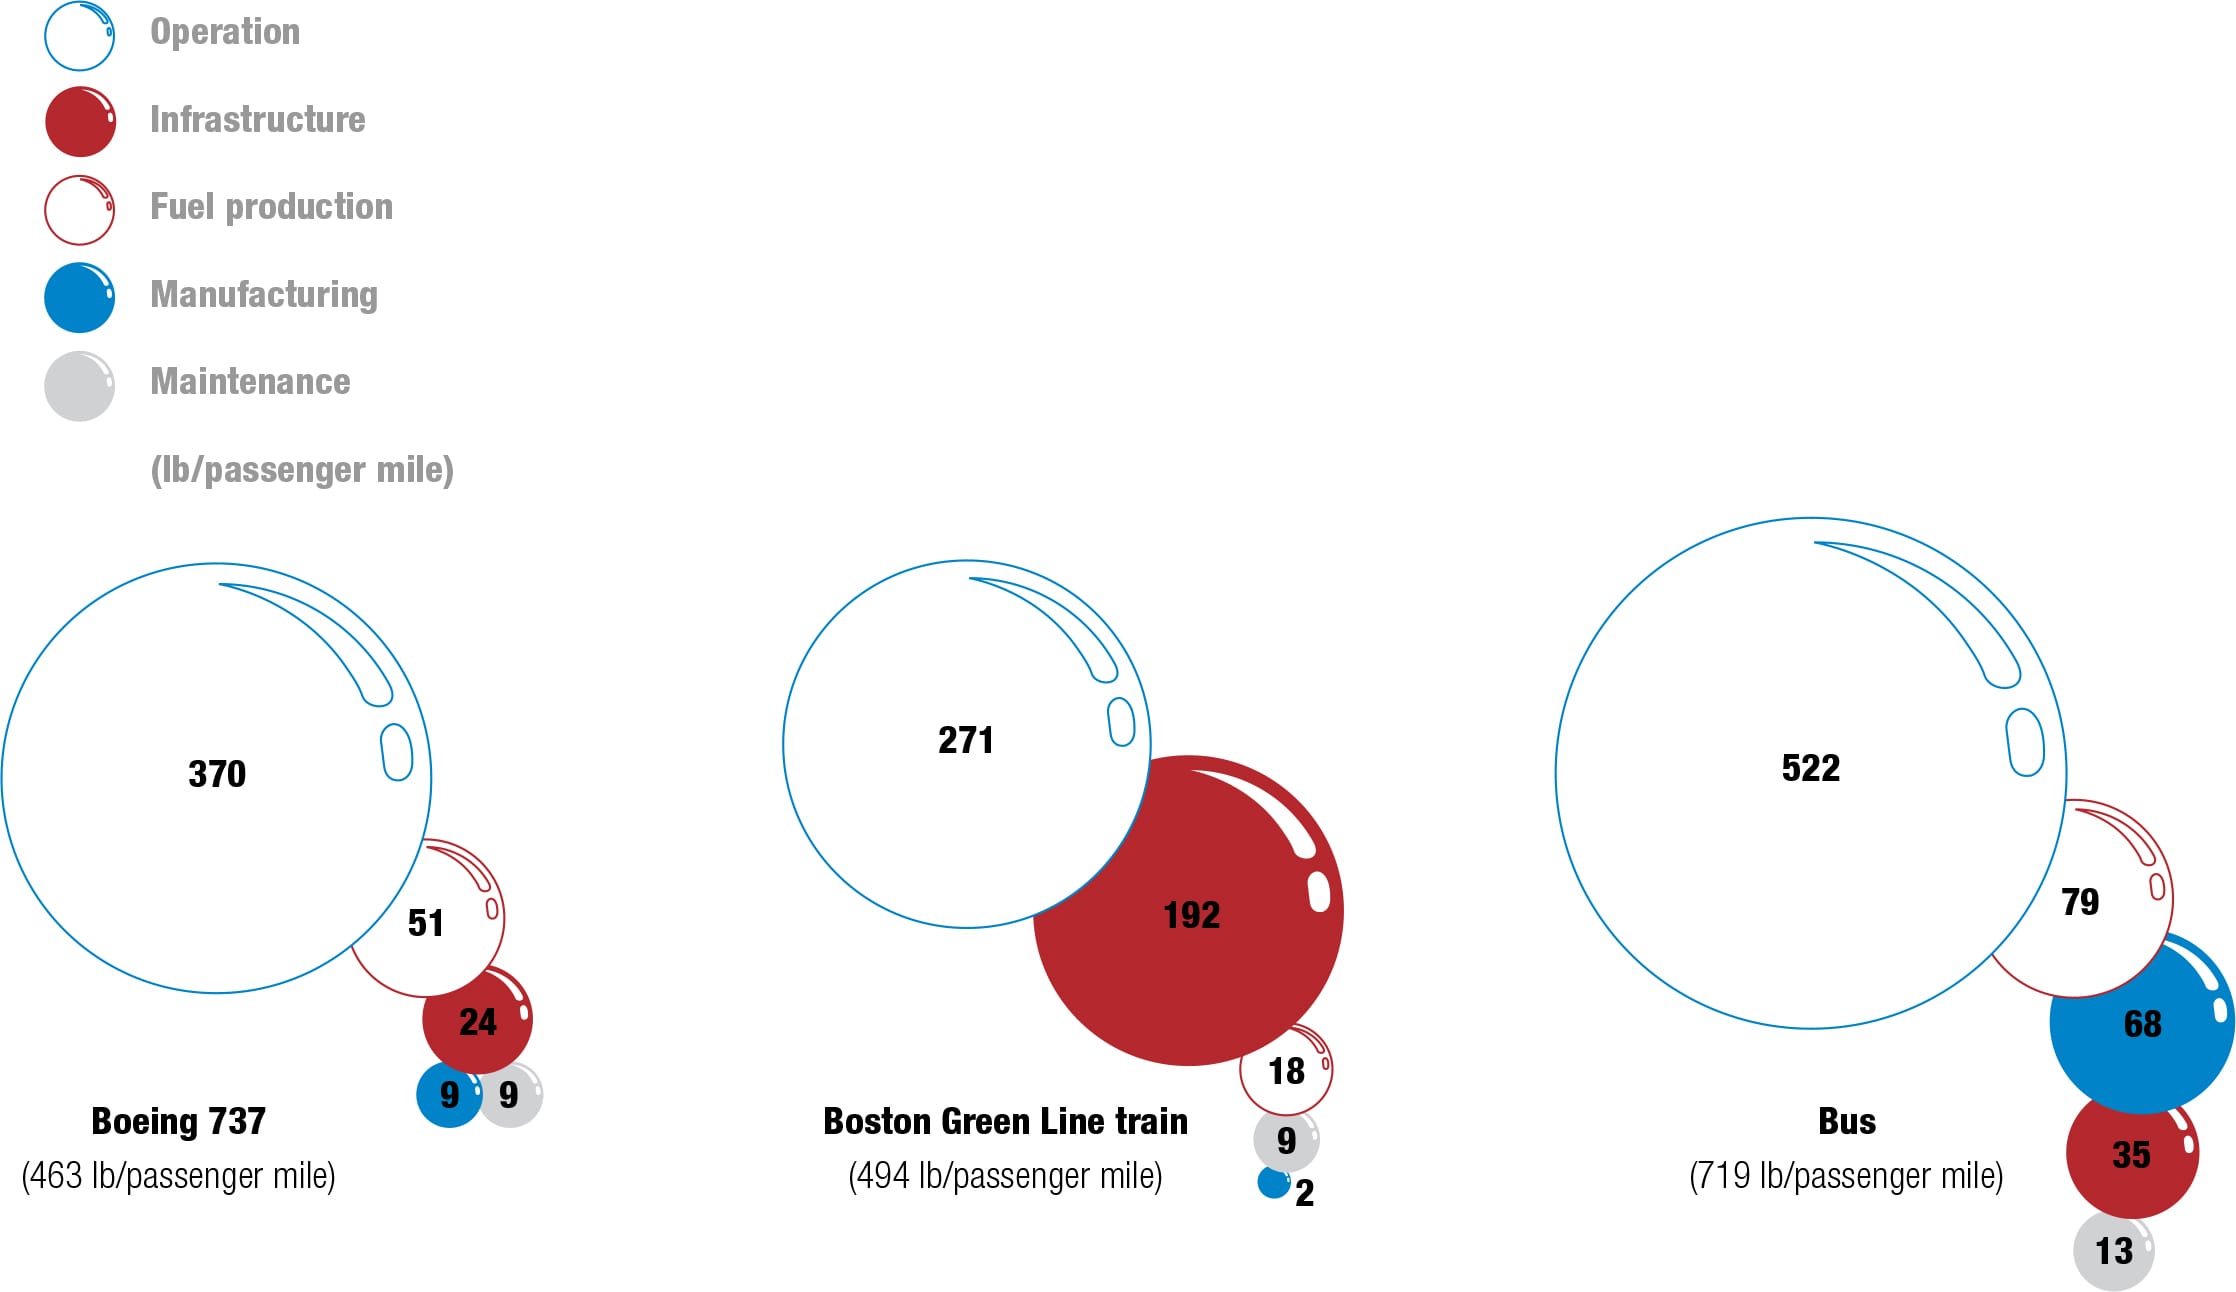
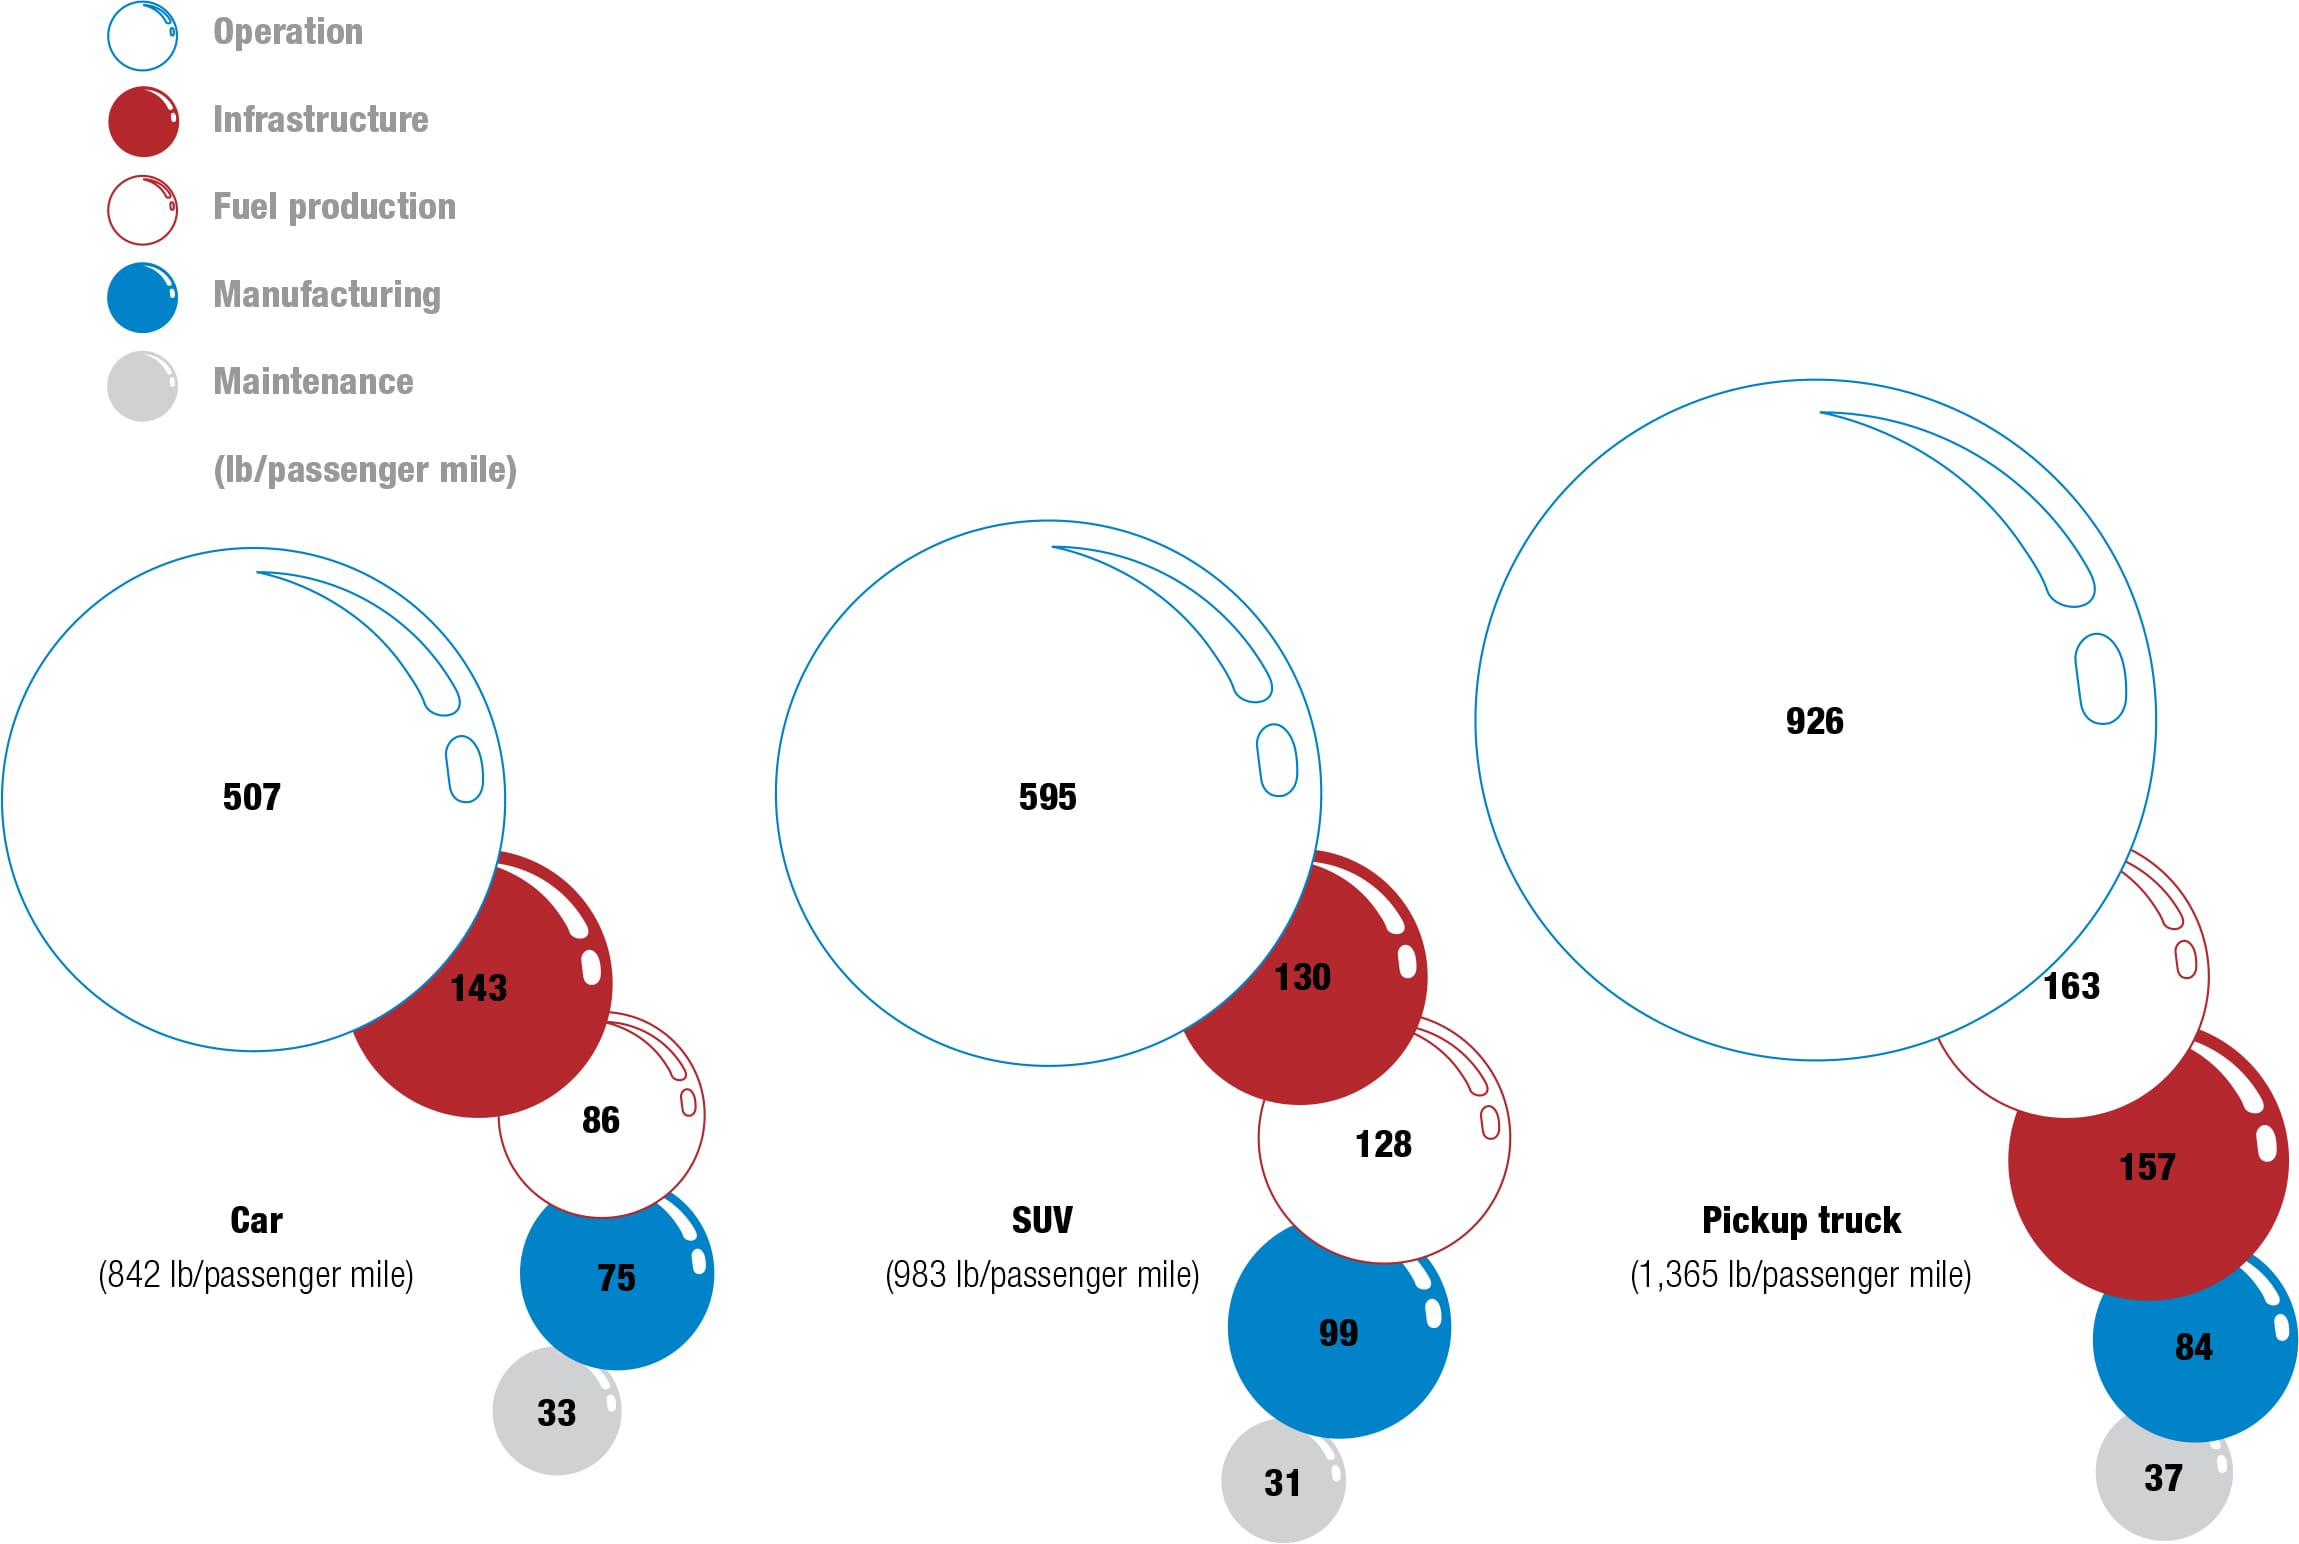
Lifetime greenhouse gas emissions For every mile it is pedaled in the course of its life, a bicycle uses the equivalent of 76 calories (319 kJ) of the Earth’s resources. The next most frugal is a peak-hour bus, which uses more than three times as much. This also translates into higher greenhouse gas emissions. Bicycling creates about 73 lb of greenhouse gases for every mile of its life. On average, a train is roughly five times more polluting across its lifetime, a bus almost 10 times worse, a car 11 times, an SUV 13 times, and a pickup truck 18 times dirtier.11
How does cycling benefit the cyclist?
Can cycling help me live longer?
Cycling does not guarantee immortality but it can increase your life expectancy by two years or more. Scientists worked this out by monitoring almost 17,000 Harvard alumni for up to 16 years. By their eightieth birthdays, those who had exercised adequately had extended their expected lifespan by an average of two years.12 An extensive study in Copenhagen, Denmark, lasting 14 years and involving 30,000 adults, showed that those who did not cycle to work had a mortality rate 39 percent higher than those who did.13 Blue-collar workers who cycled were found, in another study, to be as fit as their non-pedaling colleagues who were 10 years younger.14
While all exercise burns calories and so helps individuals to keep their weight down, there are few such activities that can be done while traveling. Bicycle commuting burns an average of 542 calories per hour, and a study of nearly 2,400 adults found that those who biked to work were fitter, leaner, and less likely to be obese. They had better triglyceride, blood pressure, and insulin levels than those who didn’t actively commute to work.15
The sensible cyclist will want to compare the relative risks of traveling daily by car with those of riding a bike. This has been analyzed by a team in the Netherlands, as shown on the right. They demonstrated that the health benefits of cycling relative to car driving substantially outweigh the risks created by air pollution and traffic pollution.16 With those risks understood, it’s worth emphasizing that cycling to work has benefits beyond personal fitness. A survey by the UK’s Chartered Management Institute found that cyclists are more likely to arrive at work on time, are more productive, and are less prone to stress than colleagues arriving by car or public transport.17 For many, it’s not practical to commute by bike, but for those who are lucky enough, the science appears to show that life is not only longer but also far more enjoyable.
The bike and the heart
Over an average lifetime, the expected increase in life expectancy for a modal shift from commuting by car to bicycle in urban areas was estimated to be from 3 to 14 months, or an average of 81/2 months, per person, due to increased physical activity.18
The researchers calculated the benefits of this shift from driving to cycling were nine times greater than the potential risks. Furthermore, they argued that there were benefits to the wider population due to lower pollution and fewer traffic accidents caused by cars.19
The reduction in life expectancy due to increased air pollution was expected to be from 0.8 to 40 days per person, while the increase in traffic accidents would result in another five to nine days lost on average, or around two weeks combined.20
Cycling and a healthy heart A 2010 Dutch study estimated the comparative health benefits and risks if 500,000 out of a total population of over 16 million switched to traveling short distances by bicycle instead of car on a daily basis. In the Netherlands, approximately half of all car journeys are under 41/2 miles (7.5 km).21
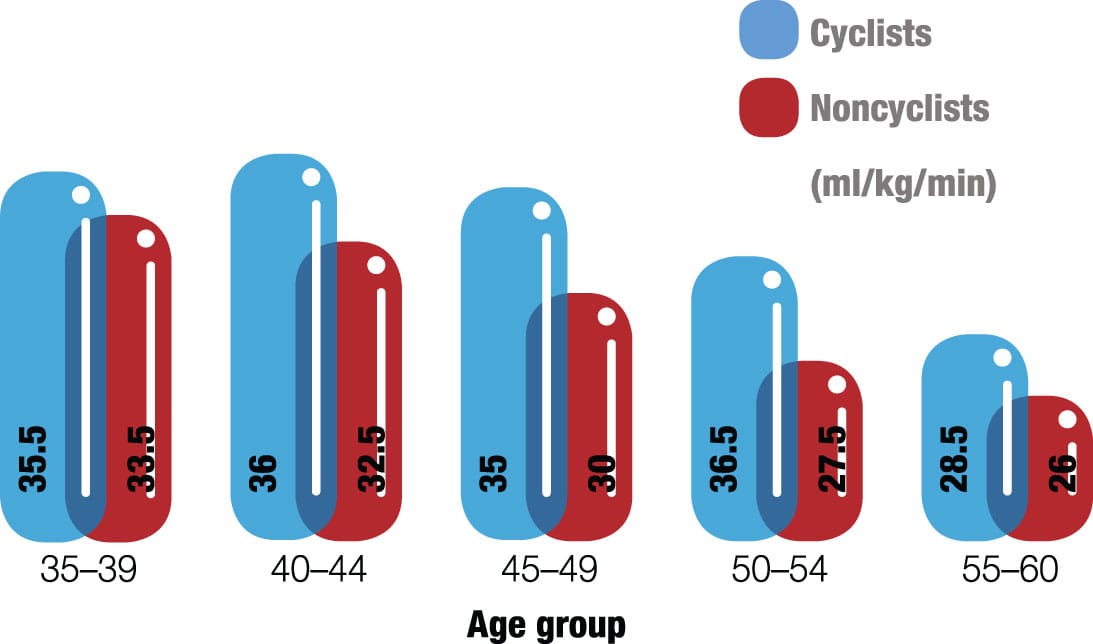
Oxygen uptake, cyclists versus noncyclists A survey of factory workers compared the fitness of cyclists with noncyclists. They measured their maximum oxygen uptake—VO2 max (milliliters of oxygen per kilogram of body weight per minute). The comparative scores indicate that cyclists are fitter than noncyclists, and suggest that the older you get, the better riding a bike is for you.22
Commuting advantages
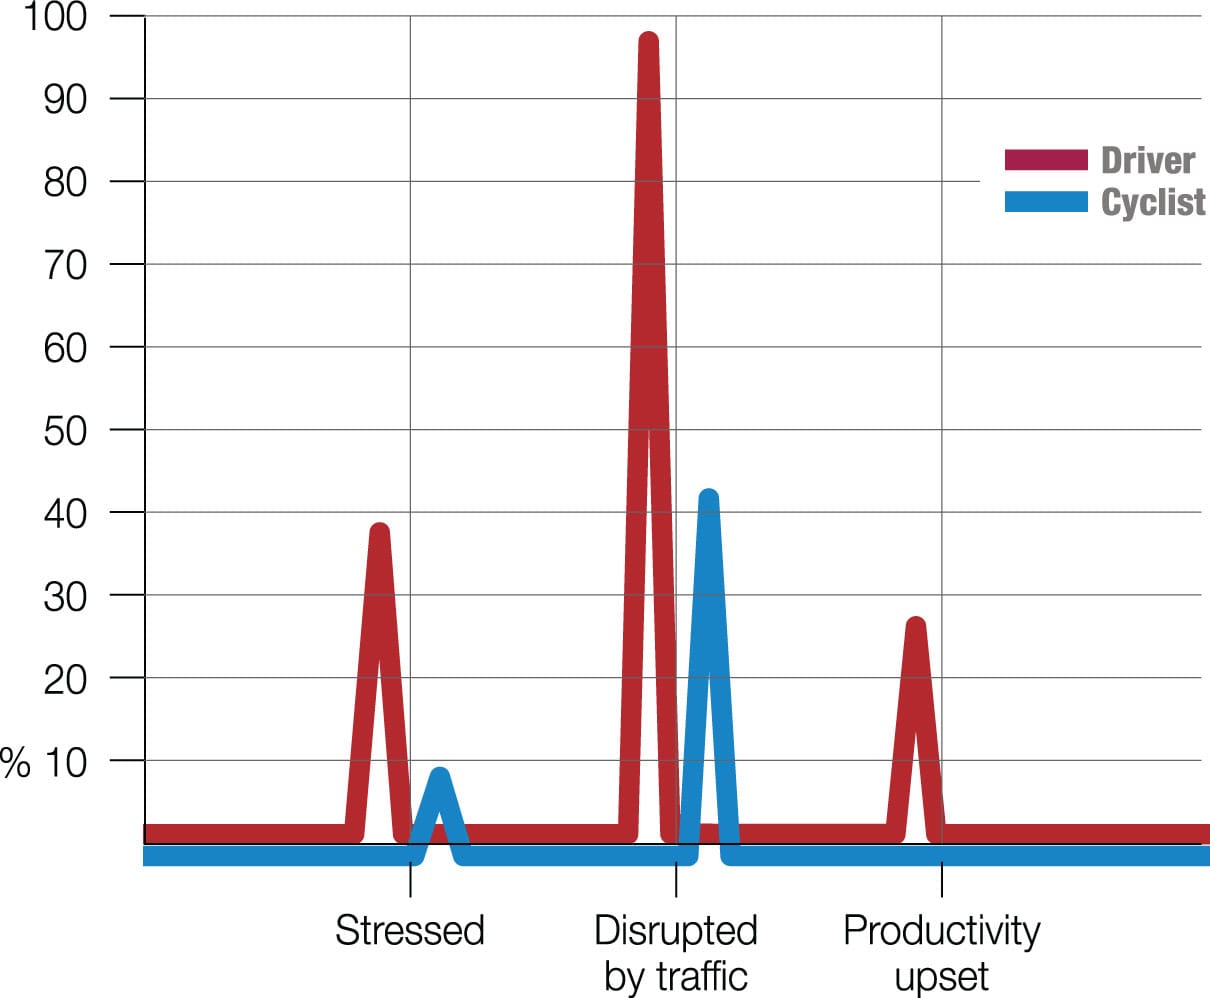
The comparative effects of cycling and driving to work In a study, 58 percent of cyclists said their journeys were never disrupted by traffic, compared to only 4 percent of drivers. Some 9 percent of cyclists were stressed by their journeys, compared to nearly 40 percent of drivers. Almost one-quarter of motorists felt their productivity was affected by the stress of their commute, compared to none of the cyclists.23
How risky is traveling by bike?
Is there safety in numbers?
Motorists are no safer than cyclists. Figures from the UK show that there are about 0.4 fatalities for every million person-hours of cycling—a dramatically low figure considering it would take one cyclist more than 2,000 years riding nonstop to build up that many hours. This is about the same as an average European driver’s risk of death, taken over their lifetime. The annual risk for drivers and cyclists is also very similar, and cycling is statistically at least 10 times safer than riding a motorcycle.
The more people cycle, the safer the roads seem to become, not just for cyclists but for all road users. In Portland, Oregon, all deaths from traffic accidents declined from 46 to 28 each year between 1997 and 2007, while the number of cycling commuters quadrupled to 6 percent of journeys. Similarly, cycle use in the Netherlands increased by 45 percent in the two decades to 1997, while cyclists’ deaths fell by almost 40 percent. In Berlin, between 1990 and 2007, the share of bicycle trips doubled to 10 percent, while serious injuries to cyclists fell by 38 percent.24
Is there a direct correlation between these statistics? The phenomenon of “safety in numbers” is not so hard to understand. A growth in the number of cyclists makes them more visible and drivers change their own behavior accordingly. Cities are more likely to provide safer road designs and facilities for cyclists when there are more of them about. And when some drivers switch to cycling, it means that there are fewer cars on the road and, hence, a reduced chance of anyone colliding with a high-speed chunk of metal. And drivers become more aware of what being a cyclist is all about, so they drive more considerately as a result. There is no doubt that cycling has the power to improve road safety for everybody. Unlike the drivers of motorized vehicles, cyclists—because they are associated with a much lower level of kinetic energy—almost never injure or kill other road users or pedestrians.
How safe is cycling around the world?

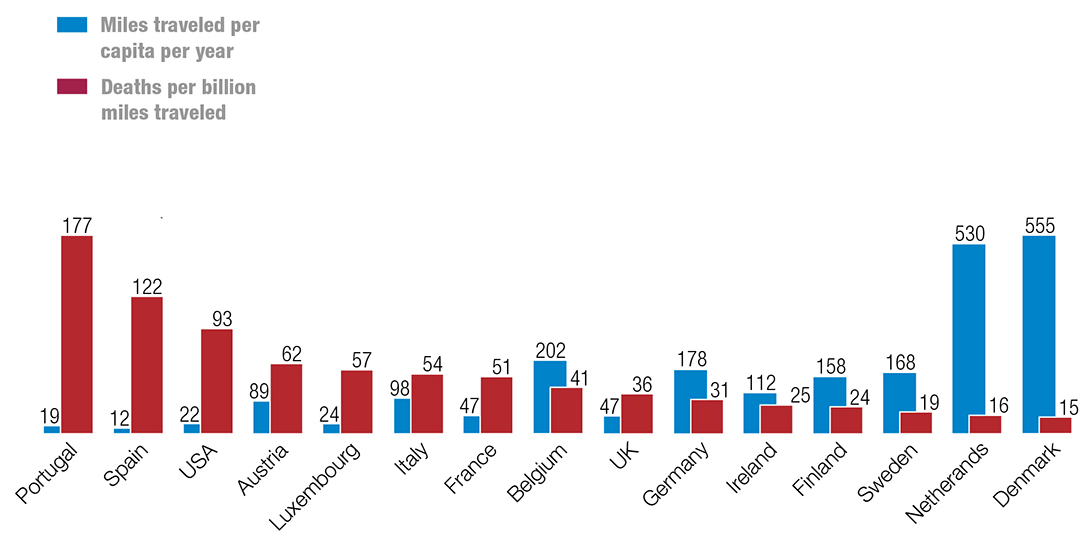
Road safety The World Health Organization’s latest data reveals that cyclists comprised 24 percent of all road deaths in the Netherlands, the fourth-highest proportion in the world. However, studies have revealed that bicycle usage is far higher in the Netherlands than almost any other country for which data is available, which helps to explain why the proportion of road deaths is so high. Further analysis has revealed that the average distance ridden per person per year is approximately inversely proportional to the number of deaths per mile of travel—in other words, the more cyclists there are on the road, the safer it is to cycle. There may be a number of causes for this, from drivers being more aware of cyclists when there are more around, to better urban planning.25
Percentage of road deaths that are cyclists
No data for countries in white
equipment: suspension
After the bicycle was invented, nobody sat comfortably for many years. The Draisine and Boneshaker put pressure on the most delicate parts and the Ordinary was little better with only its large wheel diameter to mitigate bumps. The safety bicycle frame design with sprung saddle, coupled with pneumatic tires, was a revelation. Even so, it’s no surprise that cyclists were the first to demand smooth roads, years before cars were popular. Once slick asphalt had become ubiquitous, cyclists went off-road and demanded an equally comfy ride. To supply this and make handling easier, engineers first eased vibrations with seat pillars supported on coiled springs or resilient elastomers, but the big breakthrough was when front suspension was added to forks. Rear suspension derived from motorcycles soon followed, with increasingly diverse designs to suit different off-road disciplines. Today, even commuter bikes have suspension for bumpier roads.
Comfort is of fundamental importance to cycling, literally and metaphorically. With up to about 70 percent of a rider’s load on the saddle, any technology that cushions sudden vertical acceleration forces from road bumps by storing it and then releasing it gradually is welcomed. Springs, shock absorbers, and linkages all add weight, but they provide an easier ride that reduces the toll on human energy.
Some nineteenth-century frames were designed to act like one large spring. This both reduced control and absorbed the rider’s energy through “pedal bob,” the tendency for the suspension to compress and expand with each crank rotation. A well-designed suspension system should, instead, improve a bike’s handling, braking, steering, and safety—as well as comfort. The Pedersen, designed in 1893, did exactly this, with a hammock saddle suspended between frame tubes.
More commonly, coiled metal springs were used to suspend the saddle, but this left the frame unsprung. A century later, springs were put inside telescopic front forks of mountain bikes, and new designs use compressed air in a sealed unit that can be tuned by changing the pressure, although their reliability depends on seals that remain airtight under hostile conditions.
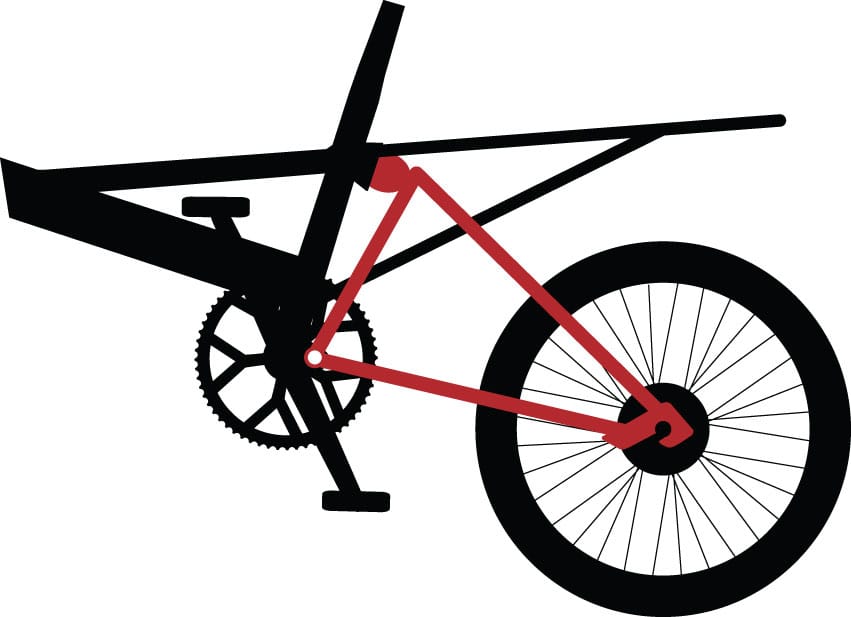
On a modern full-suspension bike, a swing arm holds the rear wheel, with a coil or air spring combined with a pneumatic or hydraulic shock absorber to dampen rebound. The pattern of pivots and linkages on these twenty-first-century designs is crucial to handling characteristics.
Becker full suspension (ca. 1890)
Front suspension is provided by a pivot at the head tube with a spring to the down tube, rear suspension by a pivot at the bottom bracket and a spring at the top of the fork to the seat tube.
Sage telescopic fork (ca. 1922)
A coil spring inside the upper part of the fork allows the blade to move up and down as the wheel crosses rough ground. The same telescoping principle is used in most suspension forks today.

Brooks B66 (1927)
Until 50 years ago the vast majority of saddles were sprung with metal coils. The rise of lighter synthetic foams and padding has displaced most but this model is still available today.
Moulton Dry Cone (1962)
Rubber-cone technology invented for the original British Mini car was applied to the rear triangle of Moulton bikes to reduce road shock from its small wheels.
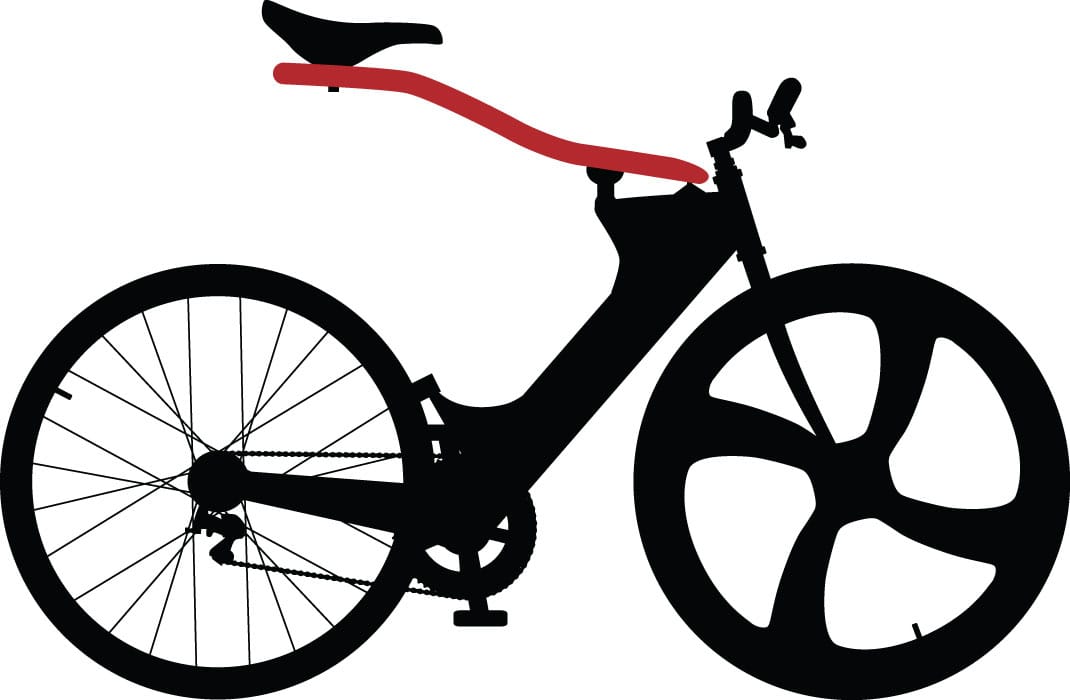
Softride (2007)
A suspended flexing beam absorbed the shocks for on-road and off-road riders alike. First sold in 1991, the design was used to win several trophies but when the UCI, the sport’s governing body, tightened its regulations, the frame with no seat tube or seat stays fell outside the rules and production ceased. Triathlons have more liberal rules so it can still be seen at some events.
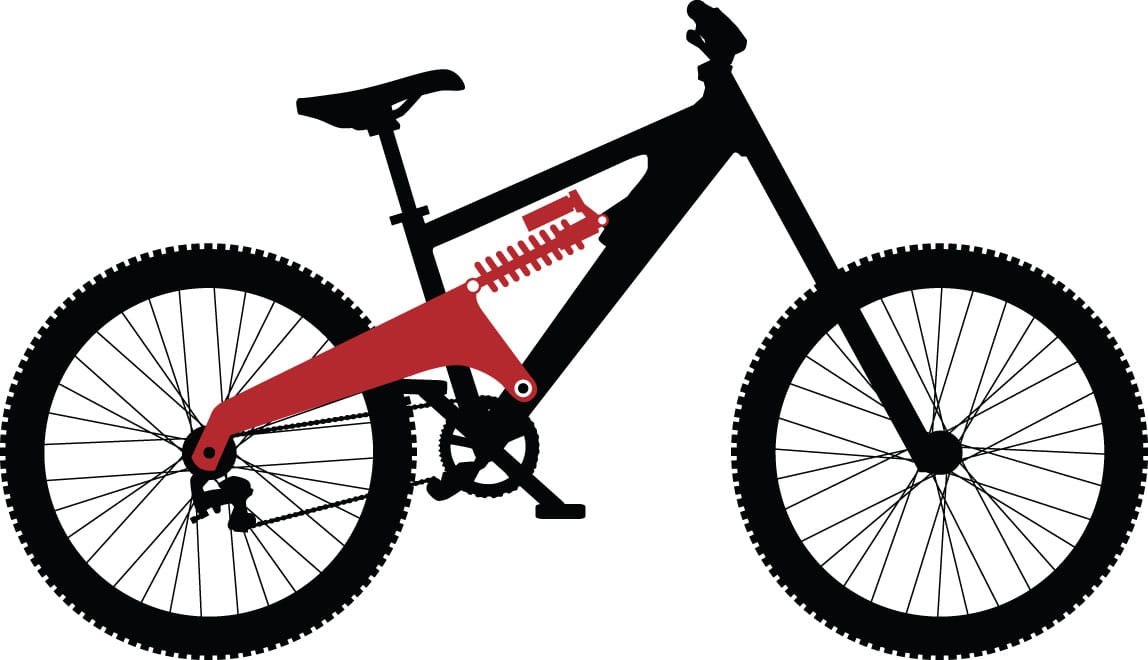
Orange 22x (2012)
Downhill mountain-bike racing has driven the need for more robust suspensions with longer travel and better control.
How much power can a cyclist generate?
How many cyclists does it take to charge a lightbulb?
The question of how many cyclists it takes to power a lightbulb is not entirely frivolous. In 2009, the lights on a Christmas tree in the main square of Copenhagen, Denmark, were lit by up to 20 pedaling volunteers on stationary bikes. In New York, gyms are adding generators to their exercise bikes, and a British theater company called Milk Presents lights its performances with tandem power.26 The bicycle is a great way to make the most of human power potential.
Work is defined by physicists as the product of a force times the distance over which it acts, and has units of energy. On a bike, work is done in an arc or circle: the cyclist pushing the pedals to turn the cranks. For such a rotating system, work is more conveniently expressed as the product of a torque—a “circular force” or “twisting force”—times the angle through which it acts. Power is the amount of work done per unit of time, and the power output of a pedaling cyclist can be calculated by multiplying the torque applied to the cranks by the angular velocity of the cranks. Power can be expressed in ft·lb/s (or, in SI units, in watts, W).
Competitors in Tour de France mountain stages maintain an average of almost 300 W of power, though outputs of close to 500 W have been recorded.27 Riders embarking on breakaways on the flatter stages generate as much as 275 W.
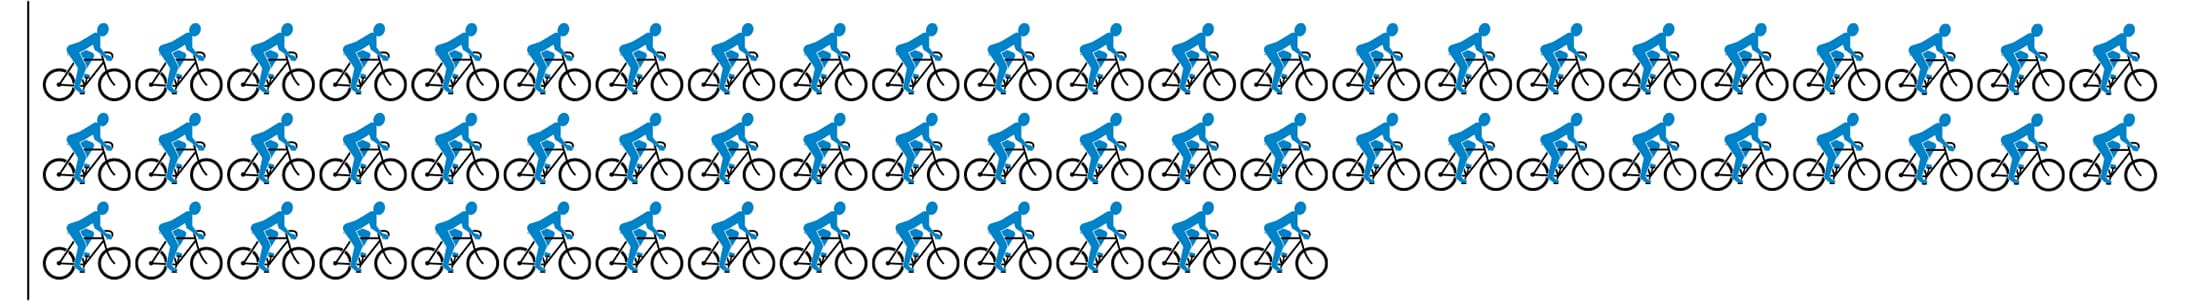
An ordinary cyclist does not approach such achievements. Most healthy adults can produce up to 70 ft·lb/s (100 W) continuously at speeds of up to 15 mph (24 km/h). Enthusiastic amateurs may reasonably expect to produce 90 to 130 ft·lb/s (125 to 175 W) for one or two hours. They could watch an ordinary television powered by their own endeavors, but would require the help of almost 50 of their neighbors if they wanted to do so in the comfort of an air-conditioned room.
Comparative power
Pedal power Using cyclists to generate power is an idea that has been around almost since cycling began. While it is possible to attach a bicycle to a generator to power an electrical appliance, the power output of a cyclist relative to the power consumption of an average household means that we would each need about 100 cyclists on constant standby to keep things running.

To light a room with energy-saving lightbulbs: 11 W (8.1 ft·lb/s)

To power an average LCD television: 130 W (96 ft·lb/s)

To keep a device on standby and power a refrigerator: 240 W (180 ft·lb/s)

To power a large plasma television: 320 W (240 ft·lb/s)
To power a clothes dryer: 3,000 W (2,210 ft·lb/s)
To power a central air conditioner: 4,850 W (3,580 ft·lb/s)
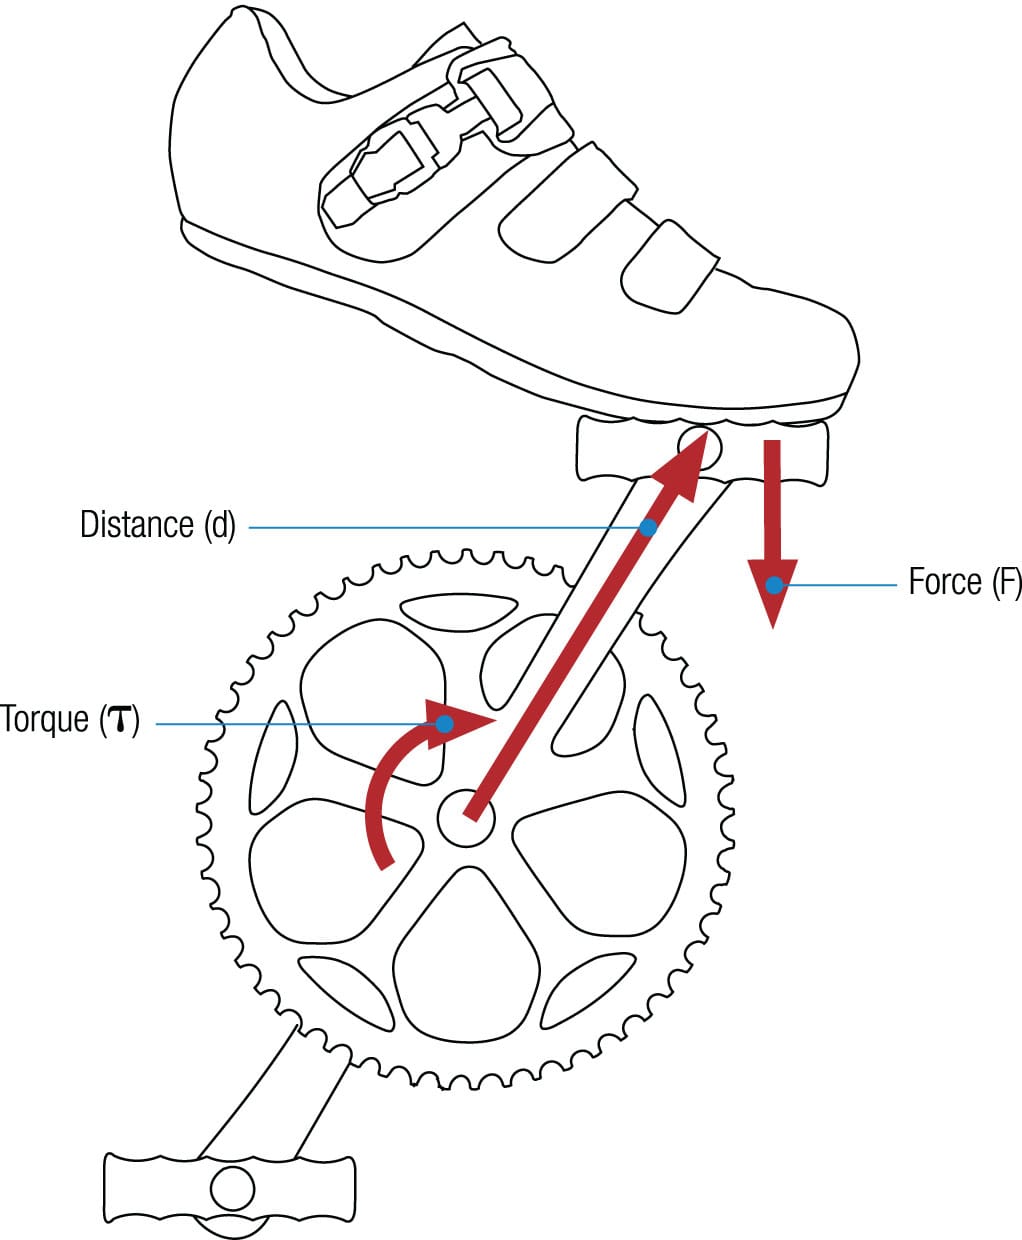
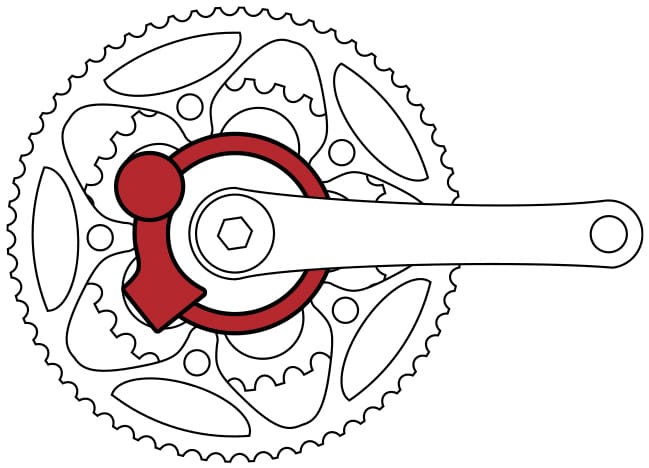
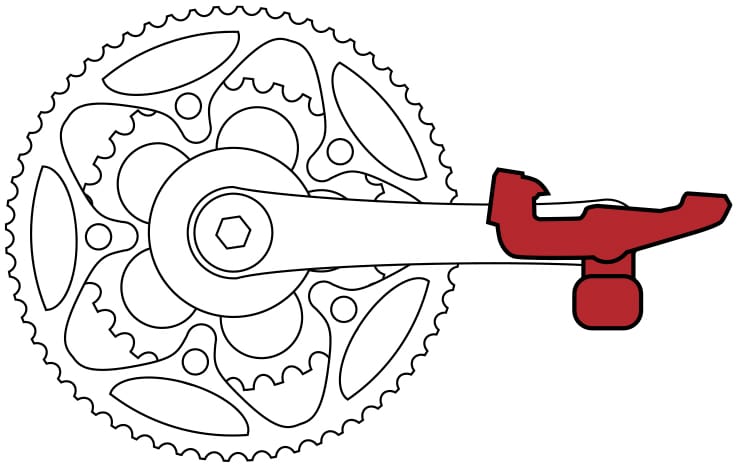
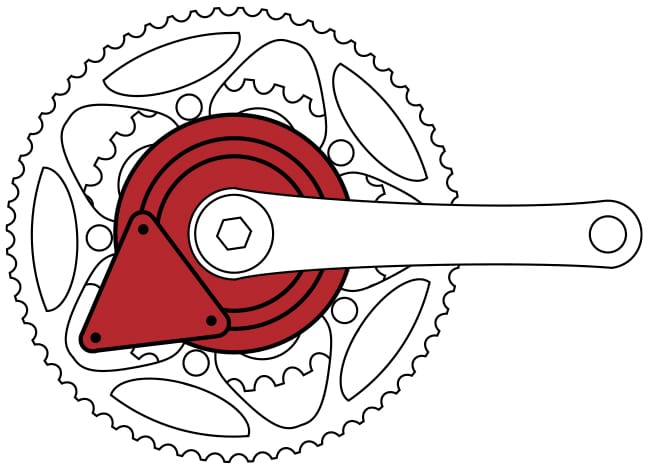
Torque talk When cranks are turned, chainrings and sprockets spin and wheels revolve. They are all experiencing torque—work done in a circle. The magnitude of the resulting force is relative to the work input and radius of the circle described.
Power and exhaustion
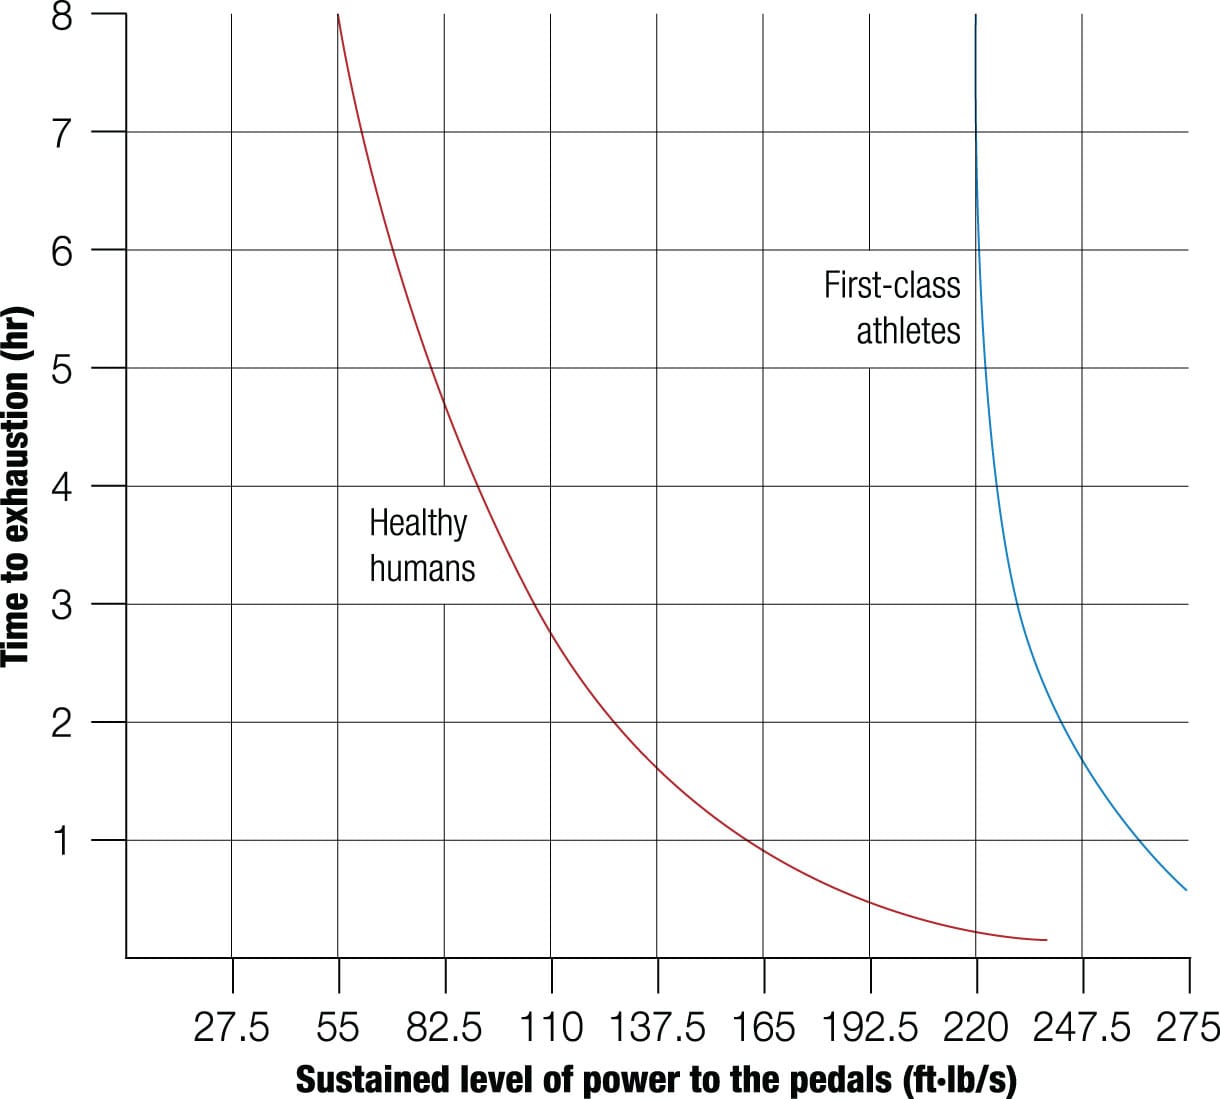
Time to exhaustion versus human power Manfred Nüscheler of Switzerland produced a massive 1,754 ft·lb/s (2,378 W) for barely five seconds, but this was in ideal conditions on a static roller bike. As this graph shows, power generation on a bike has a limited duration because of the capacity of the bike’s battery: the rider.28
How can I compute the power output?
Is the force with me?
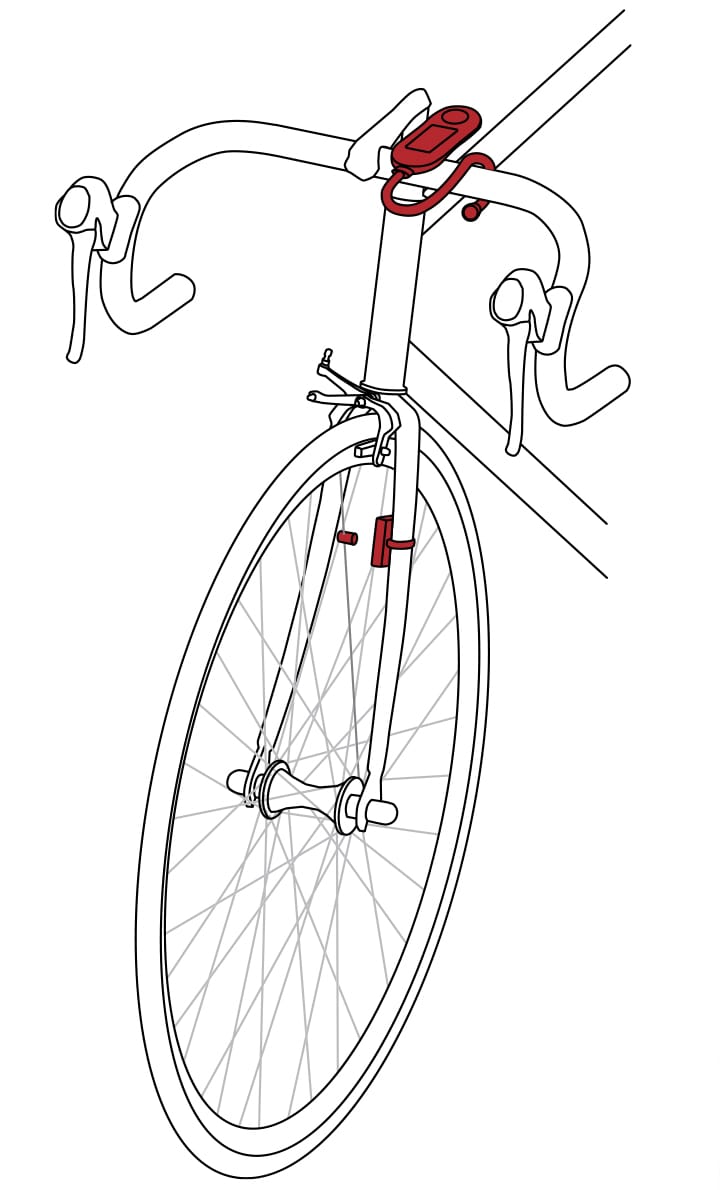
The emergence of semiconductors and digital processing has enabled the design of accessories that are small, lightweight, reasonably affordable, and able to display power data in real time. This means that power meters are accessible to anyone who is interested in measuring how much work they do on their bike. Power is of some use as an indication of fitness, but it is perhaps better as a training aid, revealing the quality of performance and the intensity of exercise. Average speed over a regular route may show general improvements over time, but extrinsic factors, such as wind and temperature, have to be taken into account. Information about power is much more, well, powerful.
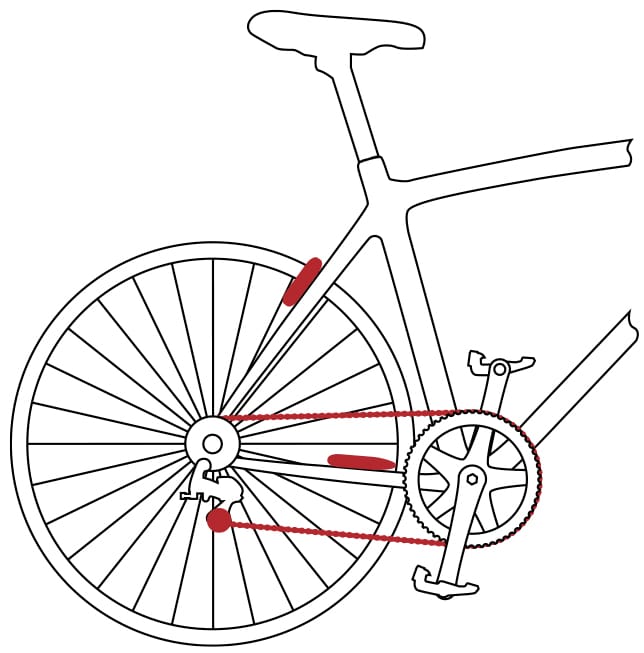
Getting the relevant data—particularly torque—out of a moving bike without putting a monkey wrench in the works is a small challenge to physicists. The power transmission train has to be intercepted and measured somewhere on its path from the rider to the road. The distortion in mechanical parts can be miniscule as the force passes through, and it could be measured at the shoe, the cleat, the pedal, the crank, the chainring/spider, the bottom bracket, the chain, the cassette, the rear hub, the rear spokes, or even the wheel rim. These options have given scope to manufacturers to develop several different proprietary systems.
Whichever location is chosen, the strain gauge is the most commonly used technology. A metallic conductor subjected to mechanical strain changes its electrical resistance by a small amount, and a strain gauge allows such a change to be detected to a high precision. For example, standing on a pedal at the bottom of its stroke distorts that crank ever so slightly, and this changes its electrical resistance. A strain gauge, calibrated under standard conditions, will read this resistance and indicate the applied force.
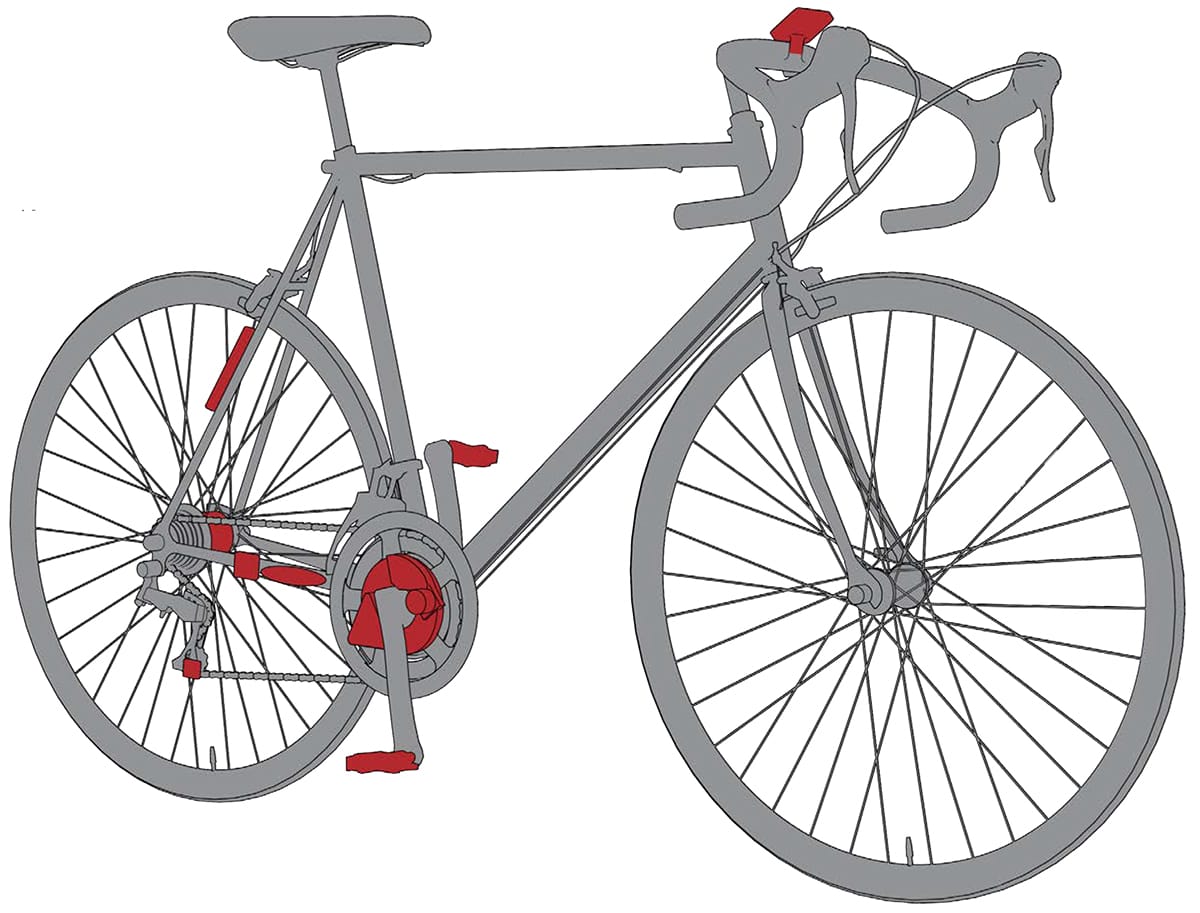
Power mad There are many places on a bicycle where instruments can be fitted to gather data used to calculate the rider’s power output. Yet each device must be robust, lightweight, and able to communicate its measurements without affecting the cyclist’s performance. Increased miniaturization is making the task easier and the equipment more affordable.
Quarq The Quarq is a gauge that sits between the crank and the chainring.
Garmin Vector & Look Keo Power Pedal gauges from Garmin and Look allow the power from each leg to be monitored.
Power2Max The well-trodden route of a strain gauge between the crank and the chainring is followed by Power2Max.
Polar Capturing data on the motion of the chain, including its vibration frequency, allows the Polar unit to calculate power.
Velocomp Instead of measuring power input, the Velocomp Newton measures the equal and opposite resisting forces, including air resistance.

PowerTap A long-time market leader is the hub-based strain gauge from PowerTap.
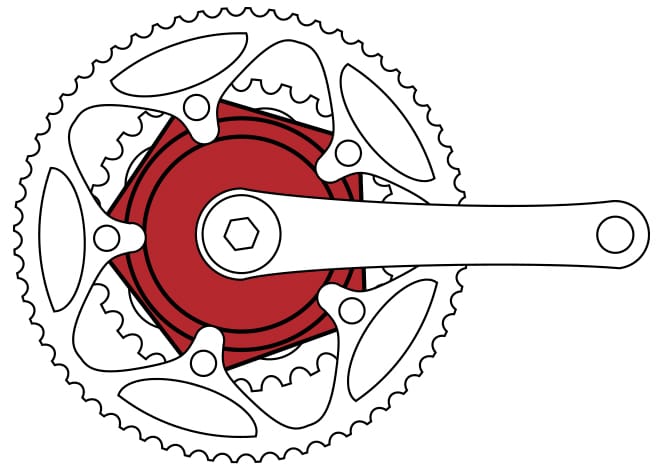
SRM The SRM model calculates torque by measuring the strain of the crank acting on the chainring.
Does a tandem have scientific advantages?
Are two heads better than one?
Tandem cycles might be considered to occupy the more light-hearted end of bicycle design, but they do offer an excellent framework for some serious cycling science. The tandem has one frame, two wheels, and two saddles, but standard two-seat tandems only weigh about 60 percent more than an equivalent solo bike. So with twice the number of riders and powerful legs turning the pedals, it makes sense that tandems are faster than solos.
Faster riding on a tandem is significantly enhanced by aerodynamics in comparison to a single cycle. According to pioneering American cycle aerodynamicist Chester R. Kyle, tandems have only half the air resistance of a pair of single cycles.29 However, at low speeds, when air resistance isn’t a factor, such as on a hill climb, their aerodynamic advantage disappears. To keep up with a solo cyclist on a hill climb, tandem riders have to be as strong and well-practiced in their technique as the solo rider.
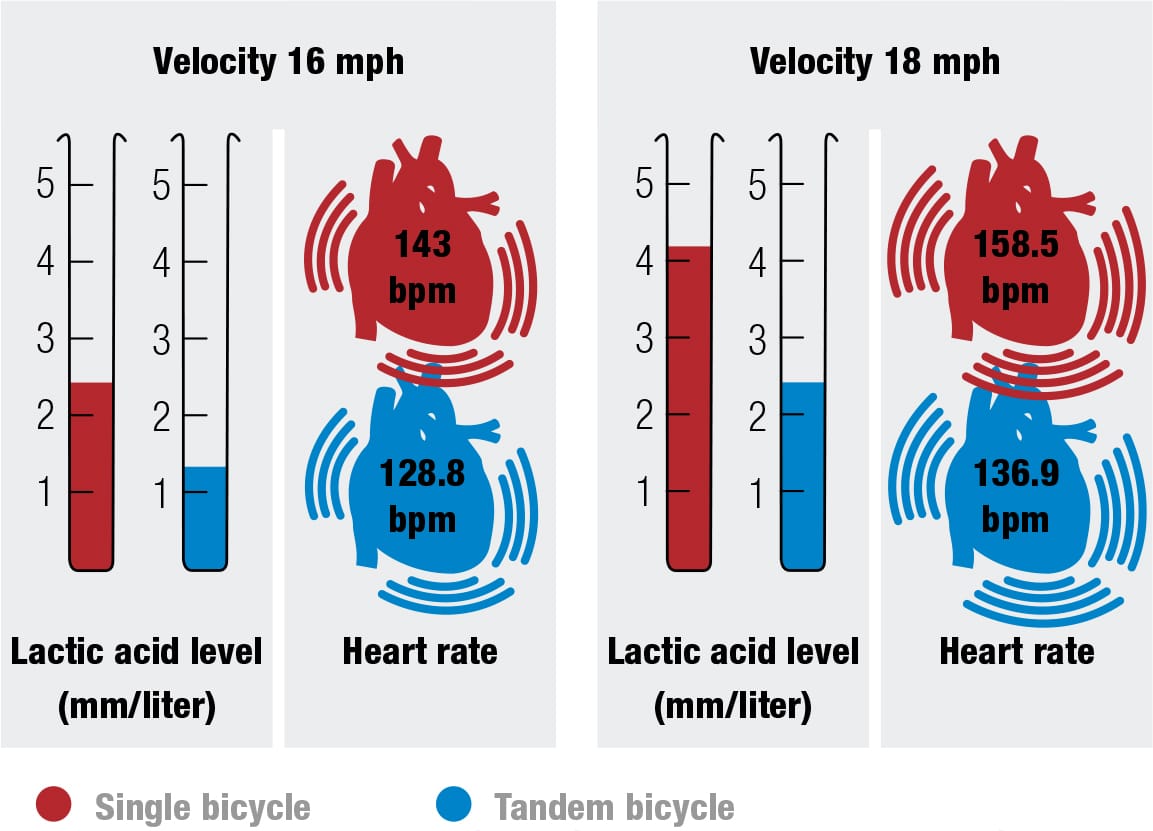
However, cycling is not always about maximum speed. Riders pace themselves to make sure they cover their target distance without burning out. In this case, the weight savings and better aerodynamics of a tandem mean that the riders don’t have to expend as much energy to produce sufficient power as they would if riding two solo bikes. Stokers, as the rear riders are known, have significantly lower physiological stress cycling on a tandem than when on a solo bicycle. Trials have showed that a stoker’s heart rate is lower by 16 to 22 percent, while the level of lactic acid in their bloodstream is lower by 23 to 70 percent.30
Researchers note that, all other things being equal, riders can ride between 3 and 5 mph (5 to 8 km/h) faster on a tandem than when riding individually. However, tandems have longer and more complex transmission systems that lose slightly more energy than a single bike—but it’s nothing compared to the friction of another kind that may arise between pilot and stoker if they do not work well together.
Tandem versus solo physiological effects
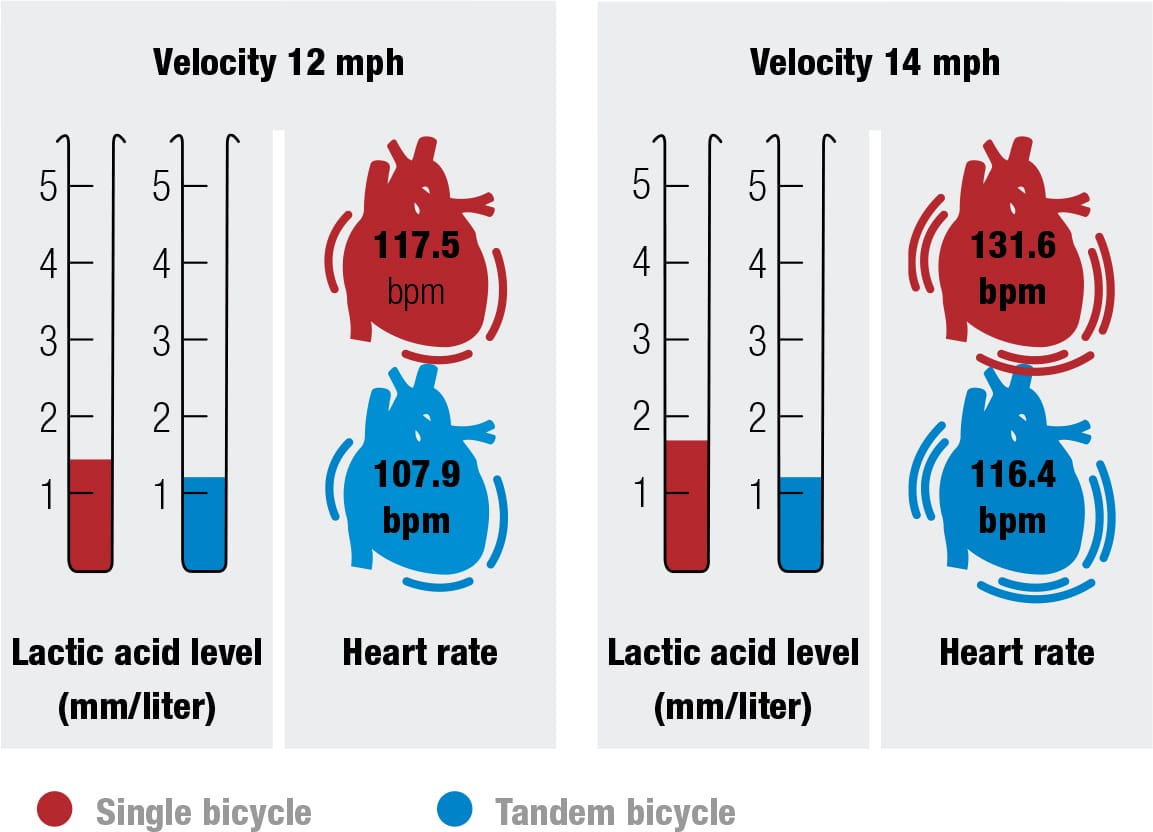
Single and tandem heart rate and lactic acid At a given speed, the rider on a tandem shows measurable signs of lower physical stress, including heart rate and bloodstream lactic acid levels. The figures are an average of the stokers’ and pilots’ results.32
Tandem versus solo power and speed
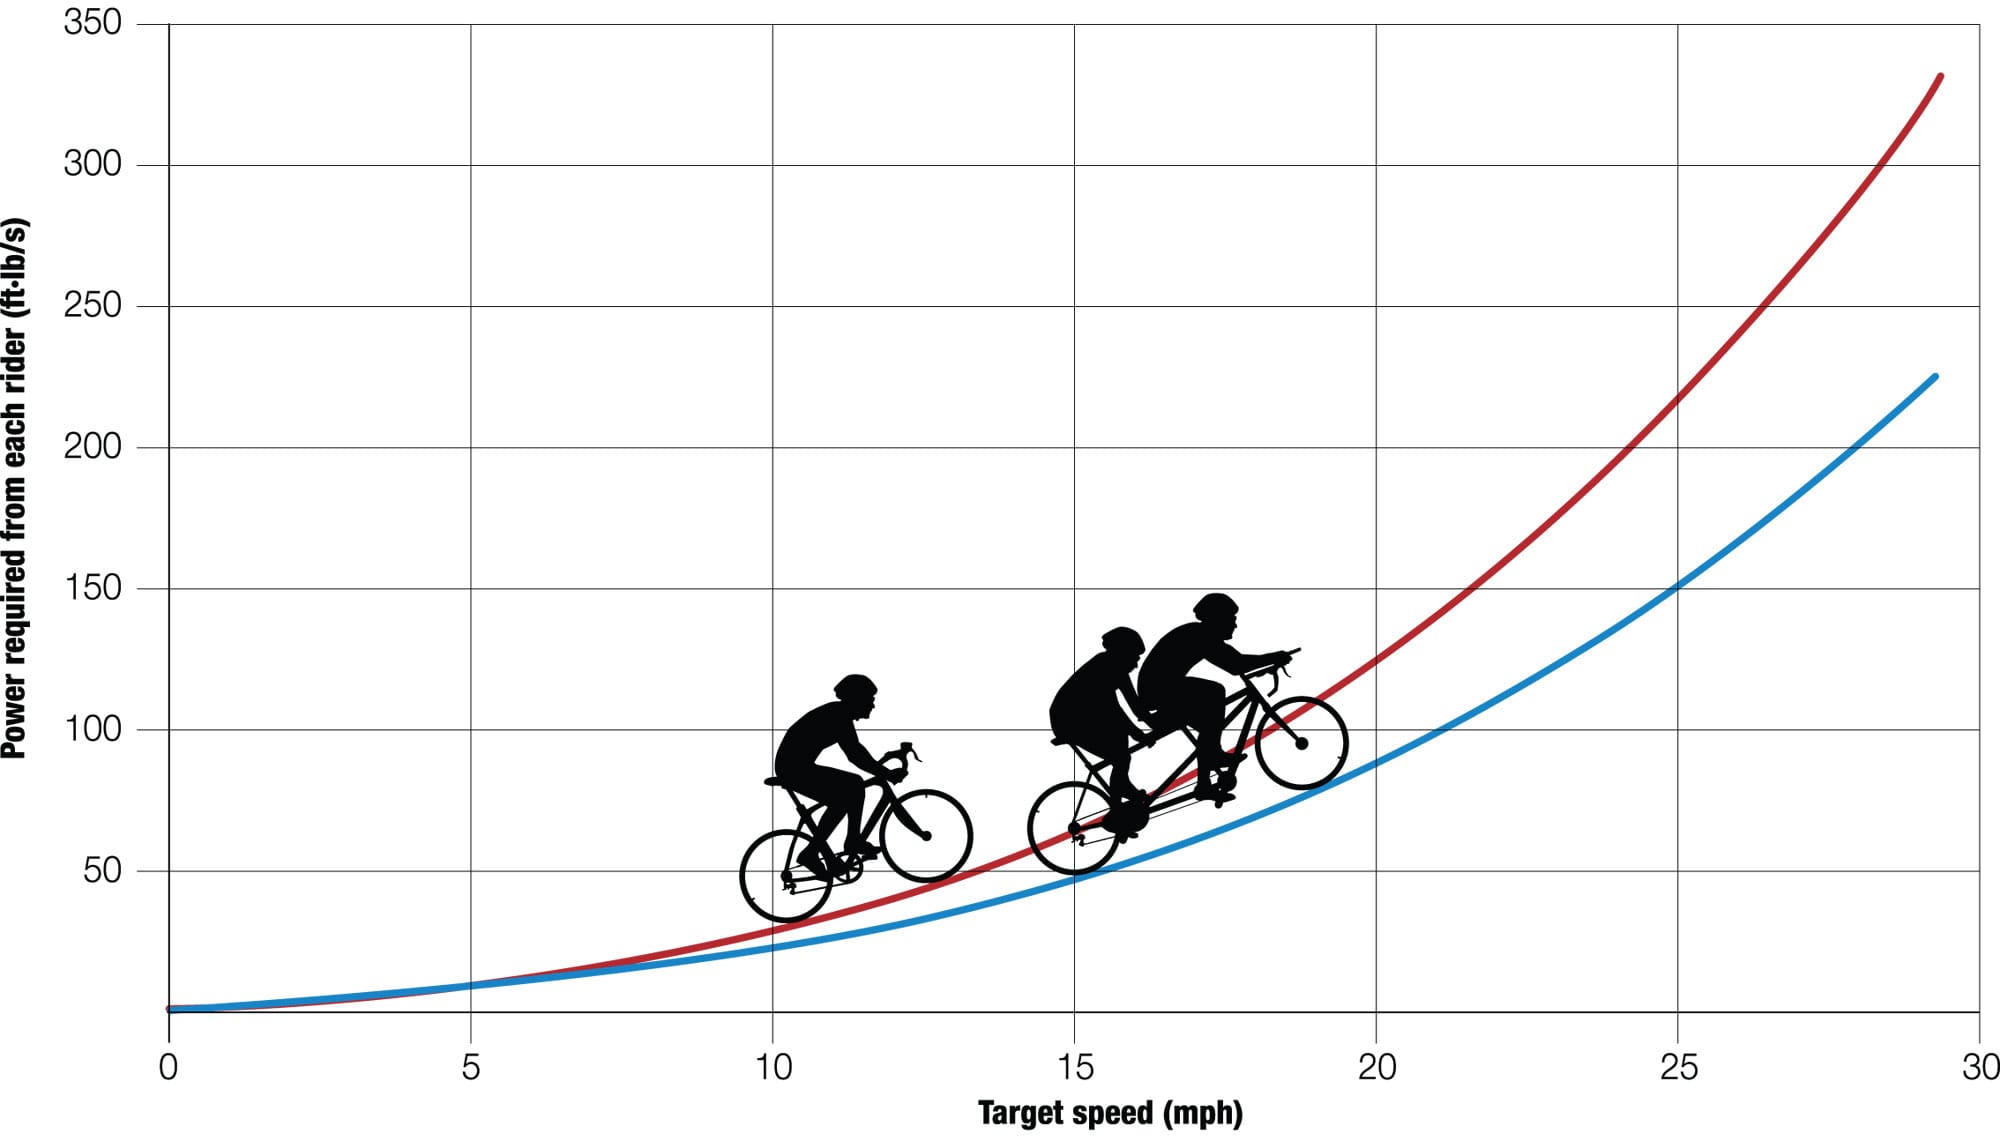
Aerodynamic benefit of a tandem A pair of identical twins, each outputting 120 ft·lb/s (160 W) on a tandem, could travel at 22.1 mph (35.5 km/h), while just one of them on a solo bike would achieve only 19.3 mph (31.1 km/h).31
Comparative weights
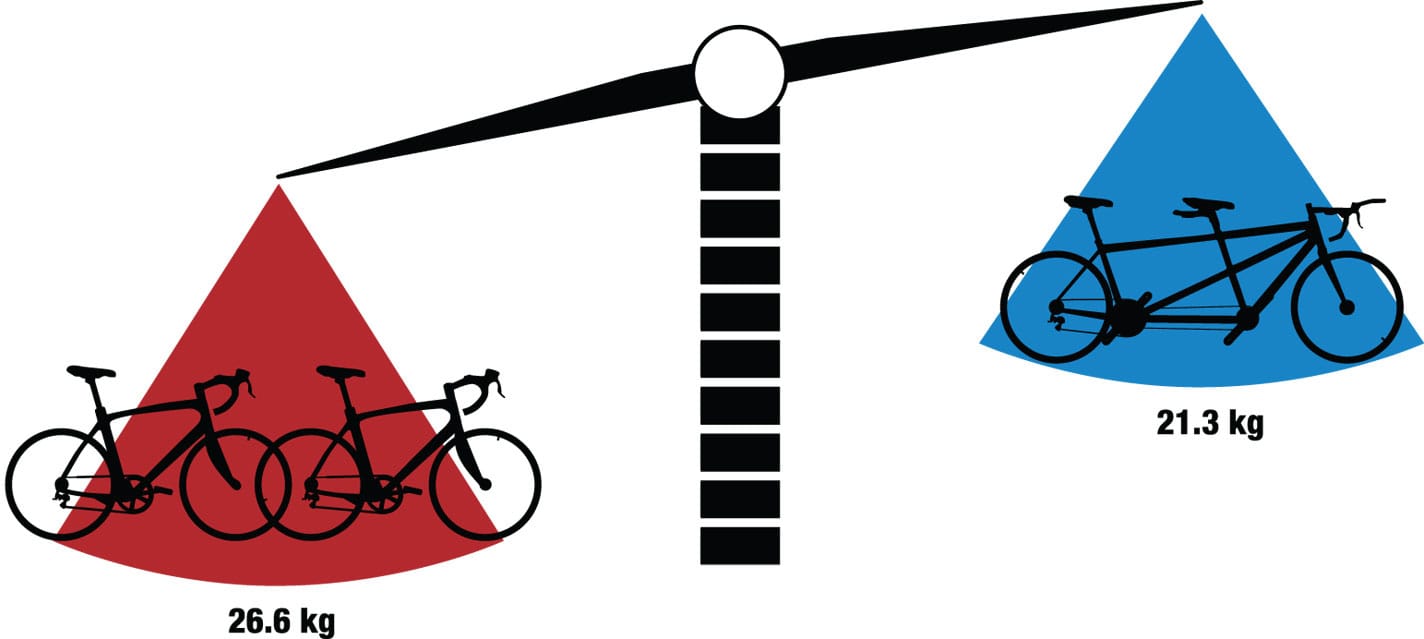
The weight advantage Two typical touring singles, at 291/4 lb (13.3 kg) each, have a mass of 591/4 lb (26.6 kg), while a typical touring tandem weighs in at 47 lb (21.3 kg), a 20 percent weight reduction.