A Very Nonmathematical Description of Statistical Significance
I originally envisioned Snowball in a Blizzard as a book that would focus on methodological aspects of human-subjects research, mainly the difficulties of study design and the subtleties of statistical interpretation. When, for instance, does a relative risk value diverge from an odds ratio, and why are the two often confused? What is a Type I versus Type II error? How do we “power” studies? A few years ago, as I was struggling with these kinds of issues in my professional work, I thought that they would be ideal subjects to illuminate to a general audience. I can see now that these fairly technical matters were unlikely to help nonspecialists have a more thorough understanding of clinical research, and it is probably why I received fairly tepid responses from literary agents.
Over time, I realized that more was to be gained by telling stories about the consequences of these issues, and that I could occasionally sprinkle the text with brief explanations of the more essential methodological points. For instance, I thought it absolutely critical to explain the concept of positive predictive value in order to show why the USPSTF does not universally recommend mammograms for women under age fifty. One can’t easily grasp the justification for the task force’s reasoning without being acquainted with the notion of positive predictive value; once one understands the concept and sees the truly lousy predictive value of a positive screening mammogram in this age group, it’s hard to understand why there was (and is) so much fuss in the first place. However, I shelved the idea of devoting entire chapters, say, to the difference between nested case-control and case-cohort studies or the beauty inherent in the Mann-Whitney U test. Such subjects, fascinating though they can be to epidemiologists, would probably be valuable to nonspecialists only as a soporific.
Thus, I elected to prioritize narration over technical explanation to describe these points, and whether I have succeeded or failed at that task, I leave for you, the reader, to judge. However, I do believe that there is one statistical concept worth exploring in a little more detail than the structure of this book allowed for because so much of what I have discussed in the previous pages relies on it: significance. I can’t speak for the basic research scientists, but for clinicians statistical significance is in many ways the yardstick by which we measure relevance in medical knowledge.
I have hinted at how we use statistical significance throughout, but what follows is a very cursory overview of the concept and an explanation of the two main types of data used in calculating significance: categorical and continuous variables. There is much more that could be described, and at a much deeper level of detail. My only goal here is to give readers a sense of what it means to hear that a study “found” something, and when skepticism may be in order. In doing so, I also want to provide readers with a way to understand news about medical breakthroughs not mentioned in this book because a moderate portion of the medical “knowledge” discussed here will be out of date by the time it hits bookstore shelves, assuming that any bookstore shelves are left by its publication date.
For those eager readers who have a deeper interest in the details of clinical research or statistics, among the many fine books devoted to the subject, I recommend Epidemiology, by Leon Gordis, as well as Naked Statistics, by Charles Whelan. The former is actually a textbook, but it is so elegantly written and has such clear examples that it can be easily understood by lay readers, while the latter is intended for a nonspecialist audience and is rollicking good fun, a rare thing to say about a book on statistics.
Statistical significance relies on the idea that some events are random and some are not. How we separate the two is through various mathematical calculations, the details of which are unimportant for this discussion, but these calculations allow us to say something to the effect of “Mathematically, what we have observed in this experiment is so unlikely that it can’t just be a matter of chance.” Statisticians have numerical measurement (known as a “p value”) for statistical significance. With those measurements, they have selected an arbitrary dividing line between randomness and pattern, a bit like an umpire’s strike zone, to allow for the process of calling the balls and the strikes of research. Different kinds of research questions call for different strike zones (i.e., there are different thresholds for statistical significance), but in general, in clinical research, the p value for significance is 0.05. What that means is that, in order for something to be considered statistically significant, for whatever observed differences are being assessed, there has to be less than one-in-twenty odds—or 5 percent, thus 0.05—that it could have happened by chance. To explore that further, let’s flip some coins.
Flipping a coin is an act with a random outcome. Barring trick flips and trick coins, when a coin is flipped it has an equal chance (or one-in-two odds) of landing heads or tails. Thus, when we consider the mathematical likelihood of flipping two consecutive heads, the odds are one in four, or 25 percent. This can be seen by looking at all the actual possibilities of flipping a coin twice:
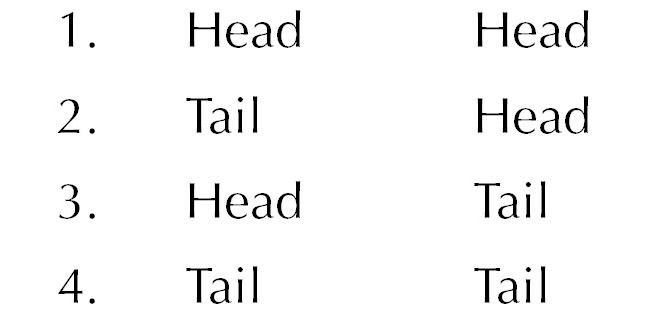
In a relative sense, an event that has one-in-four odds of happening is fairly likely: although the more likely event is a combination (either #2 or #3), if you were to repeat the “two flip” experiment many times, you would expect to see this happen with some frequency—indeed, assuming the flip of the coin is genuinely random, and if you repeated this two-flip experiment thousands of times, you would expect to see it almost precisely 25 percent of the time! Think also of parents who are planning on having kids: odds are about 50 percent that they’ll have one boy and one girl and 50 percent that they’ll have two children of the same sex, but only 25 percent that they’ll have either two girls or two boys. And that should match most people’s experiences with other friends’ siblings. The point is that a one-in-four chance of something happening is pretty common: 25 percent likely things happen all the time randomly, and we don’t think much of them.
Now flip the coin three times, and there are eight different outcomes.
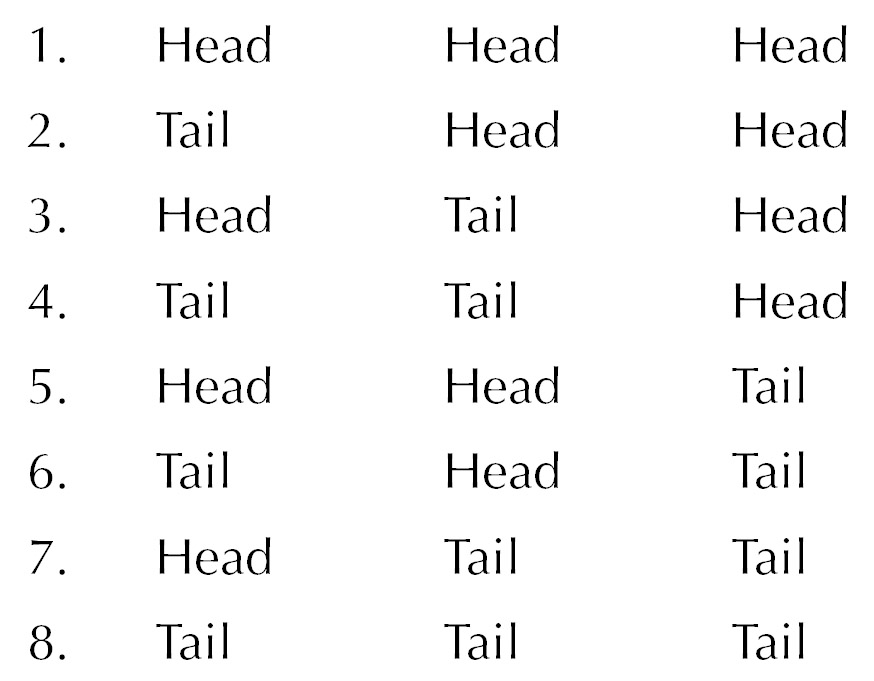
So the odds of flipping three consecutive heads (or having, say, three girls) is one in eight, or 12.5 percent. It’s less likely, but still not that uncommon. Most people know of some lovely lady bringing up three very lovely girls, or of a man with three boys of his own, or perhaps even an old-fashioned nuclear family doing the same. We’re starting to get close to the boundary of statistical significance, but we’re not quite there yet.
Flip the coin four times, and the odds of landing consecutive heads is one in sixteen, or just over 6 percent. Five consecutive heads has about a 3 percent chance (one-in-thirty-two odds) of occurring—or, to put it another way, if you flipped your coin five times in a row one hundred times over, odds are that about three of those hundred five-flip series would be all heads. In other words, that’s very unlikely: if you had someone randomly flip a coin five times, and in those five flips they got five heads, your first instinct would be that they were incredibly lucky or that it wasn’t random: either it’s a trick flip or a trick coin.
In most of the scenarios we have discussed in this book, the mathematical threshold that statisticians want to see in order to regard something so unlikely to occur by chance as to be “real” is in this kind of range. The p value for statistical significance requires an event that is a little more unlikely than flipping heads four times in a row (i.e., a 6 percent chance of happening randomly) and a little less unlikely than flipping heads five times in a row (a 3 percent chance).
So thus far you can see that a statistically significant finding means that researchers observed a difference between two groups of things, and that the observed difference is slightly more unlikely to occur randomly as a person picking up a quarter and flipping heads four times in a row. But people aren’t coins, and, besides, not every event that researchers study (like heart attacks or occurrences of cancer) has the same odds as flipping a coin. So how do statisticians ultimately arrive at a p value?
The answer is that although people and the clinical events they experience aren’t actually coins, their behavior in a statistical sense is very much like a flipped coin. And although it’s true that not every event has the same odds of happening as a flipped coin landing heads, statisticians make adjustments for this. To get at how this can happen without resorting to equations, let’s step away from flipped coins for a moment and think about randomly plucking marbles out of a jar.
Recall the story of James Lind’s scurvy experiment. Let’s re-envision his experiment as observing the differences between two jars filled with marbles. The marbles come in two colors, either blue or red. Blue marbles signify “alive and healthy,” and red marbles signify “dead or very close to it.” Now, we modern readers happen to know with hindsight that vitamin C is essential to life, so even though Lind investigated six different interventions, only one arm of the study contained any appreciable amount of vitamin C. Therefore, for this example we’ll pretend he only looked at the one variable of citrus fruit. The sailors who got the oranges and lemons were really getting vitamin C even if he didn’t know that, and everyone else was getting nothing at all.
So if Lind had started this trial before his sailors went to sea and then followed them over the course of their voyage, we would say that he was going to withdraw two marbles out of one jar (the men who got oranges and lemons) and ten marbles out of the other “just watch them” (or control) jar. Picture these jars filled with hundreds or even thousands of marbles: this would be the theoretical population in the treatment group or the control group. In performing the experiment, the researcher is basically saying, “If I gave everyone in the world this particular treatment, and the treatment succeeds, there would be more blue marbles in the treatment jar (i.e., more healthy people because of the beneficial effects of my treatment) than there would be in a control jar that contained an equal number of marbles.” The actual trial, then, is just like plucking out a sample from this much larger theoretical pool of people in order to compare results.
But what is the statistical likelihood that, for whichever jar, you will pluck out a blue versus red marble? If you don’t know that, you can’t actually know the odds of finding two blue marbles in one jar and ten red ones in the other. Let’s suppose that dying from scurvy on a long sea voyage really did carry the same risk as flipping a coin, that is, you had a one-in-two chance of dying from scurvy when you set sail. For Lind’s experiment, that would mean one would have expected equal numbers of red and blue marbles in each jar if the oranges and lemons had no effect on scurvy at all.** (In fact, although I chose the 50 percent mortality of scurvy just to make the example of picking red versus blue marbles to be a 50/50 proposition, at about the time Lind was performing his experiment, the mortality rate from scurvy on long sea voyages probably was 50 percent, and perhaps even higher. A famous episode in British naval history known as Anson’s voyage took place in the 1740s; a small squadron of ships sailed around the world with the goal of harassing the Spanish navy as part of a geopolitical chess match between the two superpowers. At the end of the four-year journey, as many as three-quarters of the original crew had died, most from disease or starvation, a significant portion of which included deaths from scurvy. Almost none of the crew died from actual warfare.)
Therefore, if you had only two people in your trial, that is, if you randomly drew only one marble from each jar, and retrieved one blue marble from the oranges and lemons (treatment) jar and one red marble from the control jar, you wouldn’t know what to conclude because it’s basically a coin flip as to whether you draw red or blue. The chances of finding one person surviving scurvy in the treatment arm and one person dying in the control arm are 25 percent—hardly convincing data. That should make it obvious enough why enrolling two patients for a drug trial isn’t a recipe for success from the standpoint of clinical study design. But how many is enough?
What if the trial had eight participants, equally split? Suppose that you randomly drew four marbles from each jar and found three of four healthy-blue marbles in the treatment jar and three of four dead-red marbles in the control jar. Without doing statistics, at first glance most readers wouldn’t find this wildly improbable, only slightly improbable. You’d say that it might hint at something but you’d need to see more marbles before you could be confident. That’s the intuitive take, and the math backs that up: the likelihood that you would see this pattern if you drew four marbles from each jar is about 15 percent, or just under one-in-seven odds. So if Lind had run a four-person-per-arm experiment today under modern standards, we would say that his results did not support a firm conclusion that citrus fruits prevent scurvy, although he might be set up for the next grant application after this promising pilot study.††
As we have said, Lind’s actual experiment involved six groups of two, but, because of what we know today, we realize that really it was one treatment group of two and a placebo group of ten. If we perform this experiment with our red and blue marbles, the math would bear out his nonmathematical conclusions about the value of oranges and lemons: the likelihood of plucking out, by pure chance, two blue marbles from the oranges and lemons jar and ten red marbles from the control jar, is about 1 in 2,000. That is statistically significant, and we would say that he proved that citrus fruits prevent or cure scurvy. And shame on him for not being a citrus fruit convert right away.
Now let’s transport ourselves two centuries forward (while staying in Great Britain) to the site of the first truly modern drug trial, where researchers evaluated streptomycin for the treatment of tuberculosis. Unlike the situation with scurvy, the risk of dying from TB in the mid-twentieth century had different odds of happening than a coin landing on heads. Or, to think about this in another way, in a TB treatment experiment, the number of blue and red marbles in the jars is not equal: the mortality rate from TB among these study subjects in 1948 was just under 30 percent. That means that if you had two 10,000-marble jars, you would expect about 3,000 red marbles in each jar, and you would adjust your mathematics of the odds of plucking a red marble from each jar accordingly.
For the streptomycin study, fifty-five patients were allocated to the treatment group, and fifty-two to the control group. Of these, four of the fifty-five “marbles” in the streptomycin jar were red (a 7 percent mortality), compared to fourteen red marbles in the control jar (a 27 percent mortality). You can see at once that this is a difference, but it is not quite as dramatic a difference as in Lind’s scurvy data. Keep in mind that 30 percent of the marbles in each jar should be red if streptomycin was not effective—that’s the null hypothesis. Through some calculations with which we won’t currently concern ourselves, the likelihood of this pattern happening by chance (i.e., of randomly plucking this particular pattern of red/blue marbles from each jar) is still very improbable: it is about 1 in 167. That’s still statistically significant, and based on that we would reject the null hypothesis and conclude, as the researchers did, that streptomycin saves lives. Streptomycin is still effective against TB today, though we use it only on rare occasion because of highly toxic side effects.
But you can see that the streptomycin trial results are less dramatic than what Lind had seen in treating scurvy. If we had recruited half the number of patients for the trial (that is, about twenty-five each) and observed the same proportions of red and blue marbles, we would not have been able to conclude confidently that streptomycin saves lives, noting that it could purely have been a matter of chance that some of the streptomycin-treated patients had improved, perhaps because some patients in the treatment arm were in a better state of health and thus more likely to recover and, therefore, less likely to die. Because the mortality rate is somewhat lower, it doesn’t take much of a difference to make a real effect disappear when sample sizes are small.
The implication for clinical research is that, to observe big effects, researchers don’t require many “marbles” (i.e., people to recruit), but, to observe small effects, large trials are required. Most medical innovations—whether medications, new surgical techniques, screening tests, or various other developments—worth studying today have weak effects. Therefore, the kind of clinical research that’s required to sort out these small effects can be a massive undertaking and can be very expensive and time-consuming. The Canadian mammography trial mentioned at the end of the chapter on mammograms took nearly three decades to complete and enrolled nearly one hundred thousand women. That’s a remarkable allocation of resources for one clinical question, and at the end of it they found no difference. The sheer size of previous mammography studies, which recruited similar numbers of women and followed them for equally long stretches, should now indicate to you the relative magnitude of mammography’s benefits even if we assume that the most optimistic estimates of their value are accurate.
Small effects can be small for more than one reason. Some interventions may be lifesaving—a saved life is a big benefit for a patient—but like mammography may require hundreds or even thousands of people to be treated before one life is saved. The statin drugs discussed midway through the book have a pretty big bang for the buck in patients with heart disease or very high cholesterol, but the patients now considered eligible for treatment by the new American Heart Association guidelines are almost certainly going to benefit less as a group.
Similarly, medications that lower blood pressure are lifesaving, and statistically significant results can be obtained with fairly small numbers of patients when the patients have very high blood pressures. However, many more patients are required to demonstrate that even a few lives are saved as the pressures get closer to “normal.” This is the rub in the new JNC8 guidelines discussed toward the beginning of the book. The entire argument about target blood pressure revolves around the problem that, as we get lower and lower pressures, people are healthier, so it is harder to observe statistically significant effects. In other words, the jars are filled with so many blue marbles that we must sample from thousands and thousands of marbles to see whether there really are fewer red marbles in the treatment jar than in the control jar. Again, we come to the boundary of what we can distinguish, no matter how hard we squint in a statistical sense.
It is also at this edge of resolution that we have to consider that people sometimes are different—in their genetics, their lifestyles, and their surroundings—and we may be pulling marbles out of the jar and making conclusions based on statistical significance that cannot be generalized to all the marbles on the planet. If we were to perform statin studies on fifty-year-olds in Botswana, we might miss the value the drug has for people living in industrialized nations because the mortality rates from HIV, tuberculosis, and malaria are so high that any lifesaving effect would be negated by premature death from something else—in other words, there are too many red marbles in the jars for this kind of a drug trial. Likewise, if we were to perform statin experiments on a similar cohort in some Scandinavian country where everyone lives to 115 and a 50-year-old is thought of as something like an adolescent, there are too many blue marbles in the jars of this experiment to see any effects. As I illustrated in the arguments about blood pressure trials, the so-called FEVER study (cited by advocates of a lower target blood pressure) was performed in China. There are many reasons to suspect that this study can’t be generalized to Americans or Europeans or anyone else. Alternately, two studies from Japan that found the opposite (no clear benefits from lowering blood pressure past a certain point) should also be considered with the same level of caution.
Other small effects may come in medications or lifestyles or procedures that don’t save lives but merely improve the quality of life. You can find many people who will swear to you about the benefits of any number of treatments for the common cold. I’m often asked in professional and personal settings about zinc and whether that “helps.” The simplest answer is, nobody knows, and that’s due to a multiplicity of reasons. To really find out, in a scientifically meaningful way, that zinc can shorten the duration of the common cold, you would have to do a trial that satisfied many criteria. First, you would have to make sure that people who have symptoms that resemble the common cold actually have a viral infection and not some other problem like seasonal allergies; otherwise, you wouldn’t know whether the fact that zinc failed to show benefit was because it was being given to the wrong population. Then you would have to enroll most patients at about the same time course of their illness because if zinc helps at all, it helps only in shortening the time people are sick, as nobody dies from the common cold. Finally you would have to figure out how you’re going to actually measure improvement with enough precision that you could be confident that your results really do show a benefit to zinc. Measuring mortality, for instance, is easy: there is generally very little confusion among researchers when a study subject dies. But trying to find a scale for sniffles or blechiness—the kind of symptoms seen with the common cold—is much harder to design and quantify. They are “fuzzy variables,” difficult to reproduce, quite subjective, and easy to manipulate, even if unintentionally.
To perform such a study with scientific exactitude, therefore, would be very expensive and probably require thousands of people. Ultimately, it would need to be funded by a group for whom cost either was not the principal concern (i.e., government) or was the overriding concern (a drug company). Because zinc cannot be patent protected, no multibillion-dollar pharmaceutical company will ever be interested in taking on a clinical zinc trial. Likewise, the NIH mercifully does not consider this a research priority, so there the matter rests, assuming nobody at the National Center for Complementary and Alternative Medicine finds the question absorbing enough to allocate funds to study it.
Do I recommend against people taking zinc for the common cold? No, not really. Do I take zinc myself when I am similarly afflicted? No, not really, unless it will mollify some well-meaning friend who feels impelled to fob said panacea upon me. Zinc for the cold is simply a question that has no answer, and, as an over-the-counter supplement, it’s basically harmless—though more on that with respect to similar treatments in a moment.
Virtually all of the elixirs found in “healthy living” aisles and nutrition stores and the like resemble zinc in that if they have any beneficial effects at all, they are sufficiently small that they either can’t be studied for reasons similar to what we’ve witnessed with zinc, or they won’t be studied because there is no profit in it for potentially interested manufacturers. There are the occasional exceptions: Saint John’s wort has been studied in the treatment of mild depression, and although the evidence supporting its effectiveness is mixed at best, at least it’s been studied. Other over-the-counter herbals that have been evaluated include saw palmetto (prostatic hypertrophy), echinacea (common cold), and ginkgo biloba (memory loss). For the most part, no benefits have been found for any of these herbals, but given the strong likelihood that whatever beneficial effects they have are not only weak but very weak, well-designed trials on these drugs are largely wanting.
The majority of herbals, however, haven’t been studied at all—and the special concoctions made by some companies as they vie for customer loyalty have combinations and home-cooked ingredients that are nearly impossible to study in any standardized way. Mostly, they’re harmless except to the pocketbook, although some of them can have either interactions with prescription drugs or come with their own dangers. In the early 2000s, for instance, a rash of deaths from the use of an herbal used for weight loss known as ma huang, or ephedra, led the Food and Drug Administration to ban its sale in the United States. That would be not so benign.
Weak effects also make it hard to know what really constitutes the healthiest diet, another topic that is covered ad nauseam, as it were, by health reporters. Based on many observational studies, it’s very clear that the combination of modest eating and frequent exercise has lifesaving benefits. What kind of food is associated with the greatest health is a much more difficult question to assess, although it never stops some commercially driven personality from hawking the latest fad diet or food. While this book has been in preparation, the açaí berry has become ever more revered by a particular slice of the American public bent on maximizing its health. The rapid rise in popularity of this fruit, which grows mainly in Brazil, is causing hardships for locals who had eaten it for subsistence but now cannot due to the commercial demands for this product, which is usually consumed by people who are in turn likely to donate to causes like the loss of traditional living in Amazonian rain forest that their own consumer habits are driving.**
The juice of the açaí is indeed lovely, but any firm claims about its healing properties are as nonsensical as those medieval totems that pilgrims traveled vast distances to touch for their curative powers. Basically, the deep belief that people have in the benefits of fruits like these, or of herbal remedies, is just a modern expression of those same inner desires. Similarly, as with the priests of old, someone is around to capitalize on this fervor to make a few bucks. At least the medieval clergy left us cathedrals; I have no idea what lasting monuments are being generated by the herbal supplement crowd.
However, medications or approaches that lead to a completely new paradigm for a disease often don’t require such large numbers of patients to be studied precisely because their effects are so dramatic. The drug Gleevec, mentioned in a footnote earlier in the book, completely changed the landscape for a fairly uncommon cancer known as chronic myelogenous leukemia, or CML. CML is a cancer that can be fairly indolent for years but ends in a deadly “blast crisis,” and treatments designed to stave off the blast crisis had only limited benefits and came with toxic side effects. Gleevec didn’t rid the body completely of the leukemia but it increased survival by several years—in some sense “curing” the disease, because CML patients are usually older anyway, so those extra years mean that CML patients pass away at around the same age as the average person. One of the famous early trials comparing Gleevec to the then-gold-standard treatment enrolled more than one thousand patients, but you didn’t need a PhD in statistics to see how superiorly Gleevec had performed: about 87 percent of patients taking Gleevec had a “major cytogenetic response,” compared to about 35 percent in the standard treatment group. One thousand patients weren’t needed to show that level of benefit. (NB: the “major cytogenetic response” is a commonly accepted indicator of treatment success, but, to be clear, the trial didn’t measure actual mortality, which is a more difficult thing to study in CML, owing to its prolonged course.)
In my own field of infectious diseases, Hepatitis C treatment has, like CML, undergone a paradigm shift in the past several years. For years, the backbone of Hep C treatment was a drug called interferon alpha, which like the existing treatment for CML was both toxic and not especially effective. (This is because the backbone of treatment for CML also was interferon alpha!) The published cure rates for Hep C using interferon-based regimens were often only 50 percent, and in the real world this almost certainly meant that all patients had a lower chance of cure. Because interferon often caused patients to be very ill, the 50 percent success rate was based on patients enrolled in studies, and these patients are typically much more motivated to complete a treatment course, side effects be damned.
Then in the late 2000s a few new drugs such as boceprevir and telaprevir came out, and suddenly the eradication of Hep C went from 50 to about 80 percent. Interferon was still required, yet real cure seemed a possibility for many more people. But the biggest change came in 2013, when the results of a trial known as COSMOS were presented at a professional meeting of hepatologists and infectious disease physicians. COSMOS involved a treatment regimen that didn’t require interferon, and although the trial did not compare these two approaches head to head, the cure rate with this new combination was about 90 percent. The study looked at only about 150 patients, and thousands won’t be required to see how profoundly our approach to this disease will be altered. By the time this book comes out, several new Hep C treatments that do not require interferon will be on the market, and most observers expect the cure rates of these to be so high that we are unlikely to know which of these combinations of drugs is the most effective, because at that point if drug X is 88 percent effective and drug Y is 92 percent effective, a trial to prove beyond doubt drug Y’s superiority would require tens of thousands of patients. So issues like cost, side effects, and raw business negotiations will determine which of these new drugs will be the most commonly used in the years to come.
Much of the research discussed in this book looks at the blue marble / red marble type of studies. Blue versus red marbles in actual statistical language are known as categorical variables—the thing being studied is either this or that, either alive or dead, either cured or not. But many studies also look at continuous variables, which are measured in gradations. When we do research that looks at continuous variables, we aren’t pulling blue and red marbles from two jars, but rather marbles that are white at one extreme, black at the other, with fifty shades of gray in between.** When we do experiments of this sort, what we’re trying to find out is whether one jar is significantly darker (or lighter) as a matter of statistics, and that the difference in shade we’re observing is not due to chance.
For instance, hypertension, diabetes, and depression are all diseases that can be studied by evaluating their severity on a continuum. Suppose we want to know that a new diabetes drug does its job and actually lowers blood sugars. For this experiment we’d have our two jars (treatment and control) filled with thousands of marbles of various gray shades; darker shades represent higher blood sugars, lighter shades represent lower blood sugars. If the drug doesn’t work (our null hypothesis), we’d expect the average shade of the marbles we pull out of the treatment jar to be more or less the same as the average shade of the marbles from the control jar. By contrast, if the drug really works, we’d expect the average shade in the treatment jar to be lighter, and so much lighter that it couldn’t have just happened by chance.
To avoid a lengthy departure into a discussion about standard deviation, standard error, and other statistical points, I won’t explain how the average shades are compared for differences. It’s easier to grasp how categorical variables are measured without doing much math beyond talking about coin flips. Suffice it to say that there are equations that enable this comparison making, and that their general outline is reasonably similar to the kinds of math required for evaluating categorical variables. To think about this in a nonmathematical way, it should be clear that if there’s a big difference in what’s being studied, fewer subjects are required to demonstrate the difference. The more subtle the difference, the more marbles must be taken from the jars.
Clinical research on the effectiveness of antidepressants of the kind mentioned in the chapter on drug trials requires analysis of continuous variables like the Hamilton Depression Scale and its ilk. To review, the Hamilton Scale looks at a variety of psychosocial factors, assigns numbers to these factors based on the severity of symptoms, and adds them up to produce a number. Drug trials evaluating antidepressants compare the scores on depression scales of patients receiving the actual drug to those of patients receiving placebos. (They can also compare pretreatment to post-treatment scores, in which patients serve as their own controls.) It’s worth recalling that, when all the published studies on antidepressants are pooled together, the drop in depression scales is modest. Like the studies that evaluated high blood pressure, the biggest benefits probably accrue to the most severe patients, where a three- or four-point swing in a depression scale might reflect the difference between being able to get out of bed or not.
The effect of prolonged antibiotics on patients with chronic fatigue syndrome, whether due to Lyme disease or anything else, is another clinical question addressed with continuous variables. In this case various “fatigue scales” are used in place of depression scales. No well-designed trial has ever found any benefit to this approach, although the chronic-Lyme ILADS enthusiasts would say that I have shown that I am a shill for the insurance industry for saying this.** Anyway, that’s how the studies would be done—and, indeed, they have been done. Chronic fatigue is awful, and most doctors feel helpless in the face of it, precisely because of the fact that we haven’t found any effective treatments thus far.
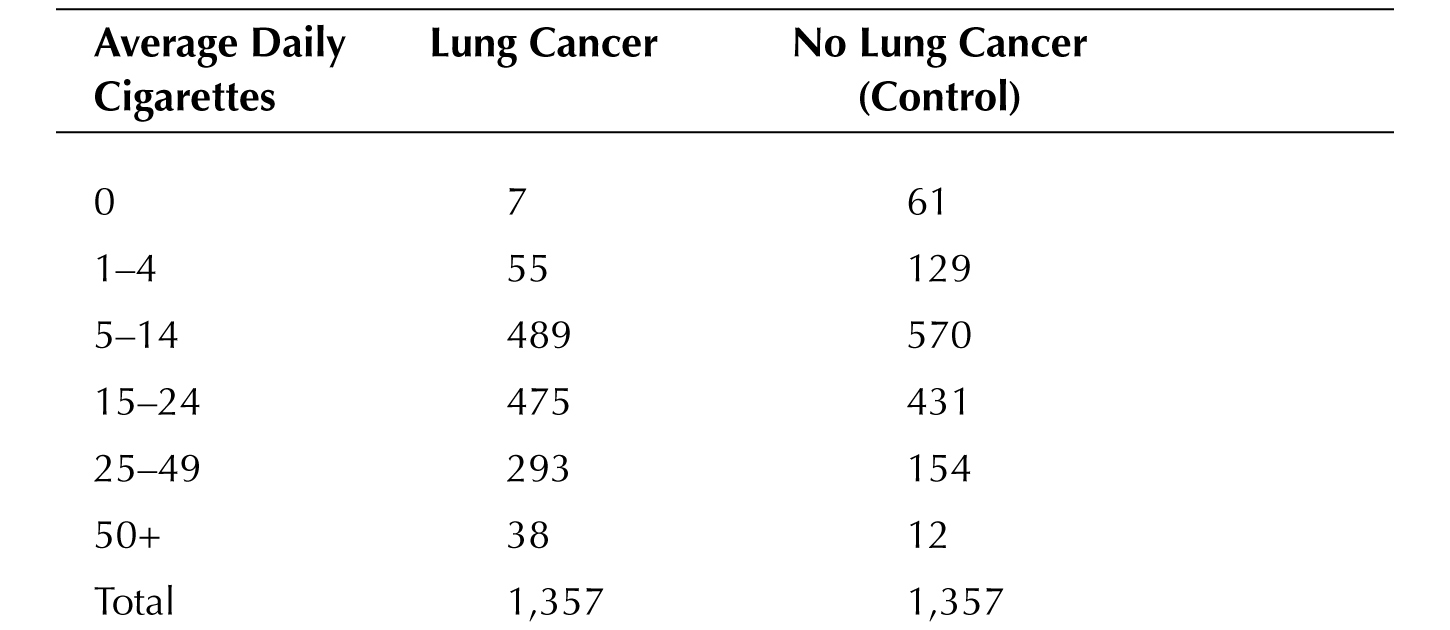
Continuous and categorical variables can be combined as well. One of the early studies on smoking was published in 1952; it looked at 1,357 men who had lung cancer and compared them to an equal group of men who didn’t. Then they pulled the marbles from the jar and looked at whether they smoked. If they had looked at smoking only as a categorical variable (i.e., black or white marbles), they would have found that smoking was associated with lung cancer: 1,350 of 1,357 men with cancer smoked, while “only” 1296 men who didn’t have cancer smoked.†† But they also looked at how much they smoked, and the results at the time must have been shocking, for smoking more cigarettes was clearly associated with cancer as seen on the next page:
In other words, the average grey shade of the marbles drawn from the cancer jar was distinctly darker than those emerging from the noncancer jar, not unlike the actual lungs these metaphorical marbles represent.
But what is the use of all this talk of marbles and coins when the headlines come streaming across one’s electronic device,‡* or when a physician is talking about guidelines for screening or treating a disease? I would say that there are a few simple takeaways. One doesn’t need to have a PhD in biostatistics to get the basic idea of how relevant or how speculative medical research can be, and whether one should alter one’s life just because of the latest journal article or new set of guidelines.
First, know the type of research being done. Clinical research—that is, experiments done involving human beings—is always more relevant than any other form of scientific inquiry when it comes to health news. As I completed the first draft of this manuscript in August 2014, I saw a CNN headline with the title “Venom May Hold Cure for Cancer.” The article described the research of a scientist working with bee, snake, and scorpion venom, and how some of the proteins extracted from those fluids appeared to halt the growth of some cancer cell lines in a culture dish.
Intriguing research? Quite possibly. Should patients who have cancer call their oncologists to inquire about experimental venom treatments? No, they shouldn’t. Do stories like this with a catchy title encourage those kinds of calls? They do, and, depending on the size of the story and the fantastical nature of the claims, those kinds of calls can occasionally grind a clinic to a halt as the physicians scramble to read about the research so as to give a knowledgeable response. Sometimes, as with this “Venom Cures Cancer” story, there isn’t any scientific study for a doctor to read about because this is preliminary research being presented at a scientific conference and hasn’t yet been published in a peer-reviewed journal.
Second, if it is clinical research, understand the kind of research that’s being done. News articles that don’t describe the basic design of the study aren’t worth reading. This book didn’t go into much detail about the different types of studies, except for emphasizing the difference between studies that identify correlations and those that directly test the effects of a variable (like a drug or vaccine trial). Studies that look at correlation should be viewed with a certain level of healthy skepticism. This is the central problem with the many epidemiologic studies that are fodder for news media: reports about fiber consumption, the link between using electronic devices and various diseases, the environmental causes of autism—these and other studies are all done largely by looking at correlations.
That’s not to imply that people should simply dismiss all studies that look at correlations: healthy skepticism is not the same thing as abject disbelief. Still, it’s worth keeping in mind the story of hormone replacement therapy, where the correlation data indicating it was beneficial was strong, but, when it was put directly to the test, hormone therapy failed. So if there is a clinical question that can be studied directly in a trial (usually, but not always, this applies to drugs), a well-designed trial is always superior.
It’s also useful to know whether investigators are studying weak or strong effects, and whether the studies looking at those effects are appropriately large or small. There’s always some study looking at the effects of, say, coffee consumption on any number of health questions, such as whether it increases the risk for heart attacks, whether consumption during pregnancy results in low birth weight, of whether it’s protective against Alzheimer’s disease. Whatever effects routine coffee consumption may have in these situations, they are likely to have a small impact, so studies that assert that something like coffee is linked with certain outcomes, yet enroll a relatively small number of people, should be regarded with caution, and are probably not worth changing your coffee habits immediately.
Finally, it’s critically important to understand the size of the benefit or harmful effect. Some clinical studies may have findings that meet statistical significance but may nevertheless not be “significant” in anything other than statistics. If a paper or a study merely says that there is some benefit, a good question to ask is, How big is the benefit? If the answer is slow in coming, or never does come, then it could very well be making mountains out of molehills.
For example, male circumcision of infants is sometimes justified in medical terms by studies indicating it may lower one’s risk of penile cancer later—much later—in life. Supposing these studies are accurate and well designed, circumcision would lower the risk of developing a cancer that, in industrialized nations, affects less than one man per 100,000. To put it differently, this research shows that circumcision lowers a man’s risk of getting penile cancer from almost nothing to half of almost nothing. There is just not very much medical benefit to be had, at least in terms of cancer prevention in nations with a high standard of living.** (I hope I am clear here—especially as a member in reasonably good standing of a culture that still practices male circumcision—that I am not opposed to the practice but am using the arguments about its medical benefits to make a point about statistical significance.)
Similarly, a recent set of guidelines has come out about screening smokers for lung cancer with CT scans. The guidelines were based on a large trial comparing smokers who got an annual scan versus those who got an annual chest X-ray. The trial showed that there was a lifesaving benefit to the scans: if you just had an annual chest X-ray, you were more likely to die of lung cancer than if you got an annual CT.
At this point, if I have done a decent job of explaining overdiagnosis, positive predictive value, and uncertainty, your sensors should be on high alert wondering just how much more likely death will befall a person who gets annual X-rays instead of CT scans. The answer, as you may not be totally surprised, is not much, although the benefits can be framed in very different ways. The CT scans resulted in a 20 percent reduction in mortality over five years’ time. Whether that sounds like a big benefit I will leave for you to judge, but not before I translate that same benefit into a different form. The 20 percent reduction means that, for every one thousand people, three extra lives will be saved during a five-year span.
That statistic, too, might prompt some wondering about the potential harms of CT scanning: Is there any downside to annual screening that might negate this fairly modest benefit? One answer we know in theory (meaning that it has not been studied extensively at a clinical level) is that CTs pack a lot of radiation. That is, CTs themselves may increase one’s risk of lung cancer, and presumably the risks are going to be higher among younger patients because the radiation has more of an opportunity to create aberrant cells that lead to cancer over decades.
There is at least one other well-understood harm from these CTs, and this, too, should sound familiar, for the chance that just one CT will result in a false positive is a staggering 25 percent. After three years, the false-positive rate is nearly 40 percent. Mind you, although a false-positive mammogram may be associated with a more intense form of anxiety, suffering, and loss than a false-positive CT suggestive of lung cancer, a breast biopsy is for the most part a procedure that does not carry significant risk of physical harm. The same cannot be said of lung biopsies no matter how they are done, and moreover their accuracy is much lower than that of breast biopsies.
Lung CT scans for smokers is a different blizzard with its own set of snowballs, but the principles of the storm remain the same, which seems an appropriate place to end.
![]()
* The idea that we wouldn’t expect to observe any difference if we assume the intervention (the oranges and lemons in this case) does not work is called the “null hypothesis.” When a difference is observed, and the observed difference is calculated to be less likely than a one-in-twenty chance, the null hypothesis is rejected.
† Joke aside, that’s actually how most modern “pilot” therapies are studied, in very small trials not geared for statistical significance, but just to see whether the researchers or clinicians are barking up a suitable tree.
* See, for instance, Adriana Brasileiro’s article, “Superfood Promoted on Oprah’s Site Robs Amazon Poor of Staple,” on the Bloomberg website, May 14, 2009, http://www.bloomberg.com/apps/news?pid=newsarchive&sid=ai8WCgSJrhmY&refer=environment. Dr
* Couldn’t resist.
* Note to insurance companies: please send money, lots of money, for my advocacy. Though, sorry for the Hep C drug costs and all.
† Keep in mind that this is a study of correlation, and that although the study found a significant correlation between smoking and lung cancer, as we discussed earlier that does not prove that smoking causes lung cancer. Indeed, the father of modern biostatistics, Sir Ronald Fisher, used the “correlation doesn’t prove causation” argument to deny the importance of smoking as a risk for lung cancer well past its expiration date, going to his grave in 1962 as a chain smoker, presumably coughing all the way.
* Or, for the hundred or so people who do not acknowledge the twenty-first century, the newspaper.
* The situation is different in less industrialized nations. Circumcision at any age in sub-Saharan Africa is extremely likely to reduce one’s risk of acquiring, and possibly passing along, HIV infection. The data on circumcision lowering the risk of penile cancer is also more robust in Africa, where penile cancer is significantly more common than in Europe or North America.