Math Diagnostic Test
20 Questions
35 Minutes
For questions in the Quantitative Comparison format (“Quantity A” and “Quantity B” given), the answer choices are always as follows:
(A) Quantity A is greater.
(B) Quantity B is greater.
(C) The two quantities are equal.
(D) The relationship cannot be determined from the information given.
For questions followed by a numeric entry box  , you are to enter your own answer in the box. For questions followed by fraction-style numeric entry boxes
  , you are to enter your answer in the form of a fraction. You are not required to reduce fractions. For example, if the answer is
  , you may enter
  or any equivalent fraction.
All numbers used are real numbers. All figures are assumed to lie in a plane unless otherwise indicated. Geometric figures are not necessarily drawn to scale. You should assume, however, that lines that appear to be straight are actually straight, points on a line are in the order shown, and all geometric objects are in the relative positions shown. Coordinate systems, such as xy-planes and number lines, as well as graphical data presentations, such as bar charts, circle graphs, and line graphs, are drawn to scale. A symbol that appears more than once in a question has the same meaning throughout the question.
| 1. | Quantity A 0.01410 |
Quantity B 0.0141 |
A certain bookstore sells only paperbacks and hardbacks. Each of the 200 paperbacks in stock sells for a price between $8 and $12, and each of the 100 hardbacks in stock sells for a price between $14 and $18.
| 2. | Quantity A The average price of the books in stock at the bookstore |
Quantity B $9.99 |
| 2 < x < 4 | ||
| 3. | Quantity A |
Quantity B |
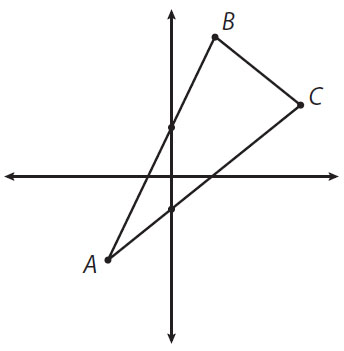
| 4. | Quantity A The slope of line segment AB |
Quantity B The slope of line segment AC |

In the figure above, the circle is inscribed in a square that has area 16.
| 5. | Quantity A The area of the shaded region |
Quantity B 1 |
a > 1
b > 5
| 6. | Quantity A (5b)a |
Quantity B (b2)a |
| 7. | Quantity A (5 + a)(3 + a) |
Quantity B a2 + 2a + 15 |
| In triangle ABC, AB = 12, AC = 10, and BC = 5. | ||
| 8. | Quantity A The measure of angle A |
Quantity B The measure of angle C |
9.If  is a positive integer, how many integer values are possible for x?
(A)5
(B)6
(C)7
(D)8
(E)10
10. If 3x + 6y = 69 and 2x – y = 11, what is the value of y?

11. If 79 + 79 + 79 + 79 + 79 + 79 + 79 = 7x, what is the value of x?
(A)9
(B)10
(C)12
(D)63
(E)97
12.In a certain election race, all of the 8,400 votes were cast for either candidate A or candidate B. If votes for candidate A and votes for candidate B were cast in a 4 to 3 ratio, how many votes were cast for candidate A?
13. What is the sum of all the integers from –457 to 459, inclusive?
14. a3b4c7 > 0. Which of the following statements must be true?
Indicate all such statements.
- ab is negative
- abc is positive
- ac is positive
Questions 15 to 17 are based on the following chart.
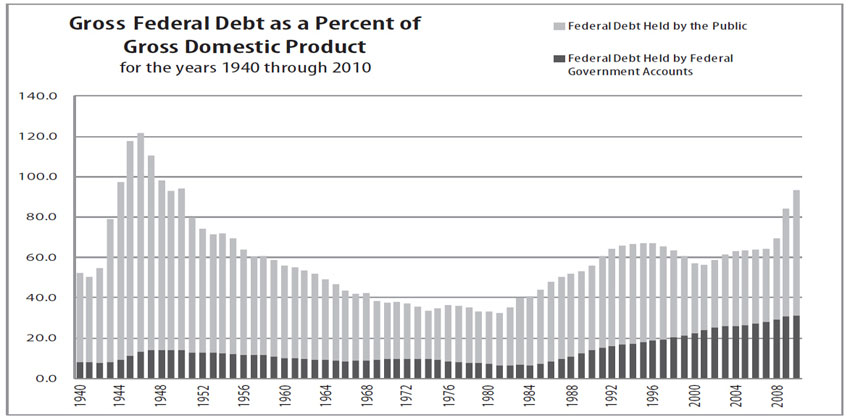
15. In how many years between 1940 and 2010, inclusive, did the gross federal debt exceed the gross domestic product?
(A)Three
(B)Four
(C)Five
(D)Six
(E)More than six
16. During which decade was federal debt held by federal government accounts closest to half of all federal debt?
(A)1960s
(B)1970s
(C)1980s
(D)1990s
(E)2000s
17. At its highest point, what was the approximate ratio of federal debt held by the public to that held by federal government accounts?
(A)1 : 1
(B)2 : 1
(C)5 : 1
(D)8 : 1
(E)12 : 1
18. A number x is 32% of a number y. If y is 20% of z, what is z in terms of x?
(A)0.064x
(B)0.64x
(C)6.4x
(D)
(E)
19. If S2 > T2, which of the following must be true?
(A)S > T
(B)S2 > T
(C)ST > 0
(D)|S| > |T|
(E)ST < 0
20. In a certain nation, every citizen is assigned an identification number consisting of the last two digits of the person’s birth year, followed by five other numerical digits. For instance, a person born in 1963 could have the identification number 6344409. How many identification numbers are possible for people born in the years 1980–1982, inclusive?
(A)360
(B)2,880
(C)288,800
(D)300,000
(E)2,400,000
Quantitative Diagnostic Test Scoring

Quantitative Diagnostic Test: Scoring Guide
| Raw Quantitative Score | Quantitative Reasoning Diagnostic Scaled Score | |
| 20 | 169–170 | |
| 19 | 167–169 | |
| 18 | 164–166 | |
| 17 | 161–163 | |
| 16 | 159–161 | |
| 15 | 157–159 | |
| 14 | 155–157 | |
| 13 | 153–155 | |
| 12 | 152–154 | |
| 11 | 150–152 | |
| 10 | 149–151 | |
| 9 | 147–149 | |
| 8 | 145–147 | |
| 7 | 143–145 | |
| 6 | 142–144 | |
| 5 | 139–141 | |
| 4 | 136–138 | |
| 3 | 133–135 | |
| 2 | 130–132 | |
| 1 | 130–131 | |
| 0 | 130 |
NOTES:
Diagnostic Scaled Score is approximate.
(a)If your time for this diagnostic section exceeded the 35-minute guideline, this approximate score may not be indicative of your performance under standard time conditions.
(b)Scaled Score depends not only on how many questions were answered correctly (Raw Score), but also on the overall difficulty of the set of questions. This diagnostic test approximates the difficulty of the official GRE® revised General Test.
Math Diagnostic Test Answers
1. (C). In a repeating decimal, the portion under the bar repeats without end. In Quantity A, the portion “1410” repeats, after an initial 0.0 that does not repeat. In Quantity B, the portion “0141” repeats, starting immediately after the decimal. To compare, write out more digits of each decimal:
| Quantity A: | 0.0141014101410 … | |
| Quantity B: | 0.0141014101410 … |
The two quantities are equal; Quantity A and Quantity B are just different ways of writing the same number.
2. (A). Because there are twice as many paperbacks as hardbacks in stock, the overall average price will be closer to the price of the paperbacks than the price of the hardbacks. However, the fact that the problem gives price ranges instead of prices complicates matters a bit. Calculate the lowest possible overall average and the highest possible overall average to see whether that average can be both lower and higher than $9.99.
To calculate the lowest possible overall average, assume the lowest price for all paperbacks and all hardbacks ($8 and $14, respectively). Note that there are twice as many paperbacks as hardbacks, which essentially double-weights the $8:
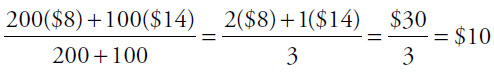
This minimum price is already greater than $9.99, so the maximum price would also be greater and there is no need to calculate it.
Quantity A is greater.
3. (D). Since 2 < x < 4, test values between 2 and 4 in both quantities to see which quantity is larger for each example. On Quantitative Comparison questions, try to prove (D), or at least test whether it’s possible.
If x = 2.5, Quantity 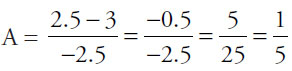 and Quantity
  . In this case, Quantity A is greater.
Before just randomly trying other values between 2 and 4, try to strategize: is there an example in which Quantity B is greater? Since the two quantities have the same denominator, focus on the numerators. x – 3 is positive when x > 3 and negative when x < 3. Since the first number tested was less than 3, next try something greater than 3.
If x = 3.5, Quantity  and Quantity
  . In this case, Quantity B is greater. (Note: you could have stopped calculating the exact values of Quantity A and Quantity B for this example once it became clear that Quantity A was negative and Quantity B was positive.)
Alternatively, it would also be strategic to think about what number, if any, could make the two quantities equal. If x = 3, Quantity A = Quantity B = 0, because both numerators will be 0, and 0 divided by any non-zero number is just 0.
Since Quantity A is greater than Quantity B for some values of x between 2 and 4, but Quantity B is greater than Quantity A for other values of x between 2 and 4, the relationship cannot be determined from the information given.
4. (A). While there are no numbers on the graph, both lines have positive slopes (the lines rise upward when reading from left to right) and segment AB is steeper than segment AC. Thus, segment AB has a greater slope.
While you should be cautious about making assumptions on the GRE, the fact that the two lines form two sides of a triangle and meet at vertex A shows that the lines are not parallel, and segment AB, which rises above segment AC to the right of their meeting point, is definitely steeper.
5. (B). If the area of the square is 16, then the side of the square is 4. Since the circle is inscribed in the square, its diameter is 4 and its radius is 2. Since the area of a circle is πr2, the area of this circle is 4π. Thus, the combined area of the four “corners,” outside the circle but inside the square, is 16 – 4π. The shaded region is one of these four identical “corners,” so the area of the shaded region is  = 4 – π ≈ 4 – 3.14 = 0.86, which is less than 1.
Quantity B is greater.
6. (B). Since both quantities have the same exponent as well as at least one b inside the parentheses, one way to compare the quantities is to distribute that exponent:
| Quantity A: | (5b)a = 5aba | |
| Quantity B: | (b2)a = (b × b)a = baba |
Because ba is positive (i.e., a positive base to a positive power) and common to both quantities, it can be ignored or canceled from both:
| Quantity A: | 5a | |
| Quantity B: | ba |
Because the positive exponent is common to both quantities, a larger positive base indicates the greater quantity. Because b > 5, Quantity B is greater.
7. (D). FOIL the terms in Quantity A:
(5 + a)(3 + a) = 15 + 5a + 3a + a2 = a2 + 8a + 15
Since a2 and 15 appear in both quantities, eliminate them:
| Quantity A: | 8a |
| Quantity B: | 2a |
If a is positive, Quantity A is greater. If a is negative, Quantity B is greater. If a is zero, the two quantities are equal. Without information about a, the relationship cannot be determined from the information given.
(Note also, because neither quantity is set equal to zero or any other number, it is impossible to actually “solve” either quantity to get roots or solutions for a.)
8. (B). Begin by drawing the triangle described by the text and labeling the sides:

According to the properties of triangles, the longer the side opposite an angle, the larger the angle itself must be. Since angle A opens to the shortest side, length 5, but angle C opens to the longest side, length 12, it must be true that angle C is greater than angle A. Thus, Quantity B is greater.
9. (B). If  is a positive integer, then x is a positive factor of 52 (i.e., x divides evenly into 52). This question can most easily be solved by listing positive factor pairs for 52, as listing in pairs will help prevent omissions. Each pair multiplies to 52.
The factors of 52 are:
1 & 52
2 & 26
4 & 13
Check to make sure this list is complete. Looking down the left column, 1 and 2 made the list, then 3 didn’t divide evenly into 52, then 4 did. Since 4 pairs with 13, check the other integers between 4 and 13. Since 5, 6, 7, 8, 9, 10, 11, and 12 don’t divide evenly into 52, this list is complete. There are 6 factors, so the answer is (B).
10. 7. Multiply each term of the second equation by 6: 12x – 6y = 66. Why do this? Because the first equation has a 6y, and the y terms will now cancel when the equations are added:

Plug x = 9 back into an original equation to get y:
| 2x – y | = | 11 |
| 2(9) – y | = | 11 |
| 18 – 11 | = | y |
| y | = | 7 |
In summary, x = 9 and y = 7. Be sure to use the value of y to select your answer, and not the value of x.
11. (B). Factor 79 out of 79 + 79 + 79 + 79 + 79 + 79 + 79 to get:
79 (1 + 1 + 1 + 1 + 1 + 1 + 1) = 79 (7)
Or, just count that there are seven 79’s in the original sum, which can be written as 7 × 79.
Since 79 (7) is the same as 79 (71), simplify further: 79 (71) = 7(9 + 1) = 710. Thus, x = 10.
Note: it is not correct to simply add the original exponents together. When adding or subtracting exponential expressions with the same base, it is not possible to directly combine exponents. Factoring out is the correct procedure.
12. 4,800. If votes for candidate A and votes for candidate B were in a 4 to 3 ratio, then for every 4 votes candidate A got, candidate B got 3. You can think of these votes as existing in “sets” of 7 votes.
Divide 8,400 by 7 to get 1,200. Thus, the votes were cast in 1,200 “sets” of 7. In each “set,” the votes went A A A A B B B (4 votes for A, 3 for B). Thus, the total number of votes for A is 1,200 × 4 = 4,800.
13. 917. There must be a trick to this, as it would be impossible to sum so many numbers under GRE time constraints, even with a calculator. To see the trick, try an example with much smaller numbers. For instance, what is the sum of all the integers from –2 to 4, inclusive?
New example: 
That is, –2 and 2 cancel, –1 and 1 cancel, and 0 has no impact on the sum. So the sum is just the leftover numbers at the end, 3 + 4 = 7.
Similarly, in the set –457, –456 … 0 … 456, 457, 458, 459, all the integers from –457 to 457 cancel each other out. Only 458 and 459 remain. The sum is 458 + 459 = 917.
14. “ac is positive” only. Since b4 must be positive, if a3b4c7 is positive, a3c7 must also be positive. Since putting an odd exponent on a number doesn’t change whether the number is positive or negative, ac must be positive, so the third statement is true. The other statements require knowledge of the sign of b, which is not known here, since the even exponent “hides” whether the underlying base is positive or negative.
15. (A). The chart expresses gross federal debt as a percent of gross domestic product, so federal debt exceeded gross domestic product in any year in which the value of the graph rose above 100. Only during three years in the 1940s does the graph extend above 100.
16. (E). Federal debt held by federal government accounts would be half of all federal debt in any year in which the dark, bottom portion of the bar equaled the lighter, top portion. Although it never actually reached 50% of the total federal debt, the dark portion of the bar came closest to equaling the light portion during the 2000s.
17. (D). The ratio of federal debt held by the public to that held by federal government accounts for any given year would be the measure of the lighter, top bar over the measure of the darker, bottom bar for that year. (To get the measure of the lighter, top bar, you must subtract the value of the darker, bottom bar.)
While the federal government accounts percent hovered near the low teens throughout most of the graph, debt held by the public rose above 100% during portions of the 1940s. Identify the year in which the lighter, top bar is the largest in comparison to the darker, lower portion. In this chart, it happens to be the tallest bar overall, which was 1946, although it’s not necessary to identify the exact year:
Total bar: 120 (actually a bit more)
Dark, bottom bar: 15 (or a bit less)
Light, top bar: 120 (or more) – 15 (or less) = 105 (or a bit more)
The ratio is thus 105 (slightly more) : 15 (maybe less), which is 7 : 1 (or a bit higher). Among the given options, this ratio is closest to 8 : 1.
18. (D). Translate the percent relations in the problem into algebraic statements. First, “a number x is 32% of a number y” becomes:
x = 0.32y
Similarly, “y is 20% of z” becomes:
y = 0.2z
Substituting for y from the second equation into the first eliminates y and gives the following relationship between x and z:
x = 0.32(0.2z)
x = 0.064z
Finally, the problem asks for z in terms of x, so isolate the variable z by dividing both sides of the equation by 0.064:

19. (D). The square root of a squared variable is equal to the absolute value of that variable:  , not x. So, taking the square root of both sides of this inequality results in |S| > |T|. Answer choice (A) does not have to be true because S could be negative while T is positive. For example, if S = –5 and T = 4, then S2 > T2. Testing fractions in answer choice (B) shows that it does not have to be true. If S2 =
  and T2 =
  , then T =
  or –. is greater than , which means that T can be greater than S2. Answer choice (C) does not have to be true because S and T could have opposite signs. Answer choice (E) does not have to be true because S and T could have the same sign.
20. (D). This is a combinatorics problem in which order matters (as it always does with passcodes, ID codes, etc.). Since the identification numbers each have 7 digits, draw 7 slots. In each slot, list the number of possibilities for that slot.
Since the question asks only about identification numbers for people born in 1980, 1981, and 1982, the identification numbers must begin with 80, 81, or 82. Thus, only 8 (1 option) can go in the first slot. Only 0, 1, or 2 (3 options) can go in the second slot:

Note that there is no rule against repeating a number in an identification number (the problem gives the example “a person born in 1963 could have the code 6344409”), so each remaining slot can each contain any of the digits 0–9 (10 options):

This fundamental counting principle states that the total number of choices is equal to the product of the independent choices. To calculate the answer, multiply 1 × 3 × 10 × 10 × 10 × 10 × 10 = 300,000.
Alternatively, note that for each birth year, the part of the identification number unique to the individual is a 5-digit number. These could be 00000–99999 (99,999 + 1 = 100,000 options). There are 100,000 possible numbers for each of 3 years, or 300,000 identification numbers possible.