Chapter 8
Inequalities, Graphing, and Absolute Value
Chapter Check-In
 Inequalities and their properties
Solving and graphing inequalities
Absolute value
Solving absolute value equations
Solving inequalities containing absolute values
Having reviewed solving equations and working with monomials, you are now ready to work with inequalities.
Inequalities
An inequality is a statement in which the relationships are not equal. Instead of using an equal sign (=) as in an equation, these symbols are used: > (is greater than) and < (is less than) or ≥ (is greater than or equal to) and ≤ (is less than or equal to).
Axioms and properties of inequalities
For all real numbers a, b, and c, the following are some basic rules for using the inequality signs.
• Trichotomy axiom: a > b, a = b, or a < b.
These are the only possible relationships between two numbers. Either the first number is greater than the second, the numbers are equal, or the first number is less than the second.
• Transitive axiom: If a > b, and b > c, then a > c.
Therefore, if 3 > 2 and 2 > 1, then 3 > 1.
If a < b and b < c, then a < c.
Therefore, if 4 < 5 and 5 < 6, then 4 < 6.
• Addition property:
If a > b, then a + c > b + c.
If a > b, then a – c > b – c.
If a < b, then a + c < b + c.
If a < b, then a – c < b – c.
Adding or subtracting the same amount from each side of an inequality keeps the direction of the inequality the same.
Example: If 3 > 2, then 3 + 1 > 2 + 1 (4 > 3)
If 12 < 15, then 12 – 4 < 15 – 4 (8 < 11)
• Positive multiplication and division property:
If a > b, and c > 0, then ac > bc.
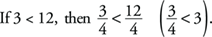
If a < b, and c > 0, then ac < bc.
If a > b, and c > 0, then  .
.
If a < b, and c > 0, then  .
.
Multiplying or dividing each side of an inequality by a positive number keeps the direction of the inequality the same.
Example: If 5 > 2, then 5(3) > 2(3), therefore, 15 > 6.
• Negative multiplication and division property:
If a > b, and c < 0, then ac < bc.
If a < b, and c < 0, then ac > bc.
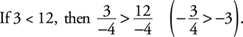
If a > b, and c < 0, then  .
.
If a < b, and c < 0, then  .
.
Multiplying or dividing each side of an inequality by a negative number reverses the direction of the inequality.
Example: If 5 > 2, then 5(– 3) < 2(– 3); therefore, – 15 < – 6.
Solving inequalities
When working with inequalities, treat them exactly like equations (except, if you multiply or divide each side of the inequality by a negative number, you must reverse the direction of the inequality).
Example 1: Solve for x: 2x + 4 > 6.
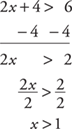
Answers are sometimes written in set builder notation {x: x > 1}, which is read “the set of all x such that x is greater than 1.”
Example 2: Solve for x: –7x > 14.
Divide by –7 and reverse the direction of the inequality.

Example 3: Solve for x: 3x + 2 ≥ 5x – 10.
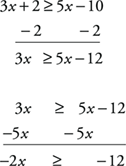

Notice that opposite operations are used. Divide each side of the inequality by –2 and reverse the direction of the inequality.
In set builder notation, {x: x ≤ 6}.
Graphing on a Number Line
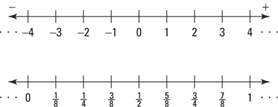
Integers and real numbers can be represented on a number line. The point on this line associated with each number is called the graph of the number. Notice that number lines are spaced equally, or proportionately (see Figure 8–1).
Figure 8–1 Number lines.
Graphing inequalities
When graphing inequalities involving only integers, dots are used.
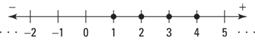
Example 4: Graph the set of x such that 1 ≤ x ≤ 4 and x is an integer (see Figure 8–2).
{x:1 ≤ x ≤ 4, x is an integer}
Figure 8–2 A graph of {x:1 ≤ x ≤ 4, x is an integer}.
When graphing inequalities involving real numbers, lines, rays, and dots are used. A dot is used if the number is included. A hollow dot is used if the number is not included.
Example 5: Graph as indicated (see Figure 8–3).
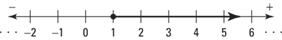
(a) Graph the set of x such that x ≥ 1.
{x: x ≥ 1}
Figure 8–3 A graph of {x: x ≥ 1}.
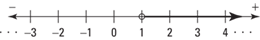
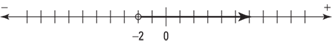
(b) Graph the set of x such that x > 1 (see Figure 8–4).
{x: x > 1}
Figure 8–4 A graph of {x: x > 1}
(c) Graph the set of x such that x < 4 (see Figure 8–5).
{x: x < 4}
Figure 8–5 A graph of {x: x < 4}
This ray is often called an open ray or a half line. The hollow dot distinguishes an open ray from a ray.
Intervals
An interval consists of all the numbers that lie within two certain boundaries. If the two boundaries, or fixed numbers, are included, then the interval is called a closed interval. If the fixed numbers are not included, then the interval is called an open interval.
Example 6: Graph.
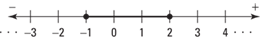
(a) Closed interval (see Figure 8–6).
{x: –1 ≤ x ≤ 2}
Figure 8–6 A graph showing closed interval {x: –1 ≤ x ≤ 2}.
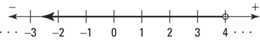
(b) Open interval (see Figure 8–7).
{x: –2 < x < 2}
Figure 8–7 A graph showing open interval {x: –2 < x < 2}.
If the interval includes only one of the boundaries, then it is called a half-open interval.
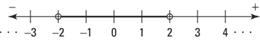
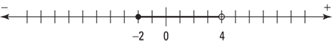
Example 7: Graph the half-open interval (see Figure 8–8).
{x: –1 < x ≤ 2}
Figure 8–8 A graph showing half-open interval {x: –1 < x ≤ 2}.
Absolute Value
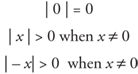
The numerical value when direction or sign is not considered is called the absolute value. The absolute value of x is written |x|. The absolute value of a number is always positive except when the number is 0.
Example 8: Give the value.
(a) |4| = 4
(b) |–6| = 6
(c) |7 – 9| = |–2| = 2
(d) 3 – |–6| = 3 – 6 = –3
Note that absolute value is taken first, or work is first done within the absolute value signs.
Solving equations containing absolute value
To solve an equation containing absolute value, isolate the absolute value on one side of the equation. Then set its contents equal to both the positive and negative value of the number on the other side of the equation and solve both equations.
Example 9. Solve | x | + 2 = 5.
Isolate the absolute value.

Set the contents of the absolute value portion equal to +3 and –3.
x = 3 or x = –3
Answer: 3, –3
Example 10: Solve 3|x – 1| – 1 = 11.
Isolate the absolute value.
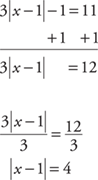
Set the contents of the absolute value portion equal to +4 and –4.
Solving for x,
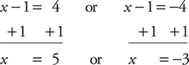
Answer: 5, –3
Solving inequalities containing absolute value and graphing
To solve an inequality containing absolute value, begin with the same steps as for solving equations with absolute value. When creating the comparisons to both the + and – of the other side of the inequality, reverse the direction of the inequality when comparing with the negative.
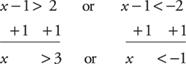
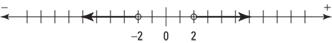
Example 11: Solve and graph the answer: |x – 1| > 2.
Notice that the absolute value expression is already isolated.
|x – 1| > 2
Compare the contents of the absolute value portion to both 2 and –2. Be sure to reverse the direction of the inequality when comparing it with –2.
Solve for x.
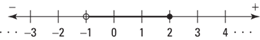
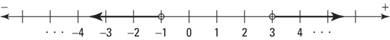
Graph the answer (see Figure 8–9).
Figure 8–9 The graphic solution to |x – 1| > 2.
Example 12: Solve and graph the answer: 3|x| – 2 ≤ 1.
Isolate the absolute value.
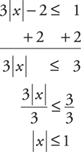
Compare the contents of the absolute value portion to both 1 and –1. Be sure to reverse the direction of the inequality when comparing it with –1.
x ≤ 1 or x ≥ –1
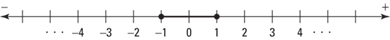
Graph the answer (see Figure 8–10).
Figure 8–10 Graphing the solution to 3|x| – 2 ≤ 1.
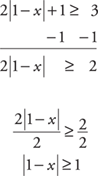
Example 13: Solve and graph the answer: 2|1 – x| + 1 ≥ 3.
Isolate the absolute value.
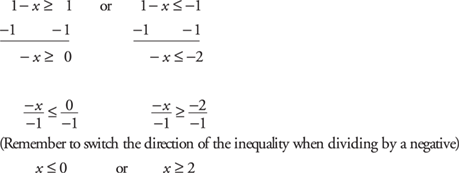
Compare the contents of the absolute value portion to both 1 and –1. Be sure to reverse the direction of the inequality when comparing it with –1.
Solve for x.
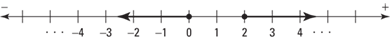
Graph the answer (see Figure 8–11).
Figure 8–11 Graphing the solution 2|1 –x| + 1 ≥ 3.
Chapter Check-Out
1. True or false: If a > b and b > c then a > c.
2. Solve for x: 7x + 3 ≤ 9x – 7
3. Graph: {x: x > –2}

4. Graph: {x: 4 > x ≥ –2
5. 3 – |–5| =
6. Solve for x: 4|x – 1| – 3 = 17
7. Solve and graph 2|x| + 4 > 8.

8. Solve and graph 5|x – 2| + 8 ≤ 33.

Answers: 1. True 2. x ≥ 5
3. 
4. 
5. –2
6. –4, 6
7. x > 2 or x < –2
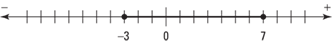
8. –3 ≤ x ≤ 7