CHAPTER 3H
PROTEIN INTRODUCTION
PROTEIN INTRODUCTION
WHAT IS PROTEIN?
WHAT ARE AMINO ACIDS?
WHAT IS COMPLETE PROTEIN?
WHAT FOODS SUPPLY COMPLETE PROTEIN?
- Grains
- Legumes
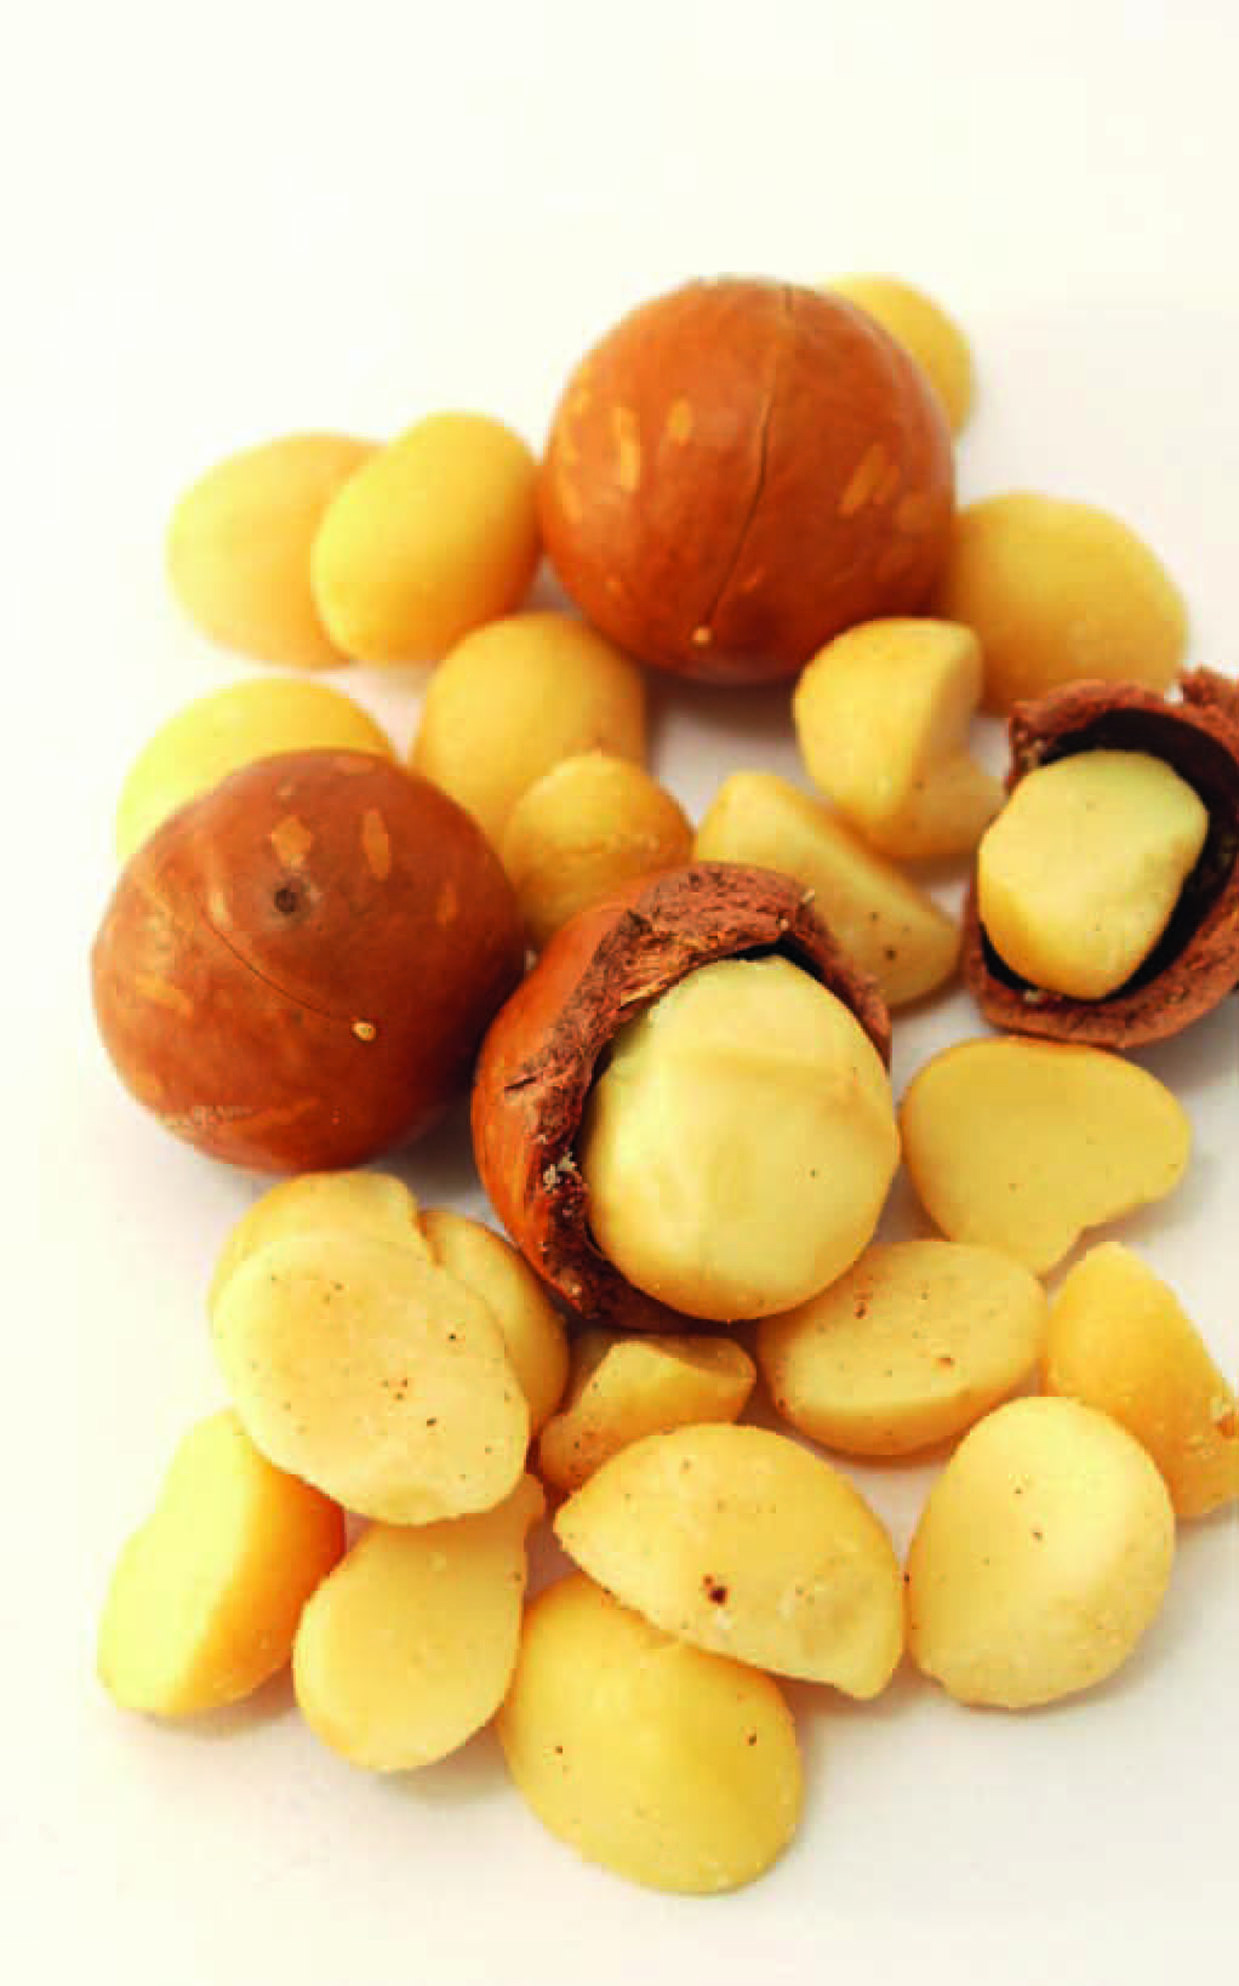
- Nuts
- Seeds
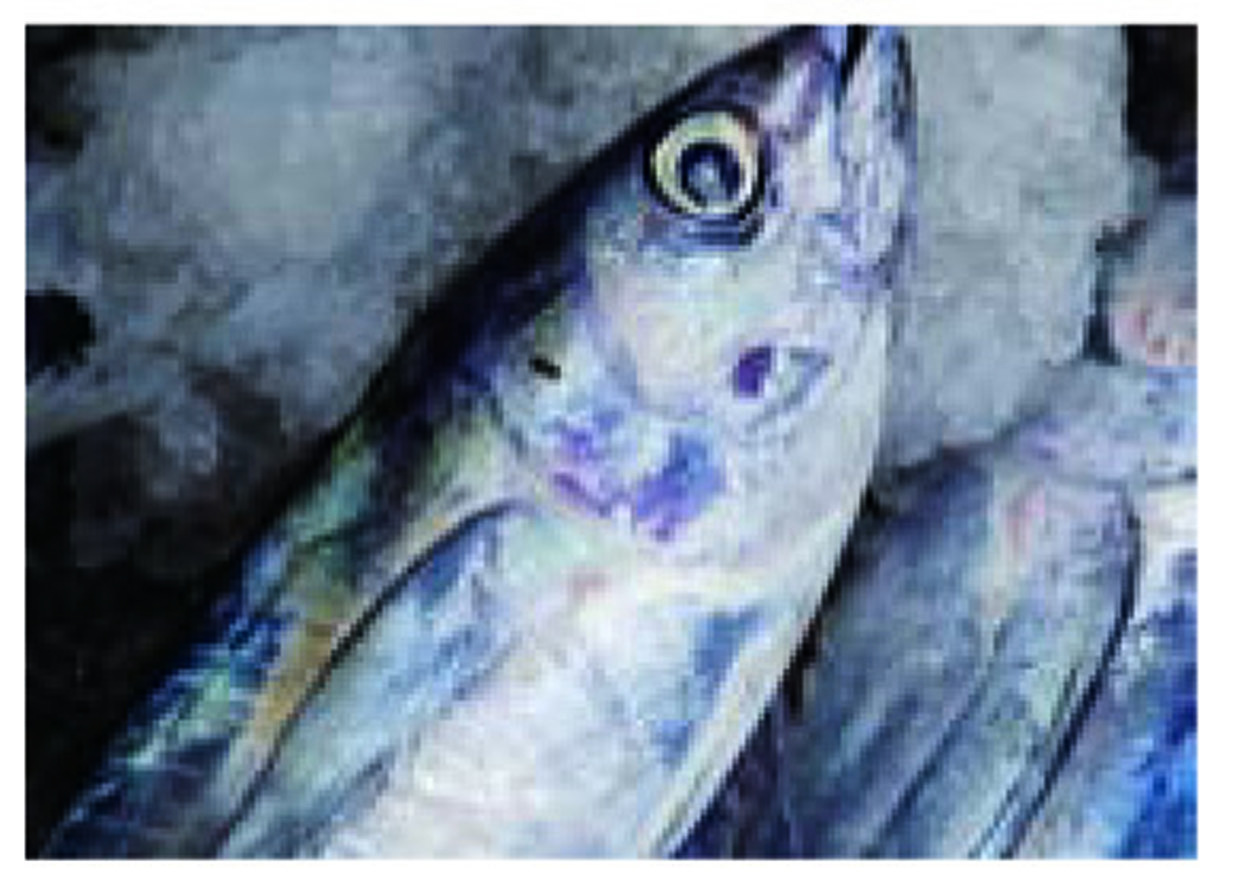
- Fish
- Seafood
- Meat
- Poultry
- Eggs
- Dairy produce
HOW MUCH PROTEIN DO I NEED EVERY DAY?
The chart below shows four main groups and the Recommended Dietary Intake (RDI)of Protein, measured in grams per day, based on the Total Protein Value (TPV) of a food. These amounts are presented as a guide and may vary due to physical activity levels, recommended height to weight ratios, and for children, the rapid growing times.


CHART 1
|
DAILY PROTEIN RDI |
1–3 YEARS |
4–8 YEARS |
9–13 YEARS BOYS |
9–13 YEARS GIRLS |
|---|---|---|---|---|
| PROTEIN (G) | 14 | 20 | 40 | 35 |
|
DAILY PROTEIN RDI |
14–18 YEARS BOYS |
14–18 YEARS GIRLS |
|---|---|---|
| PROTEIN (G) | 65 | 45 |
|
DAILY PROTEIN RDI |
19–30 YEARS |
31–50 YEARS |
51–70 YEARS |
70+ YEARS |
|---|---|---|---|---|
| PROTEIN (G) | 64 | 64 | 64 | 81 |
|
DAILY PROTEIN RDI |
19–70 YEARS |
70+ YEARS |
PREGNANCY 19–30 YEARS |
LACTATING 19–30 YEARS |
|---|---|---|---|---|
| PROTEIN (G) | 46 | 57 | 60 | 67 |


WHAT DOES PROTEIN DO AND HOW DO I OBTAIN THE REQUIRED DAILY PROTEIN?
Protein is required for growth, especially from the time of birth till approx.20–24 years. Protein is used to make all types of body cells such as bone cells, blood cells, skin cells and muscle cells. Protein is vital for the repair of body tissues, hormone production, blood clotting, digestion, metabolism and for the glandular system. Amino acids are termed the building blocks of body cell construction.
Protein is a vital component in blood. It also helps control adrenaline production, the formation of skin and hair pigment and regulation of sleep and mood patterns.
Protein assists the functions of the kidneys, gall bladder and the nervous system.
By referring to the chart below, it is clear that protein can be obtained from every meal or snack, in portions that add up to provide the Recommended Dietary Intake (RDI). Protein foods and meals that have excess saturated fats are more difficult to digest. Protein is digested in the stomach and this process can take 3–5 hours. Excess drinking during meals and eating protein foods with saturated fats may all reduce the protein value of a meal.
CHART 2
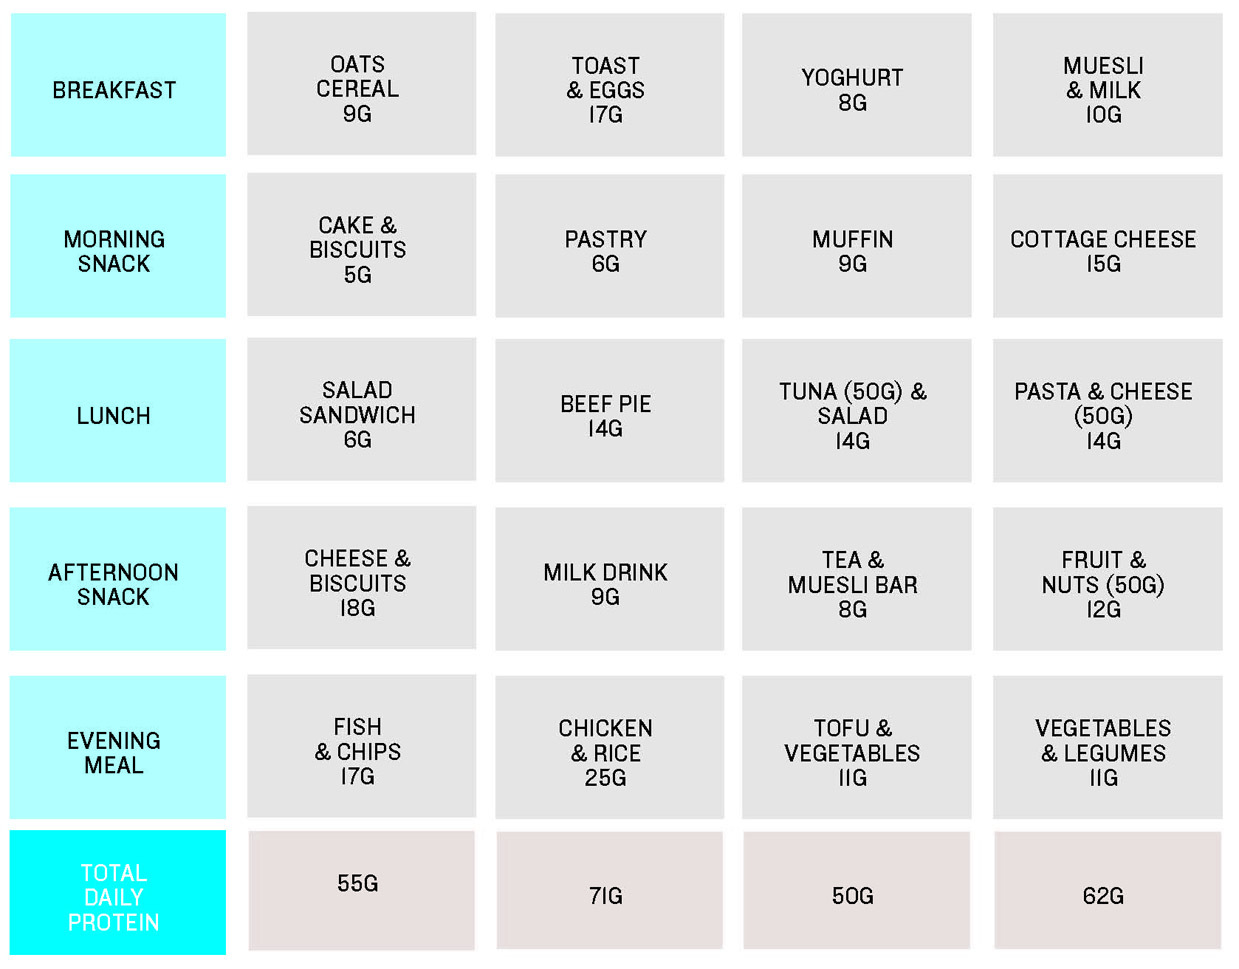
The chart above is based on 100g food portions (approx.) unless stated otherwise.
WHAT ARE THE BEST PROTEIN FOODS?
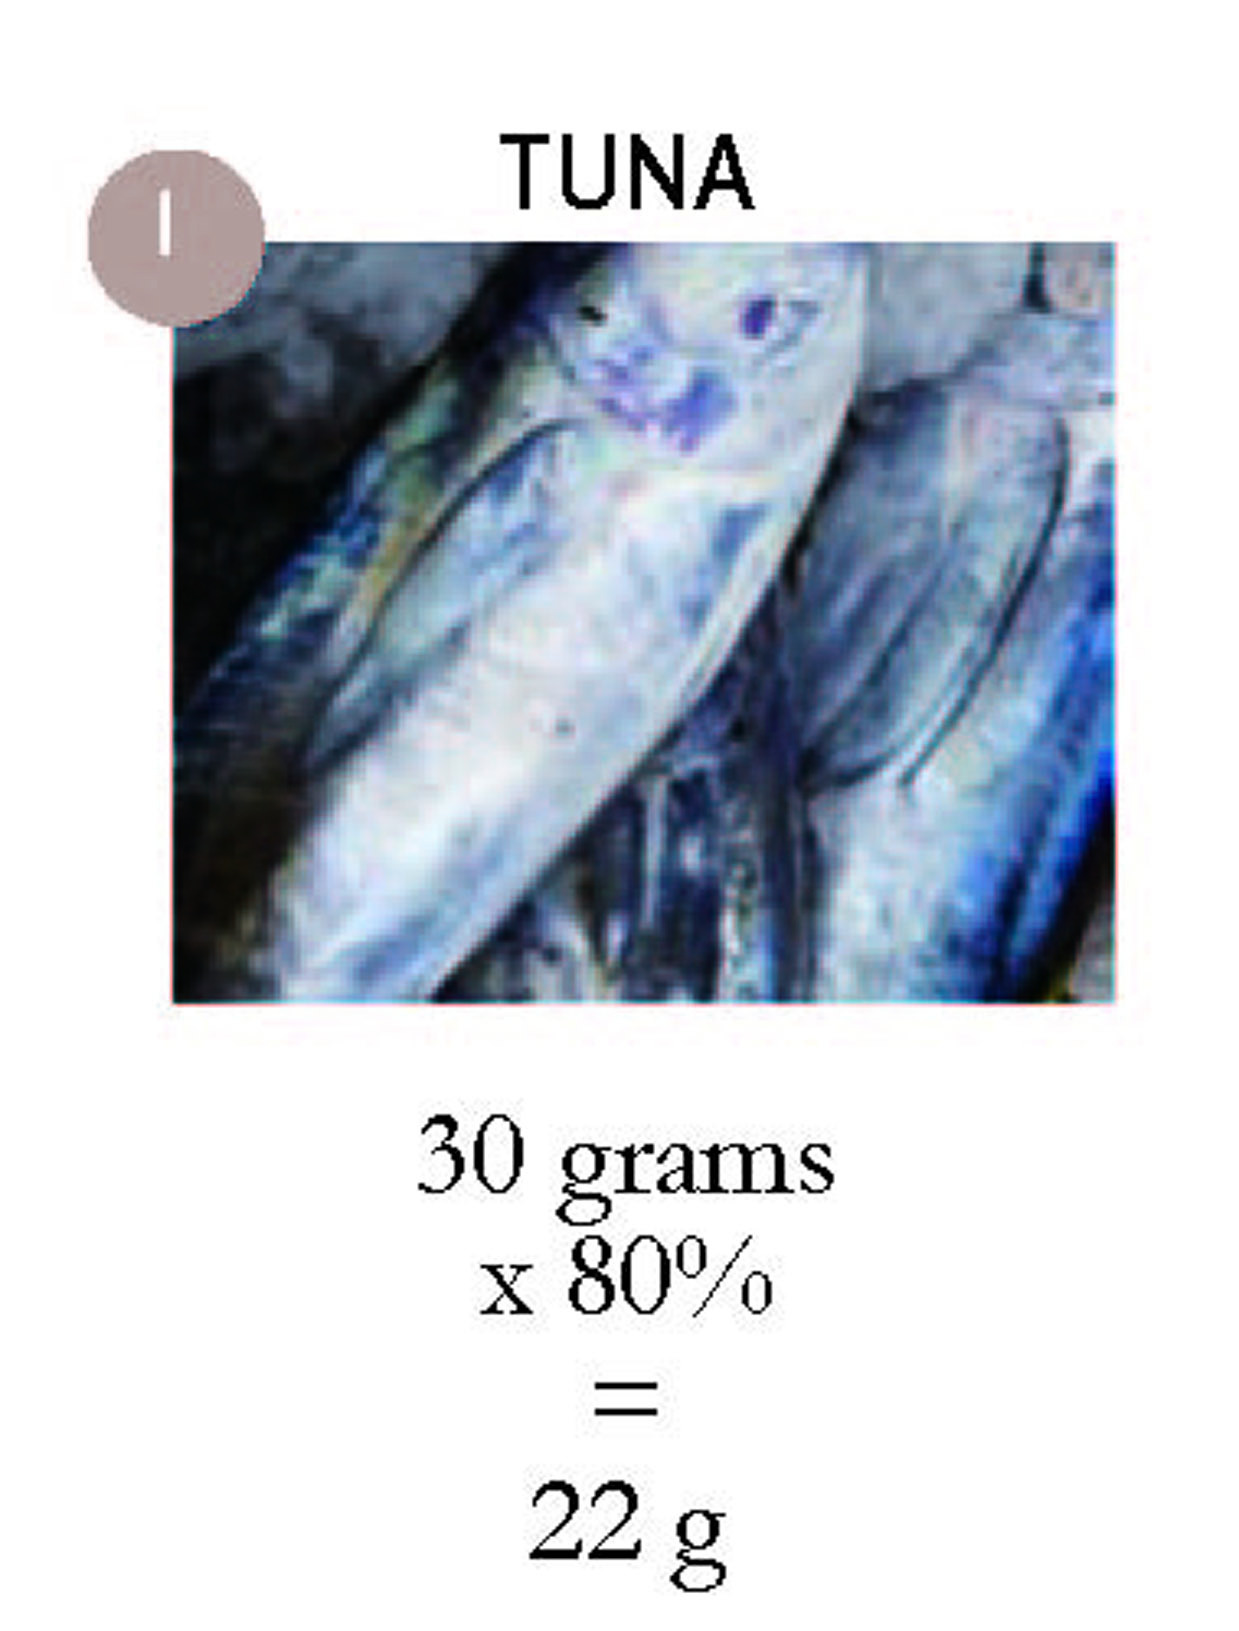
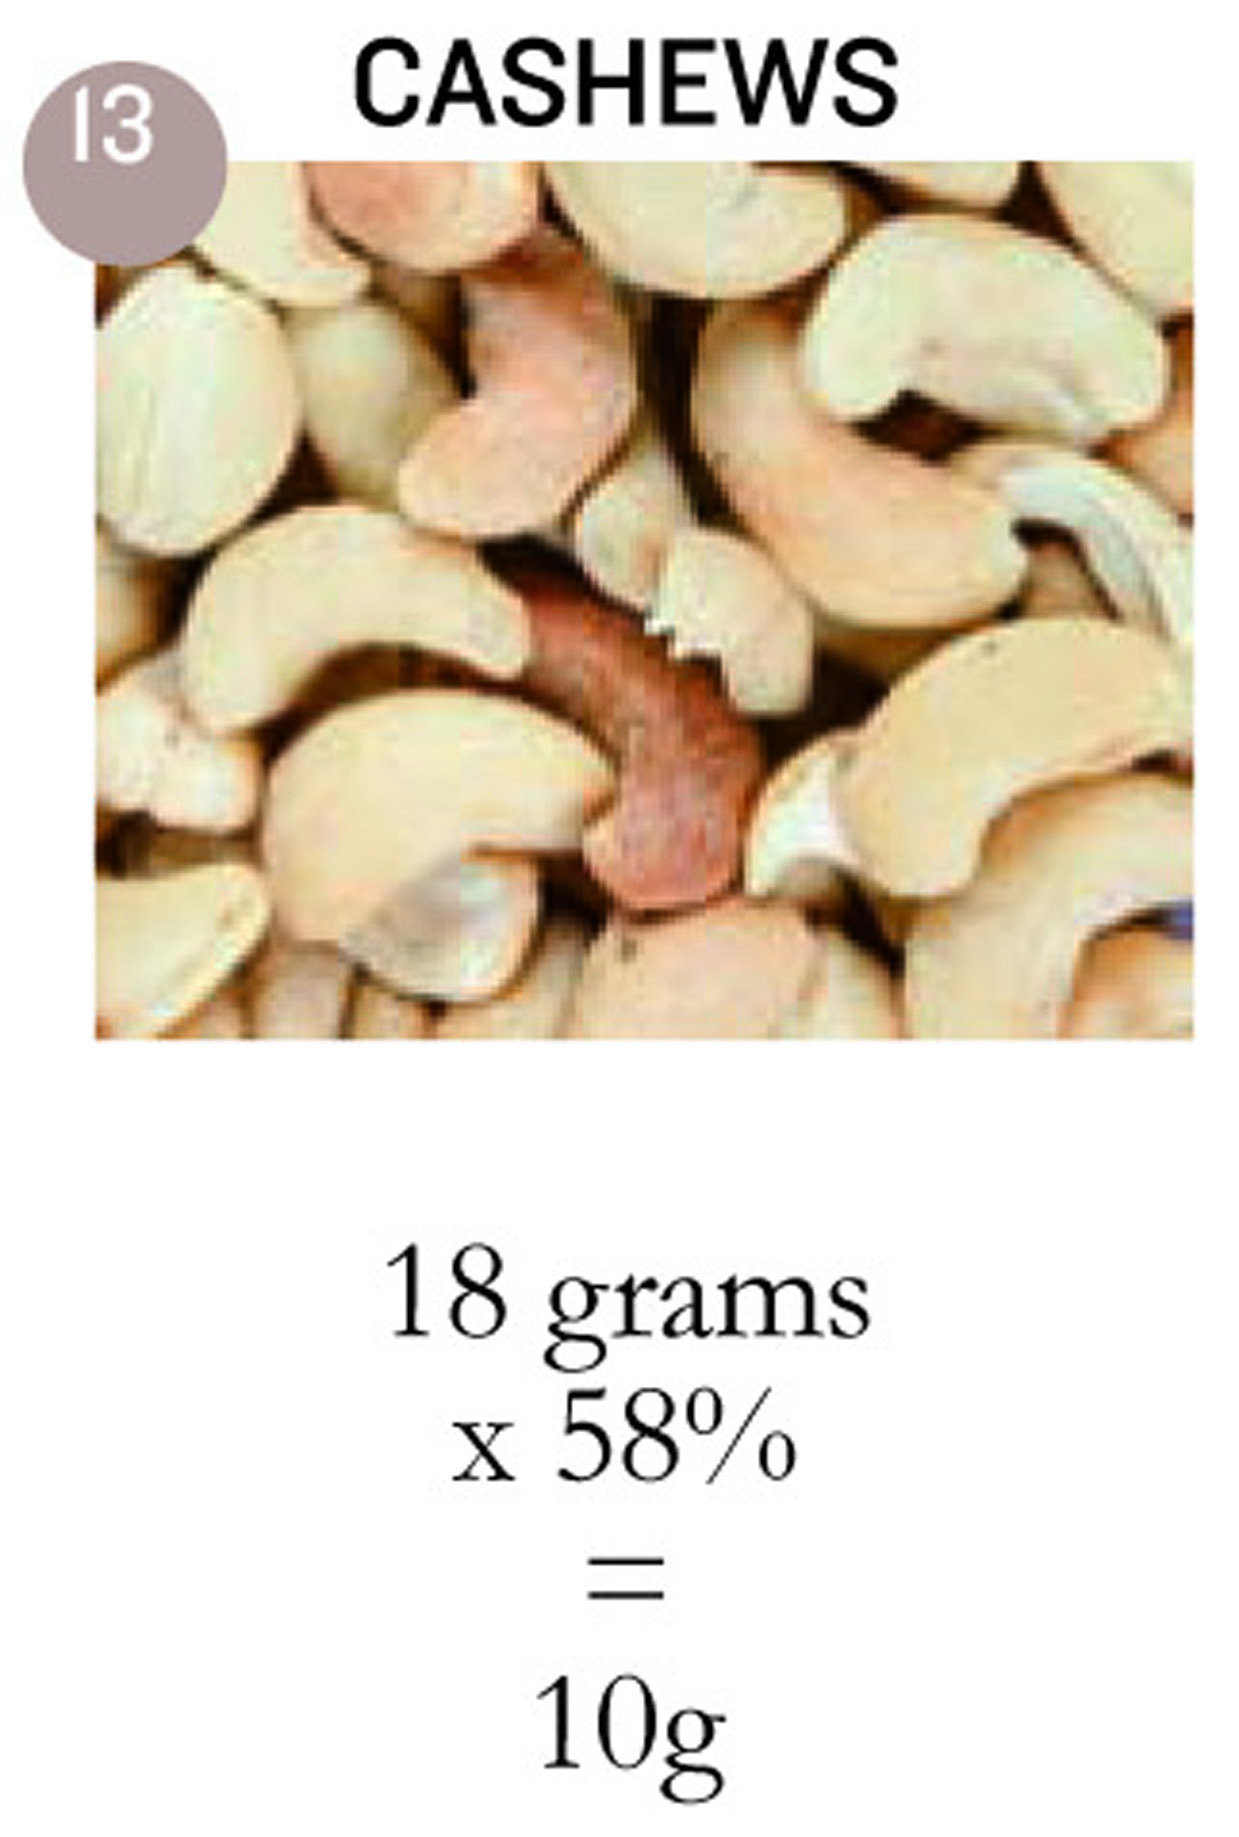
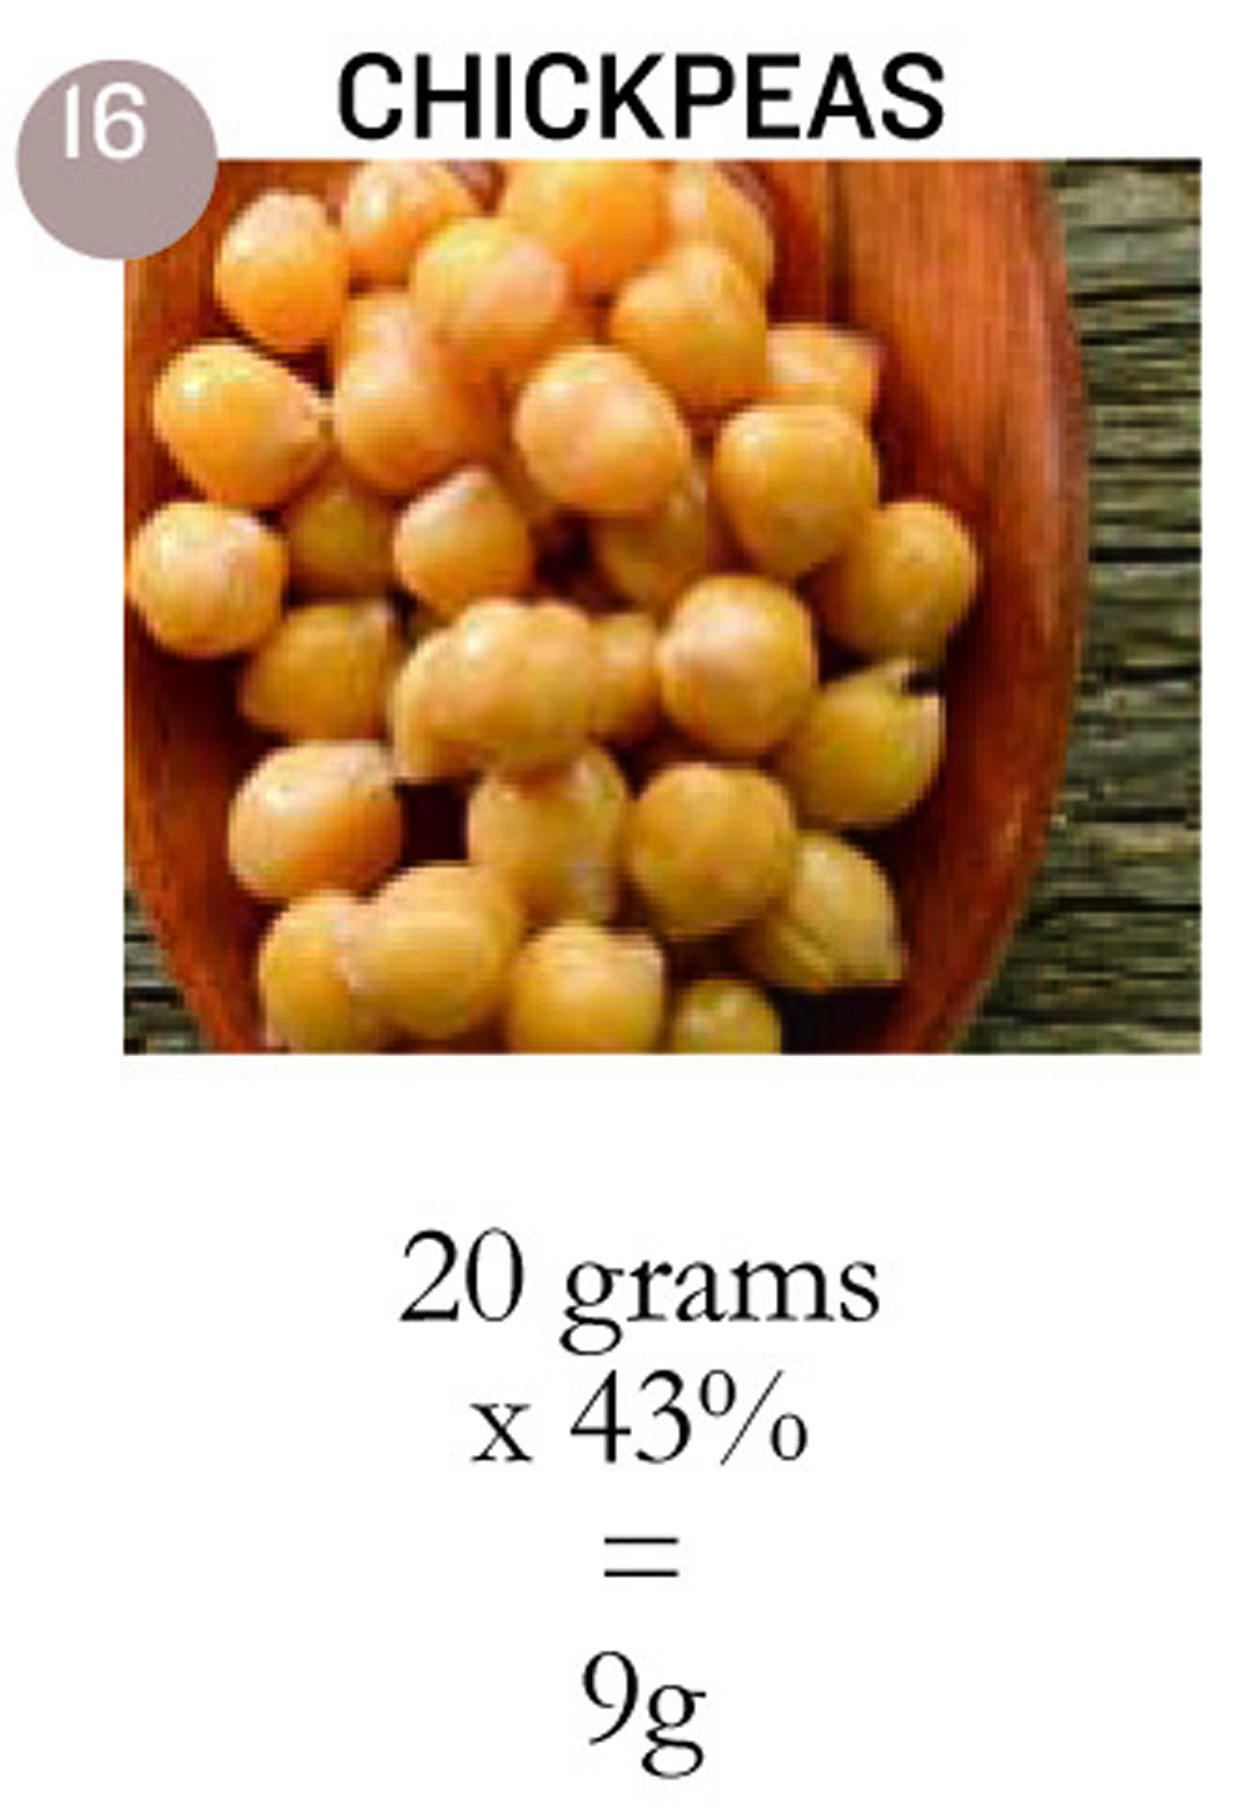
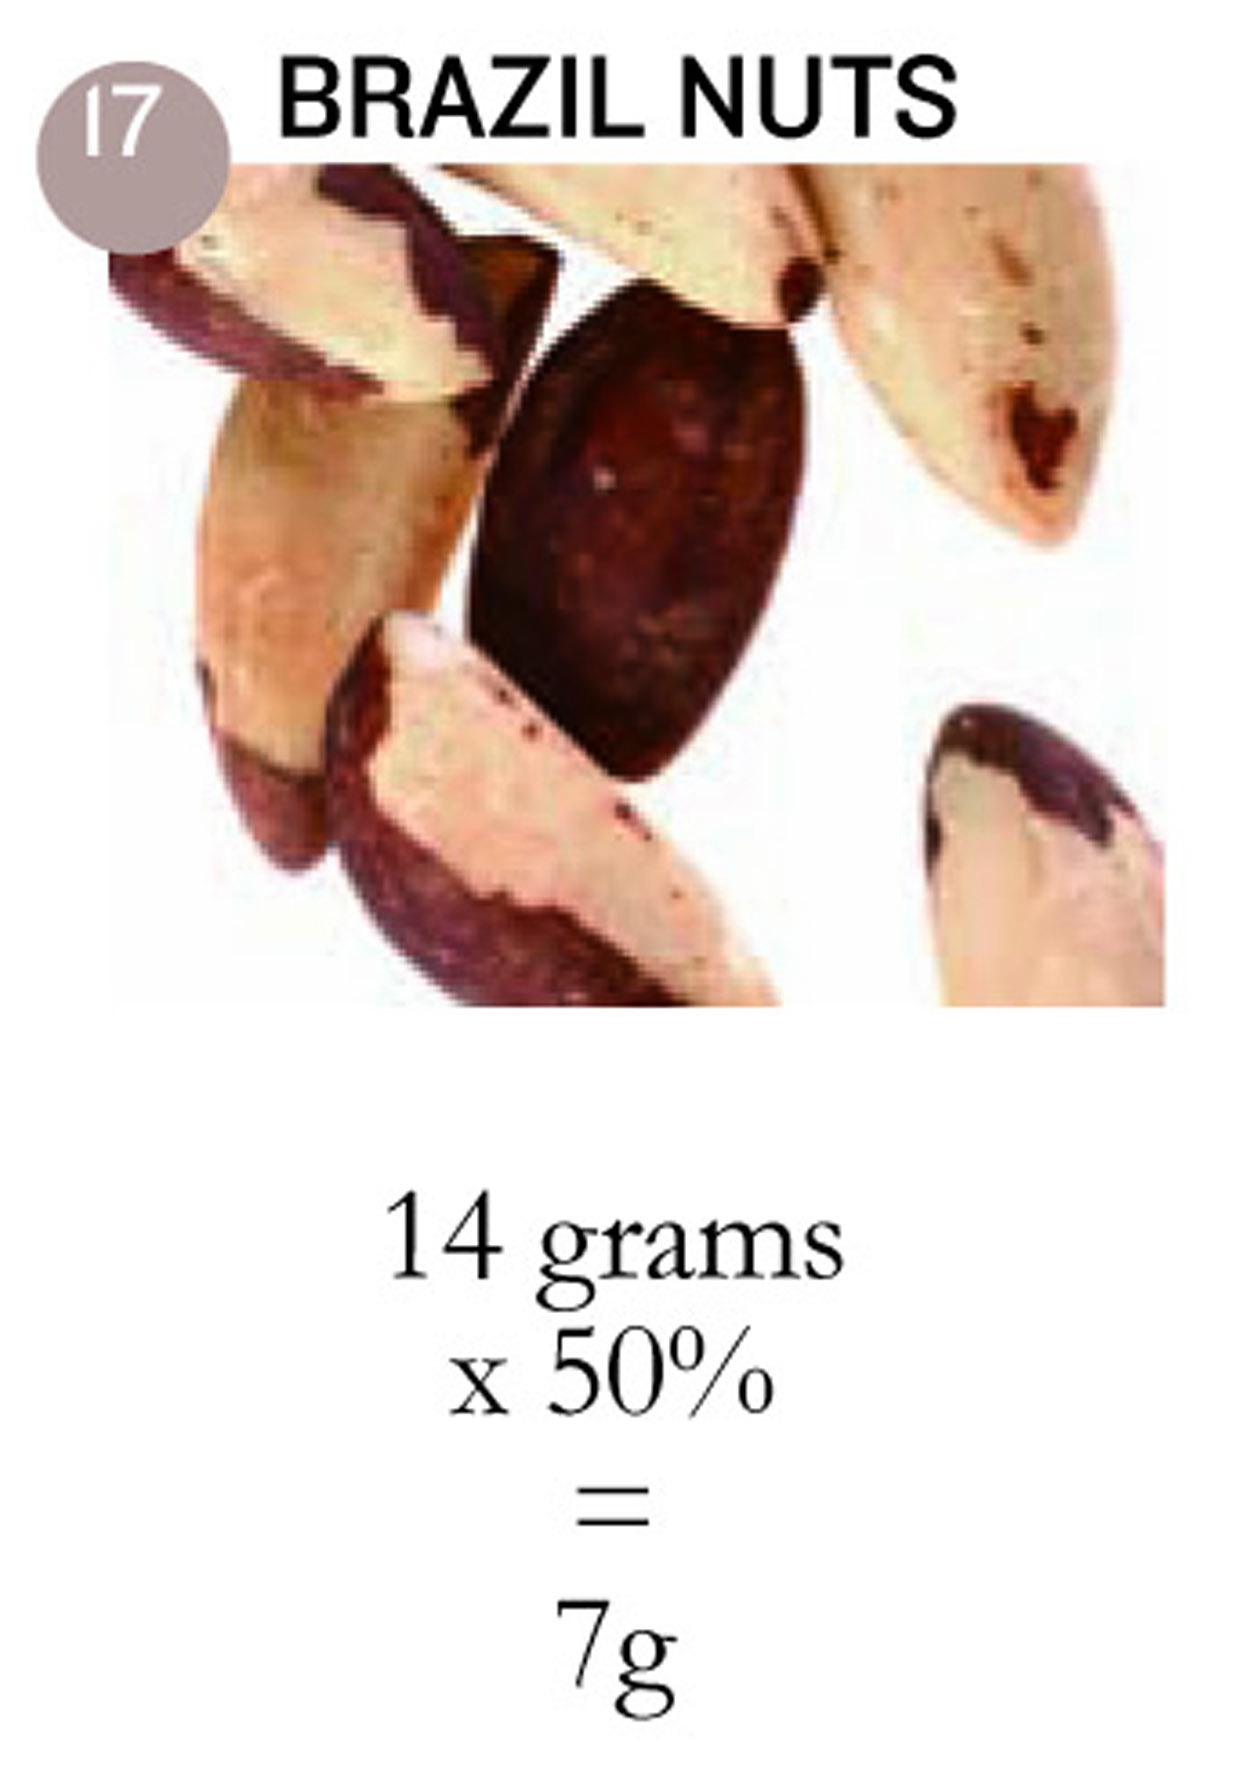
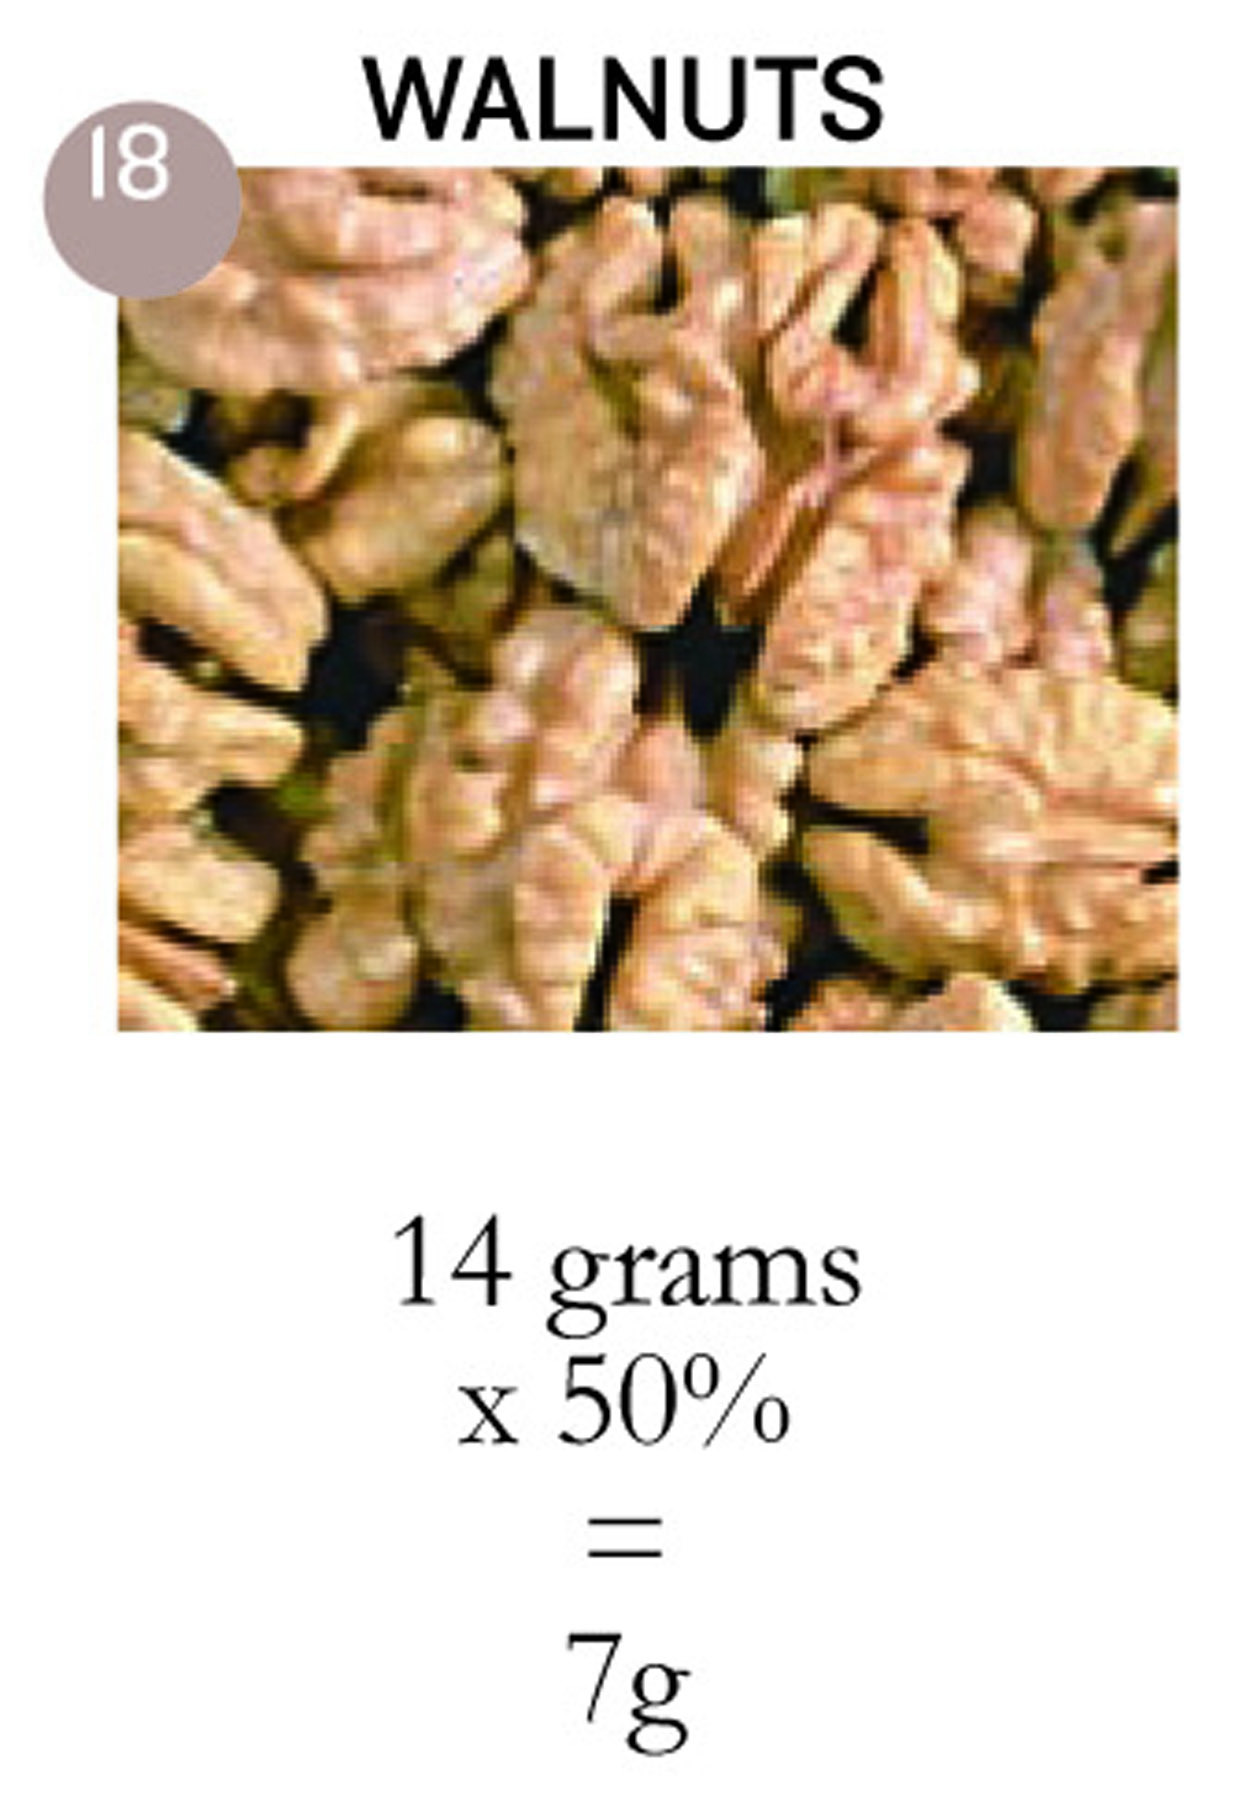
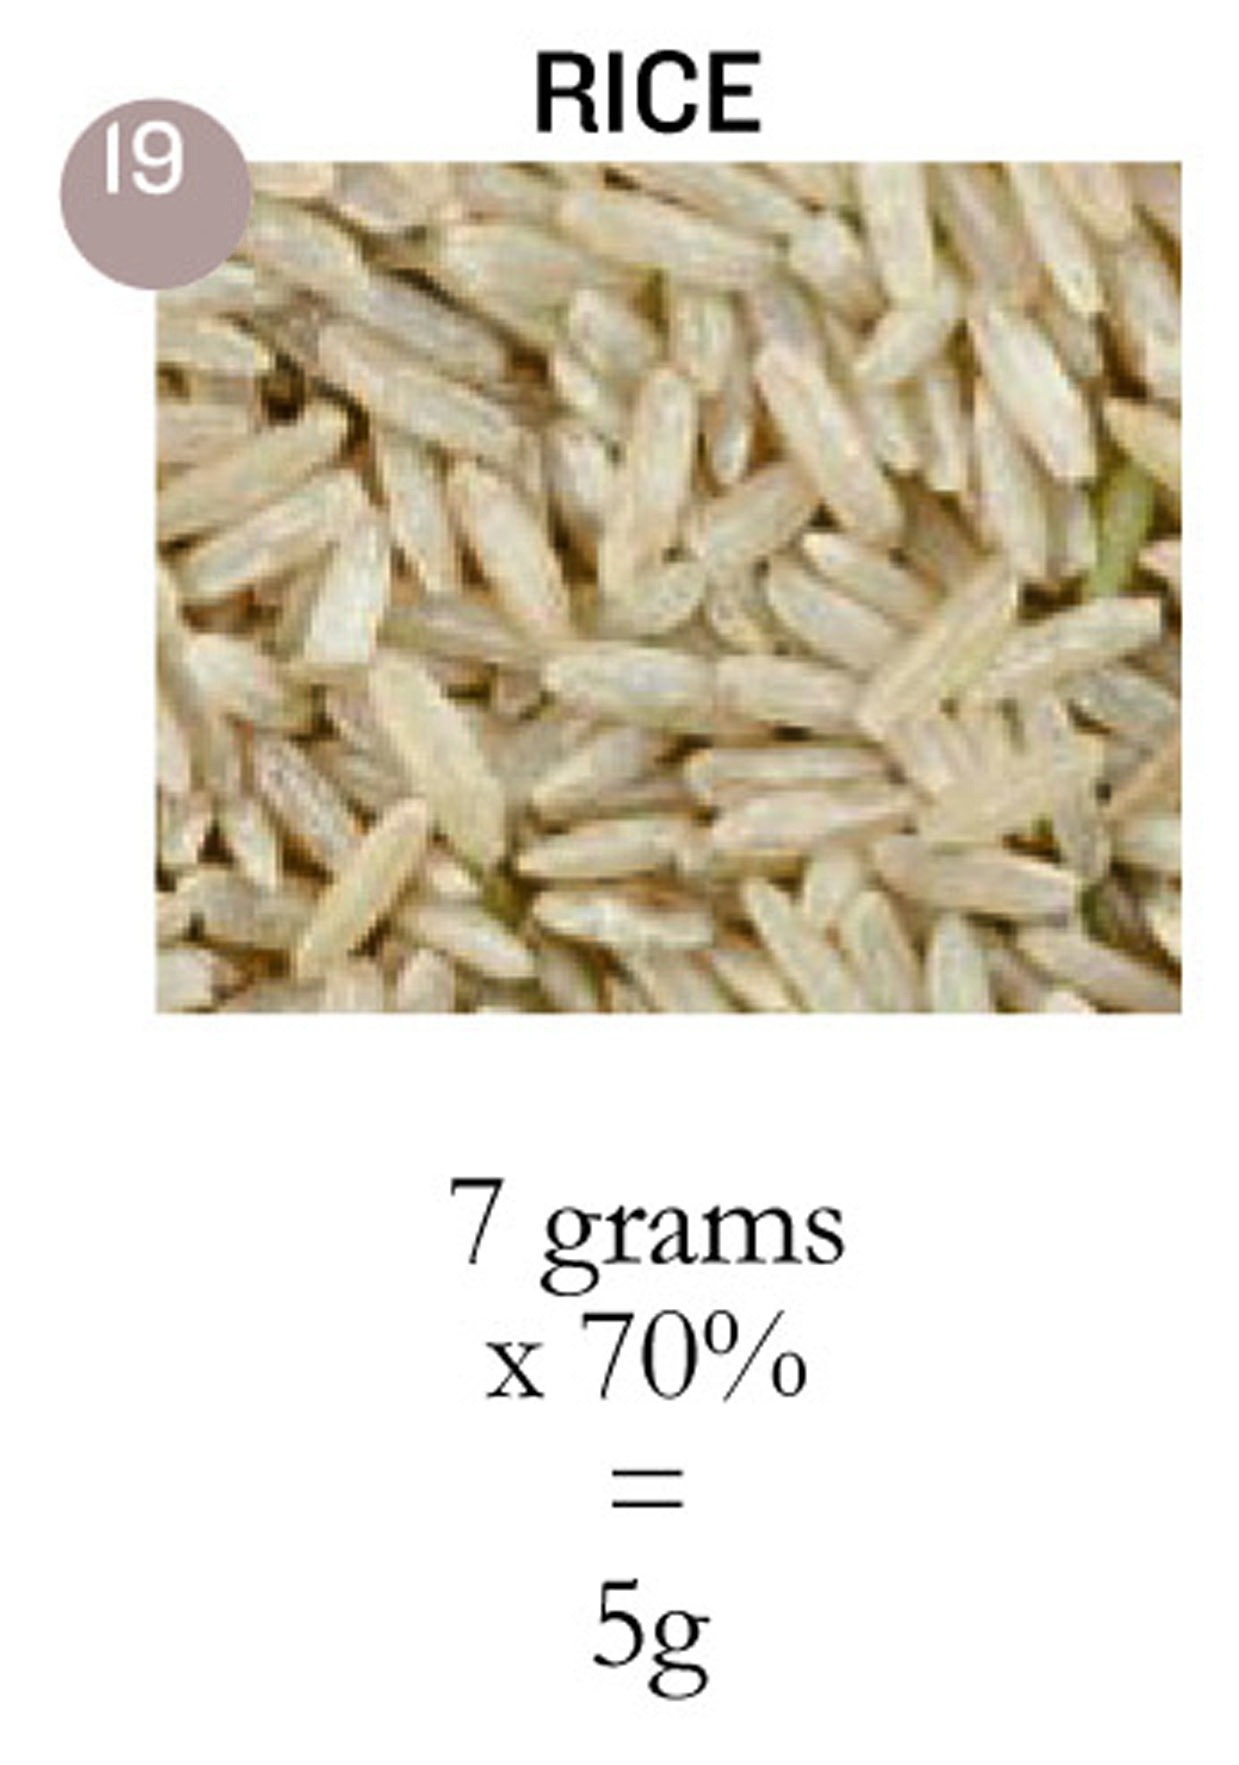
The best protein foods are listed on chart 4. These amounts are based on the following nutritional information below, in chart 3. For example with tuna, 30g of protein (Total Protein Value) is contained per 100g portion. The amount of 80% is the useable protein, also referred to as the ‘Net Protein Utilisation’ (NPU) as shown on chart 3 below. Chart 3 shows the main protein groups and 7 factors that are very important when evaluating the best protein foods. Such factors as saturated fat and cholesterol need to be restricted in the regular diet, due to their link to heart disease and other health problems. Cooking and the added fats of protein foods also increase the health risk problems. The fibre content of food is a beneficial factor.
The best protein foods also contain a good balance of minerals and vitamins. Food such as nuts, seeds, whole grains and legumes supply an abundance of protein, minerals, vitamins, essential lipids and trace nutrients.
CHART 3
|
1 TOTAL PROTEIN VALUE grams |
2 N.P.U. % |
3 TOTAL FAT grams |
4 SATURATED grams |
5 CHOLESTEROL mg |
6 FIBRE grams |
7 CALORIES |
|
|---|---|---|---|---|---|---|---|
| GRAINS WHEAT WHOLE GRAIN | 15 | 45% | 2 | 0 | 0 | 12 | 329 |
| LEGUMES KIDNEY BEANS | 24 | 38% | 1 | 0 | 0 | 25 | 333 |
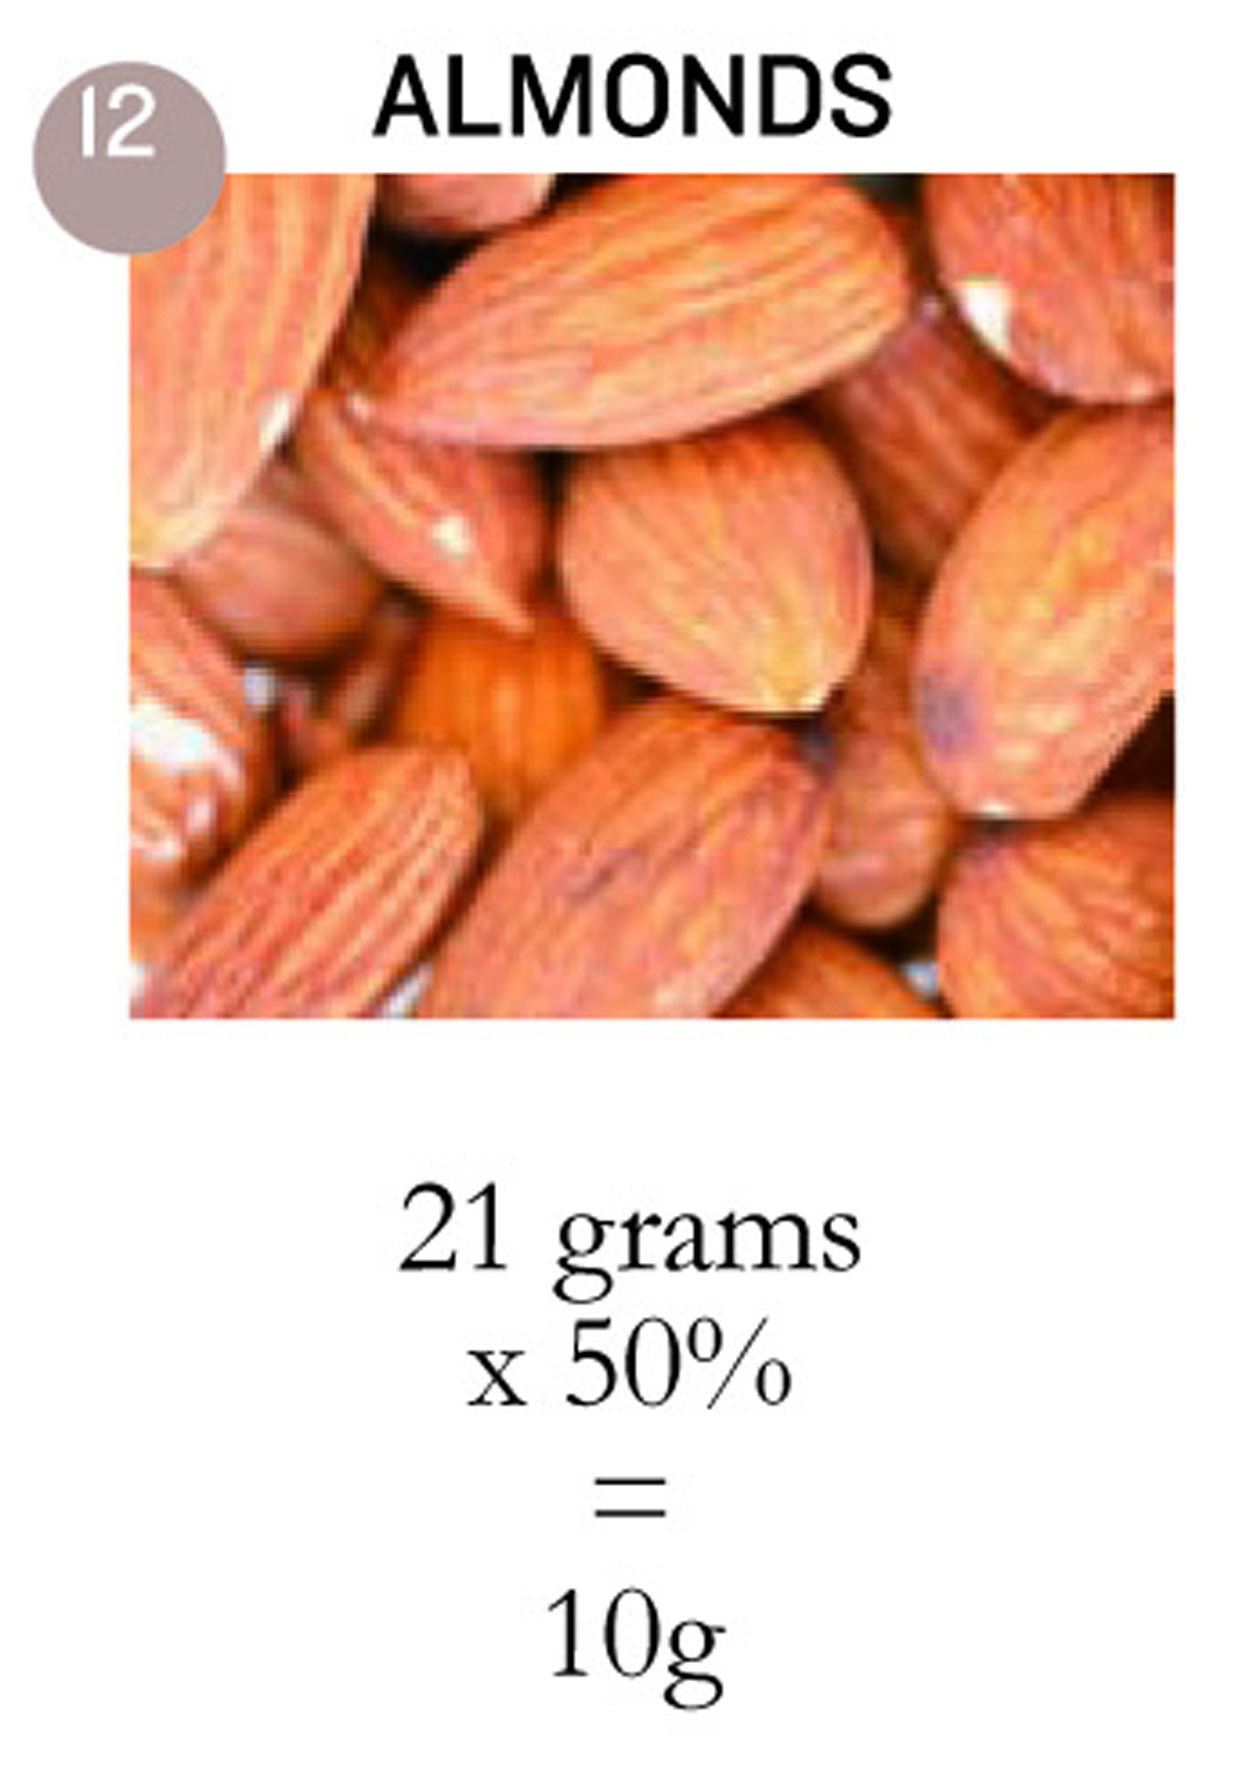
| NUTS ALMONDS | 21 | 50% | 49 | 4 | 0 | 12 | 578 |
| SEEDS SUNFLOWER | 23 | 58% | 50 | 5 | 0 | 11 | 570 |
| FISH TUNA | 30 | 80% | 6 | 2 | 49 | 0 | 184 |
| FISH PERCH | 19 | 80% | 1 | 0 | 90 | 0 | 91 |
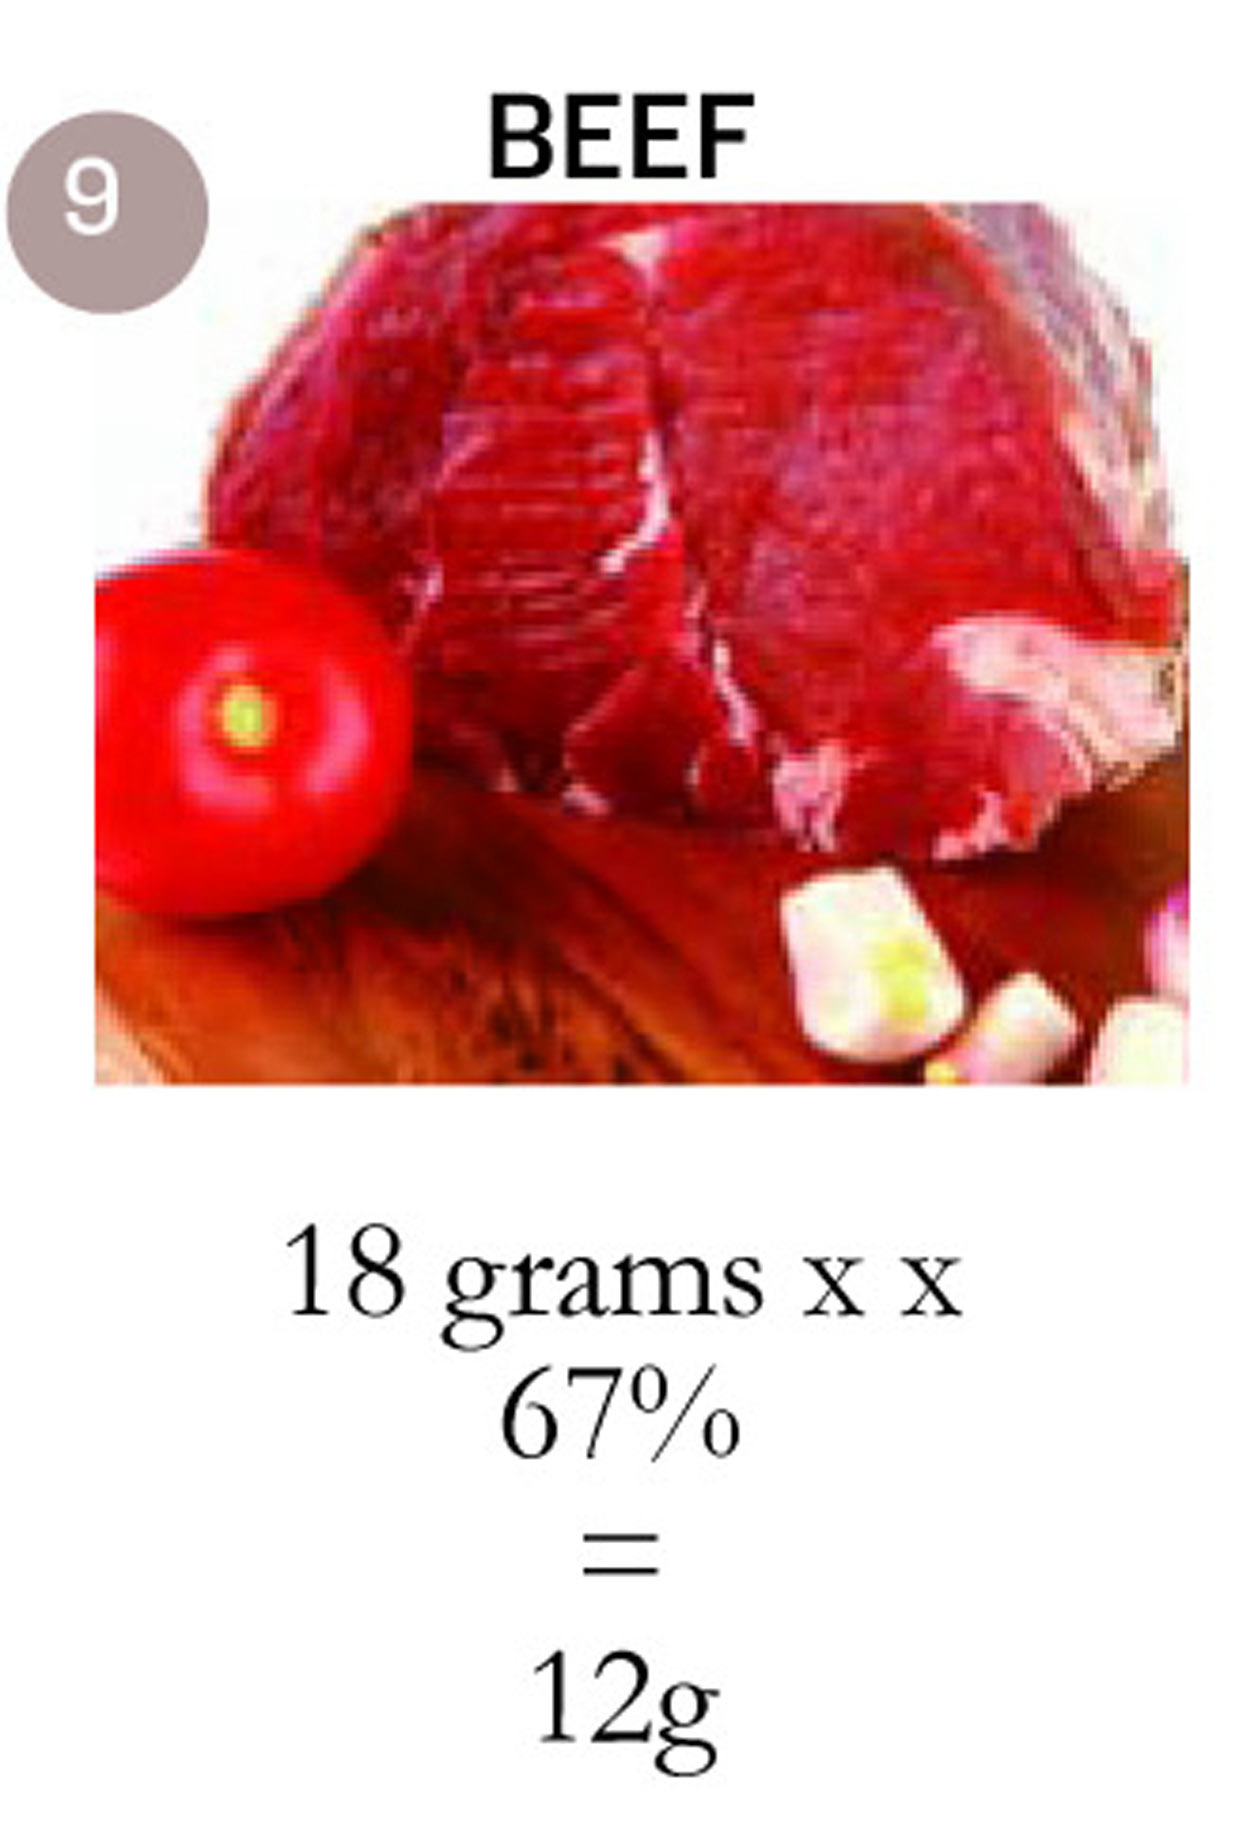
| MEAT LEAN BEEF RAW | 18 | 67% | 22 | 9 | 81 | 0 | 277 |
| CHICKEN | 21 | 65% | 21 | 6 | 88 | 0 | 300 |
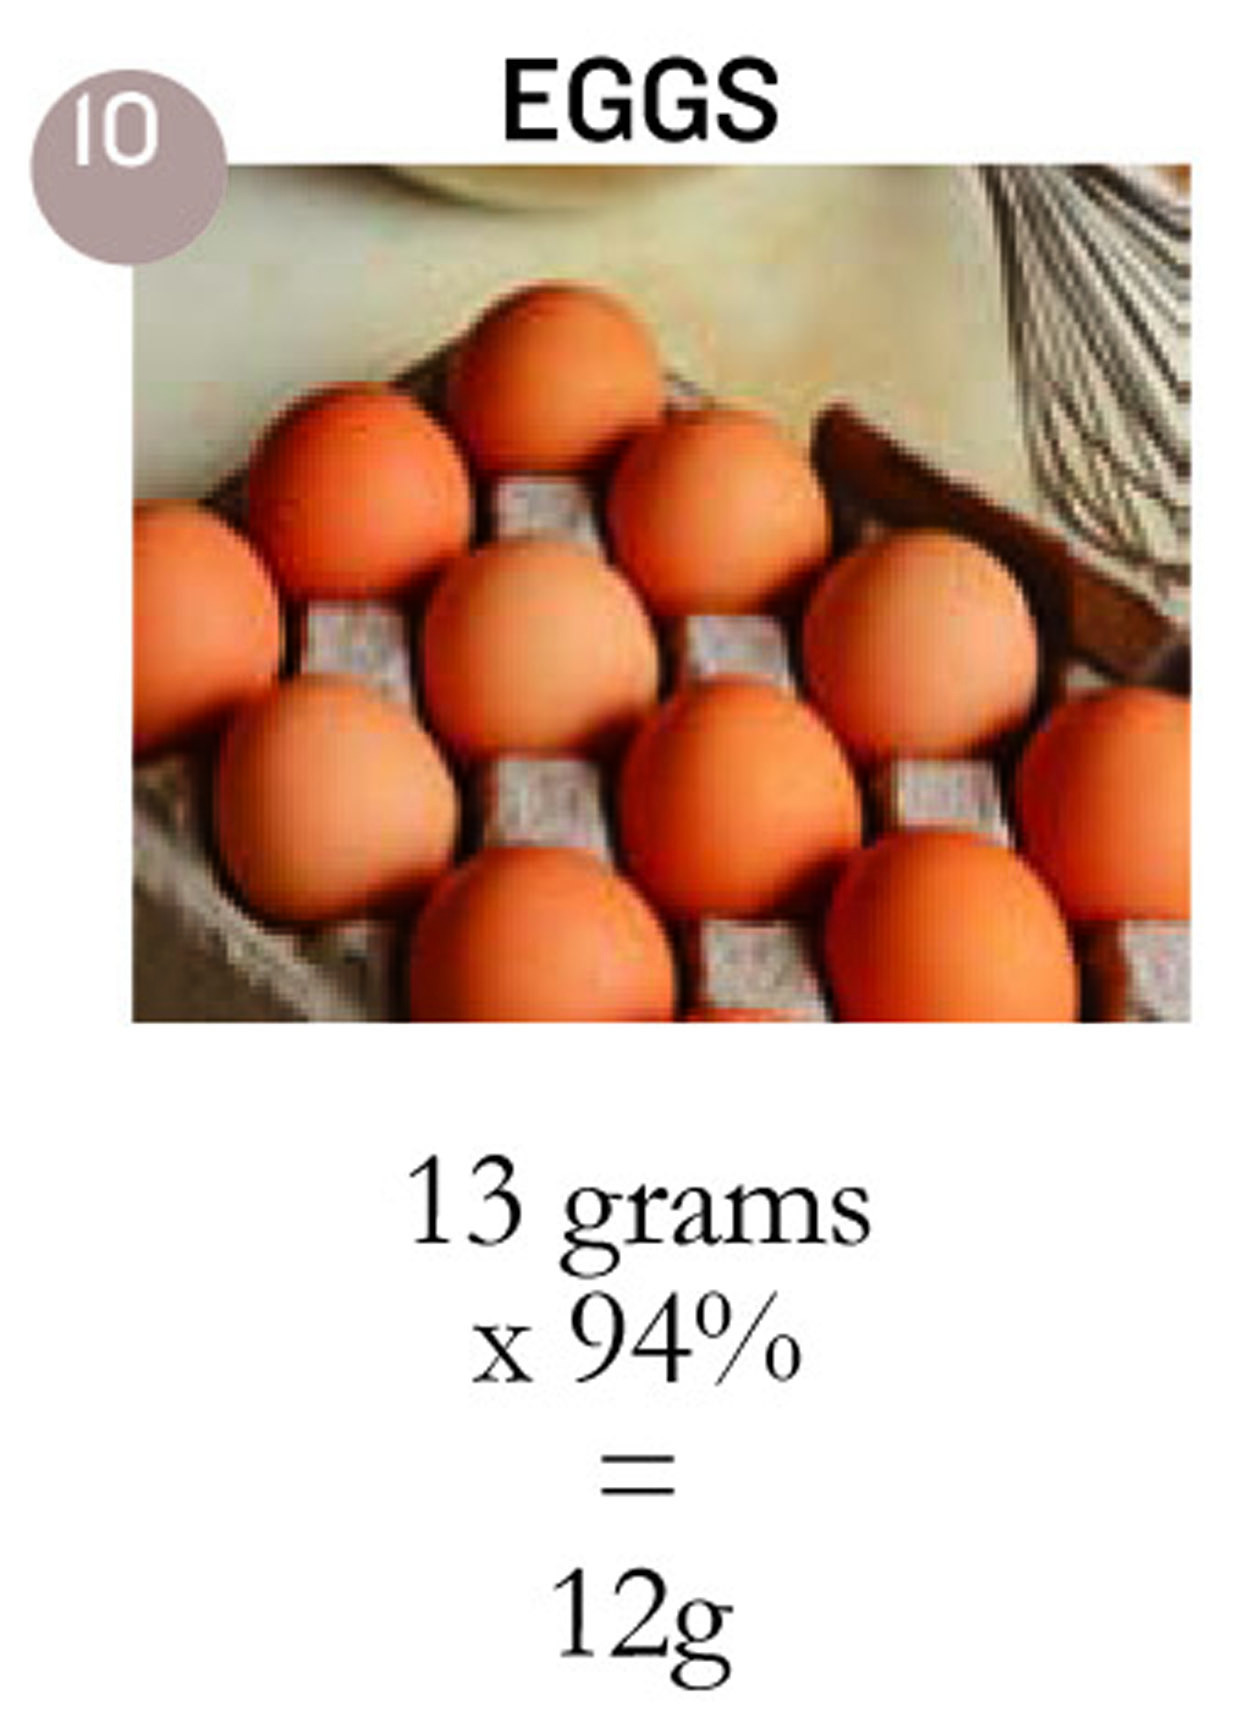
| EGGS WHOLE | 13 | 94% | 10 | 3 | 423 | 0 | 143 |
| CHEESE CHEDDAR | 25 | 70% | 33 | 21 | 105 | 0 | 403 |
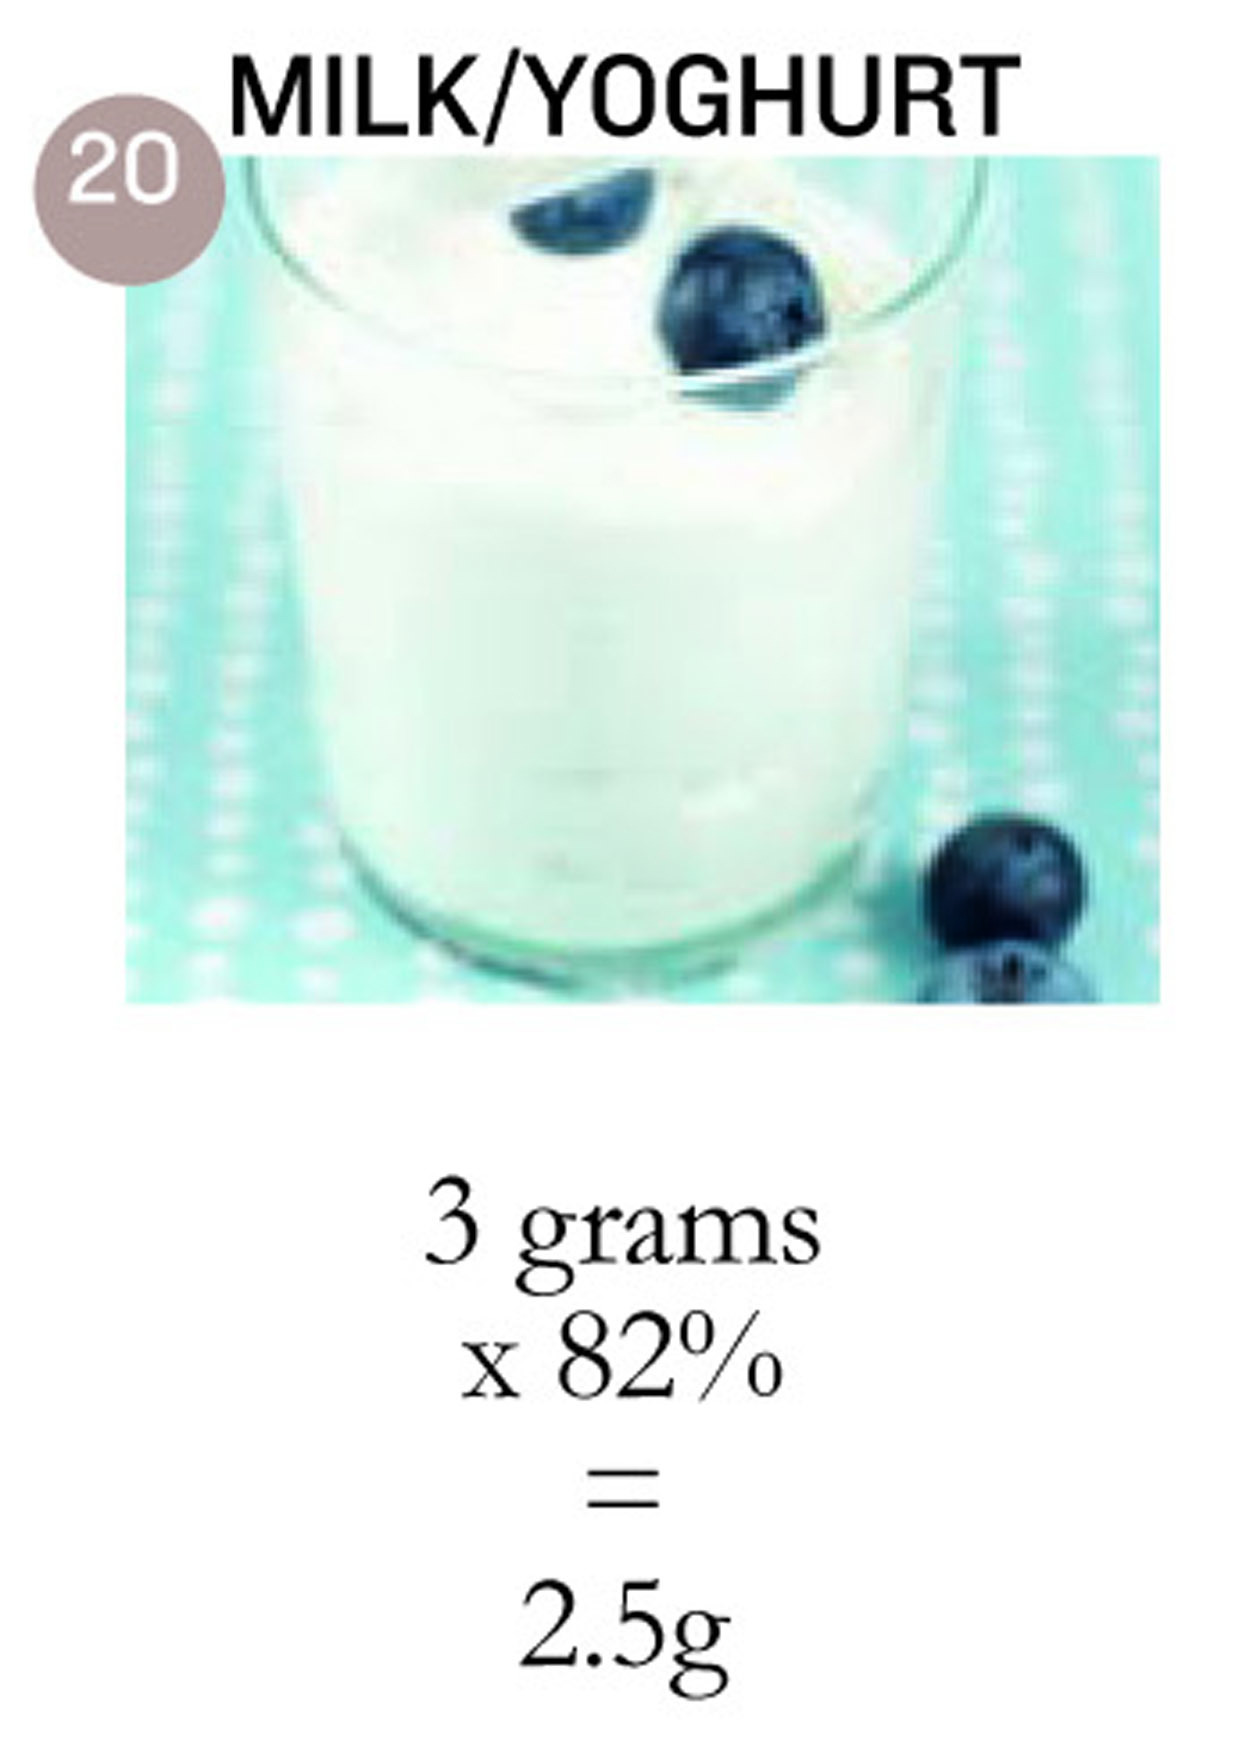
| MILK WHOLE 3.5% | 3 | 82% | 3 | 2 | 10 | 0 | 60 |
| YOGHURT PLAIN WHOLE | 3 | 82% | 3 | 2 | 13 | 0 | 61 |
CHART 4


NOTE: All amounts in this book are measured in milligrams (mg) per 100 grams, unless stated otherwise.
WHAT TYPE OF PROTEIN DOES THE BODY REQUIRE?
There are a number of factors when evaluating the type of protein the human body requires For adults, 8 ‘essential amino acids’ are required:
(Children need the 8 essential amino acids plus one extra amino acid: histidine.)
Amino acids are required by the body in a specific ratio, as presented in chart 5 below. No food provides the exact same ratio but many foods provide a reasonable balance of the essential amino acids. Any food that supplies the 8 essential amino acids is termed a complete protein food. All grains, legumes, nuts, seeds, dairy, meat, poultry and fish supply the 8 essential amino acids. The best protein foods are low in saturated fats and require the least cooking plus they supply a good amino acid balance. Foods that provide their amino acid balance in a ratio similar to that in chart 6, are termed ‘high quality protein foods’. The term ‘Net Protein Utilisation’ (NPU) is used as a measure of protein foods and their supply of amino acids, compared to the ideal proportion as shown in the chart below. By combining foods such as rice and corn or bread and cheese, for example, increased protein value is obtained due to an improved amino acid balance. Proper food combination can improve the digestion of protein foods. Refer to the food combination chart and information guide.
Excess intake of protein foods can lead to weight gain.
CHART 5

PROPORTION OF HOW THE BODY REQUIRES THE 8 ESSENTIAL AMINO ACIDS
This chart shows the various amounts, in milligrams, that the body requires of the 8 essential amino acids from foods, in order to obtain ‘complete protein’.
WHAT PROTEIN FOODS PROVIDE THE BEST NET PROTEIN UTILISATION?
The 5 protein foods listed in chart 6 below have the best Net Protein Utilisation (NPU) of all foods. Eggs have the highest value with 94%.
Chart 7 below shows that the amino acid methionine is low (401mg) compared to the required 600mg for a 100g serve, or 2 eggs.
Therefore, to obtain all your daily protein from eggs, for a 60kg person, approx.3 eggs are required. However, it is best to limit egg consumption to approx.5 eggs per week, due to the high cholesterol value. Refer to chapter 3L for details.
CHART6
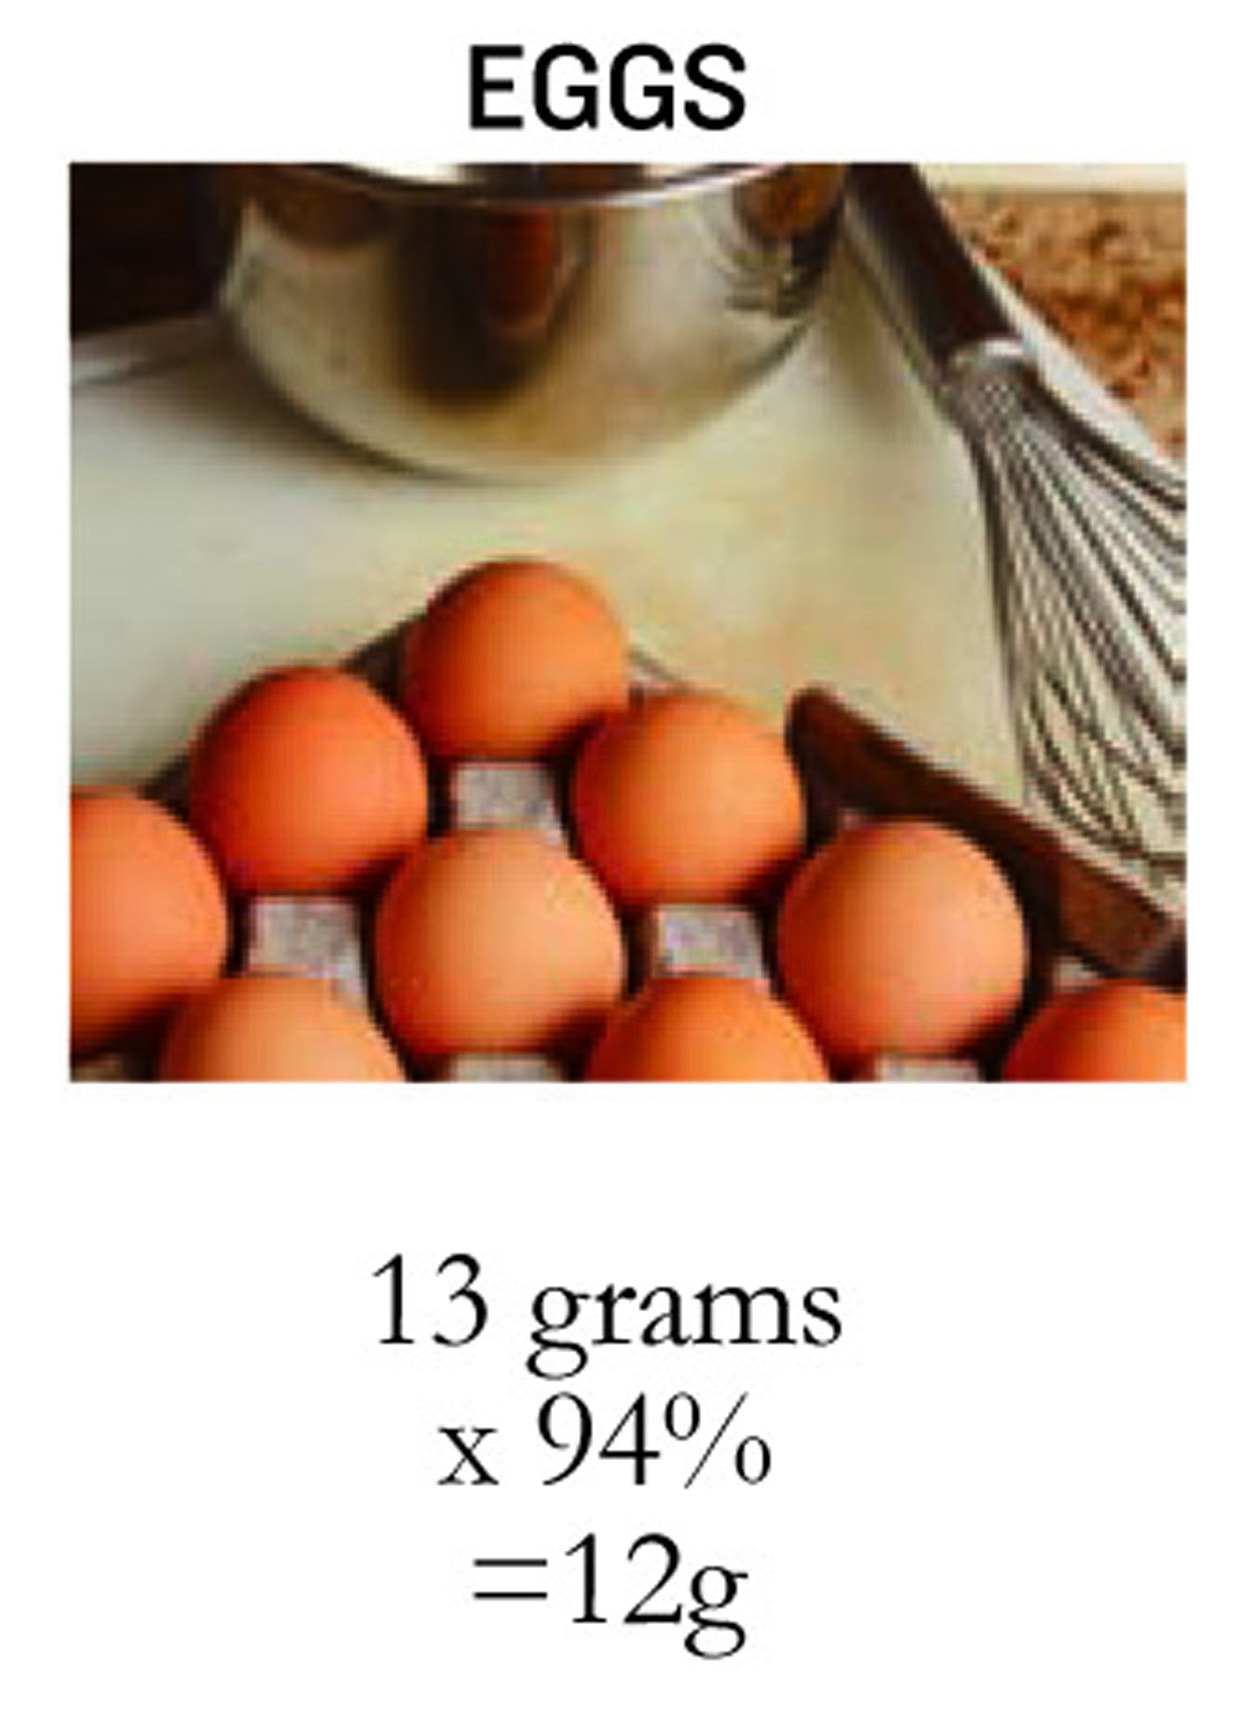

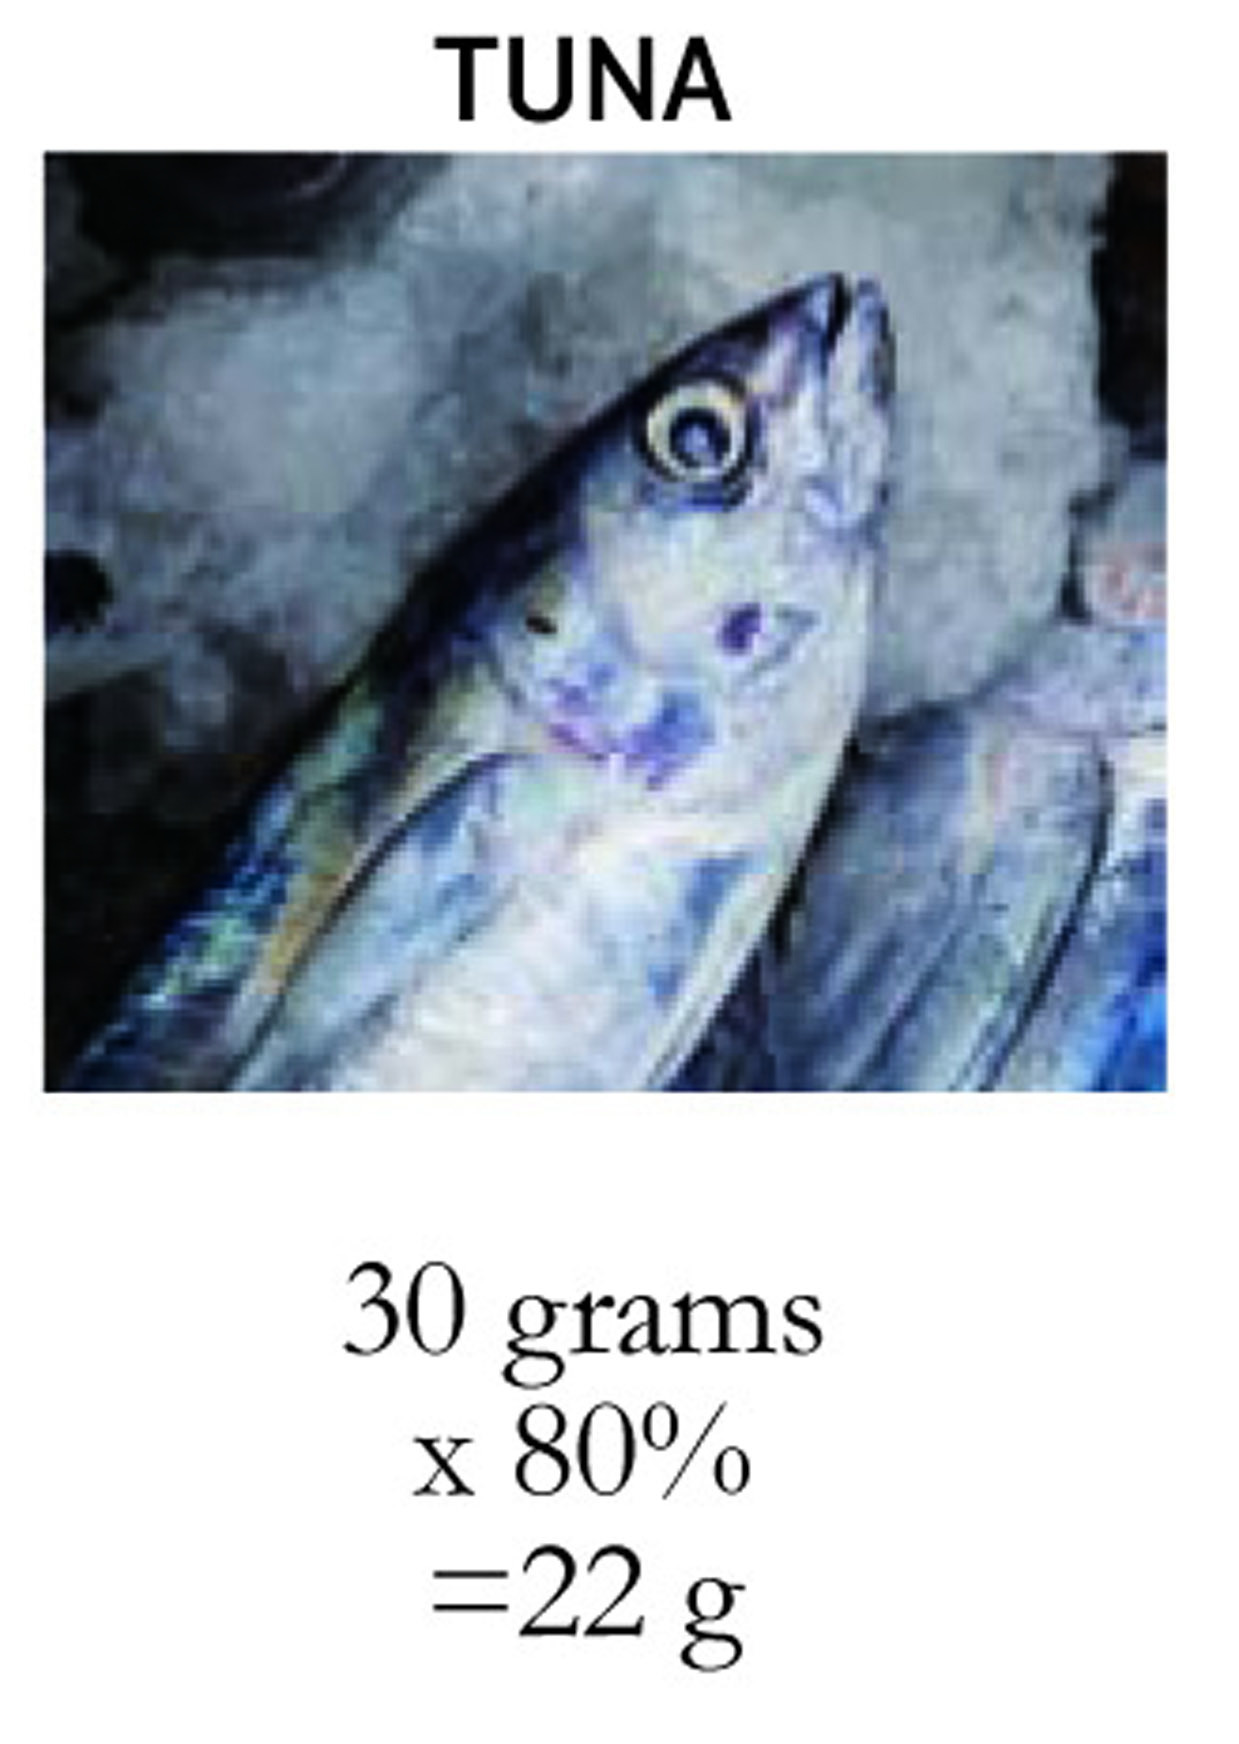
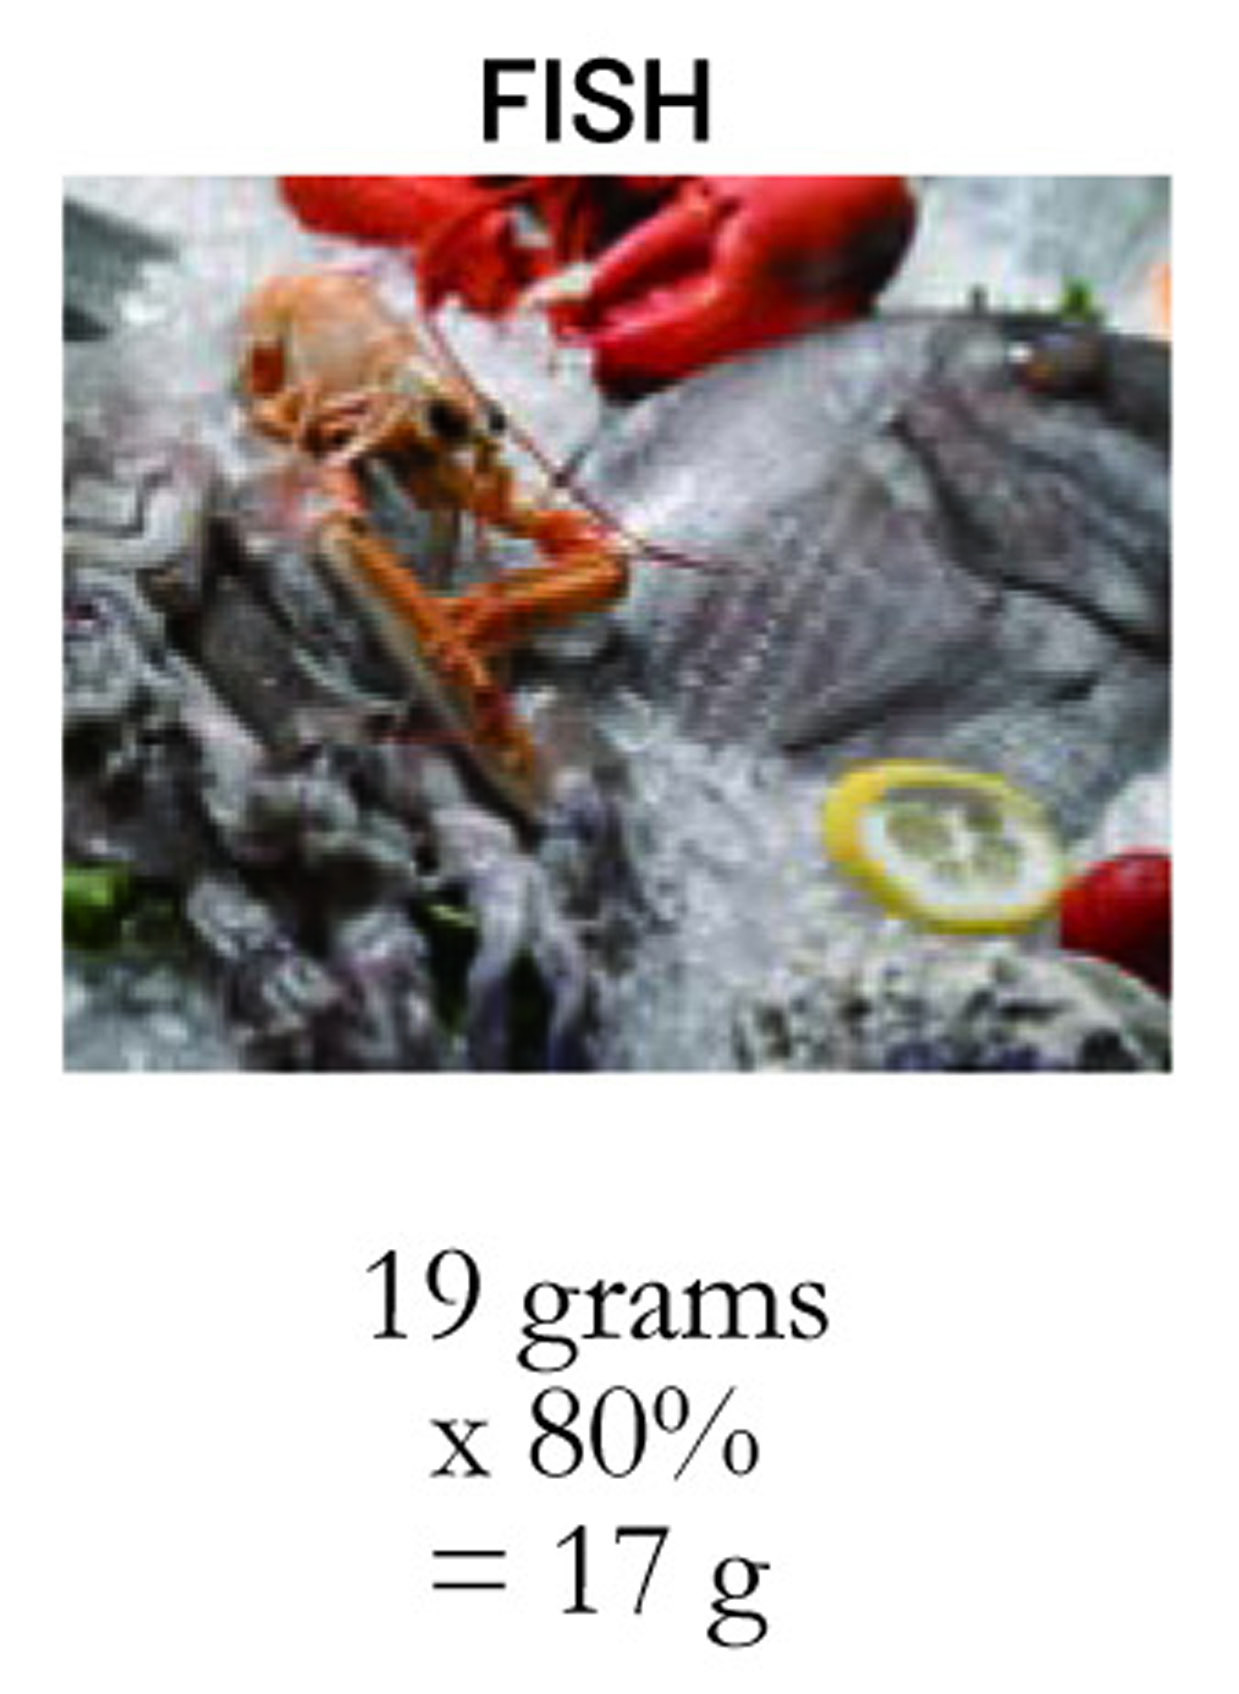
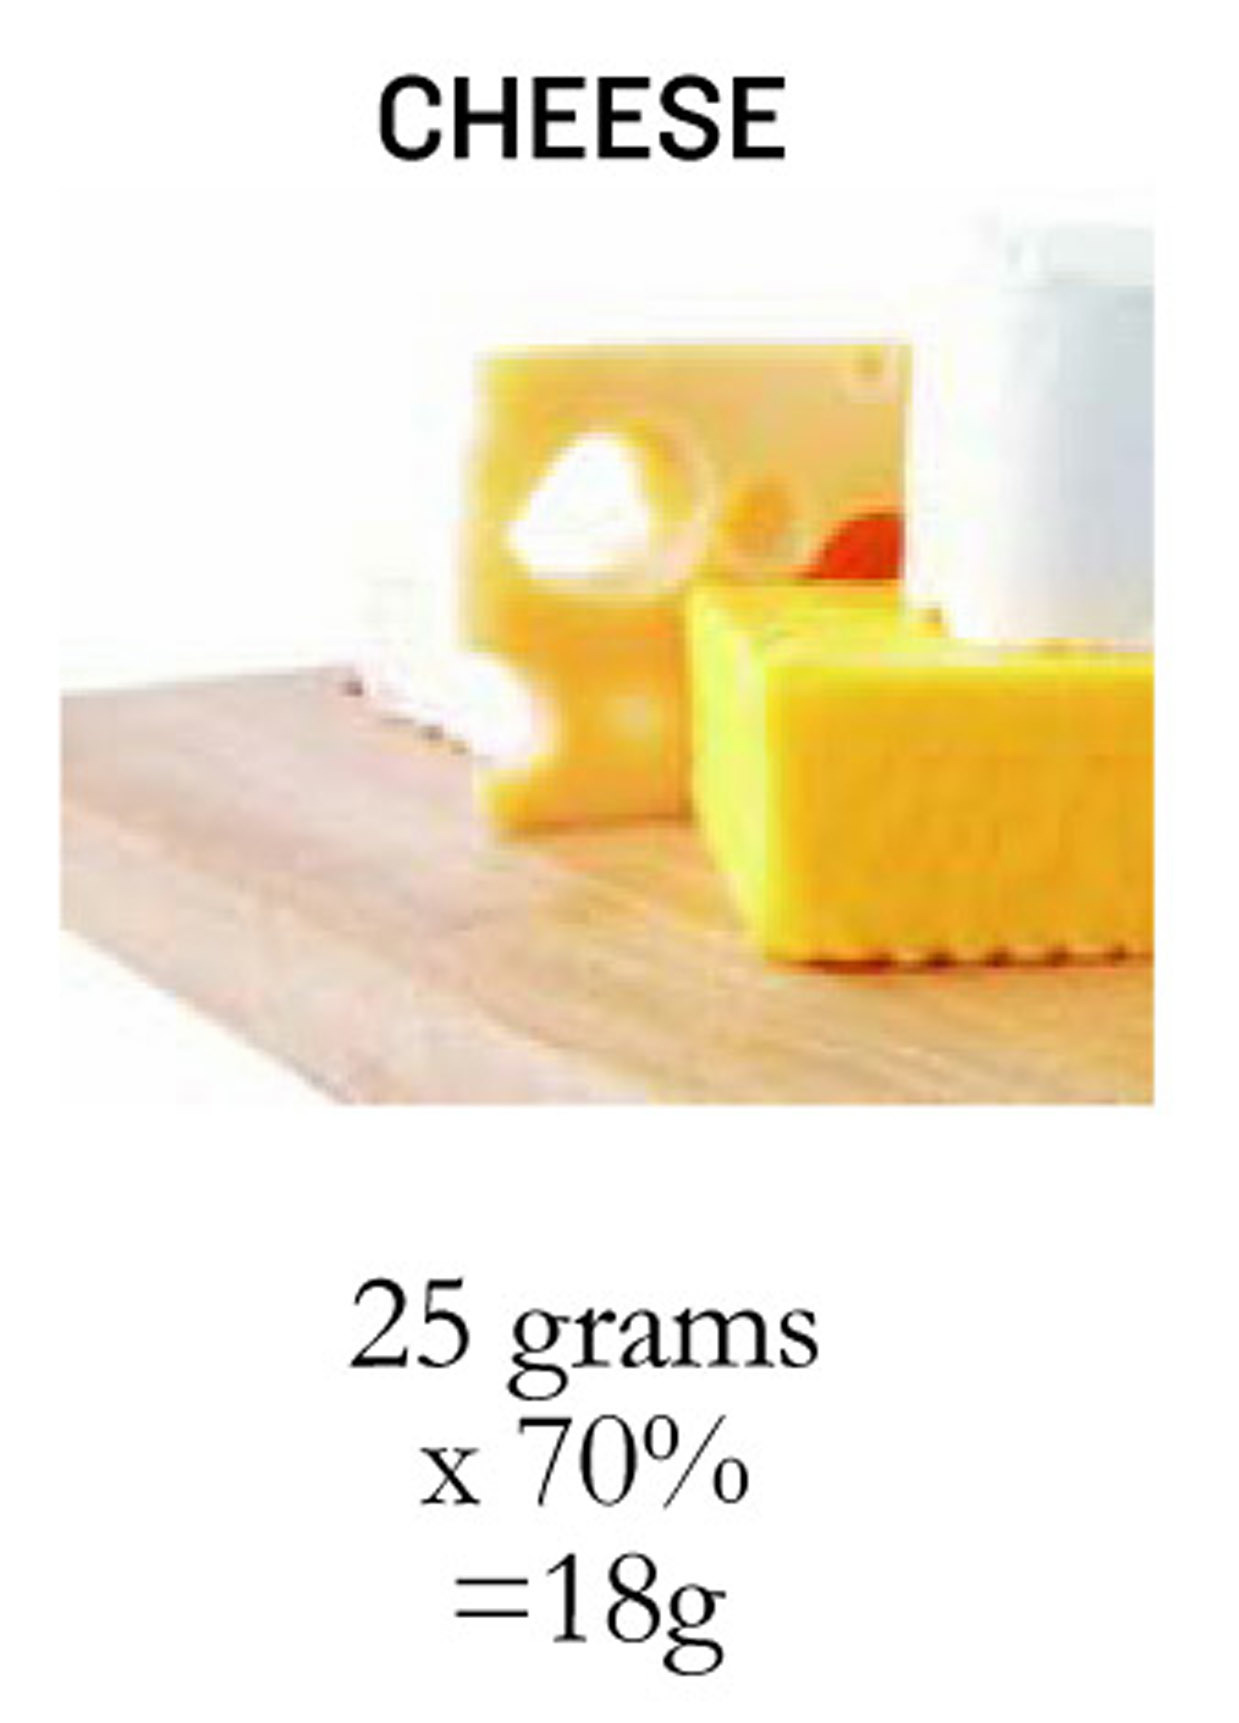
CHART7
|
AMINO ACIDS |
ISL. |
LEU |
LYS. |
MET. |
PHE. |
THR |
TRY. |
VAL. |
|---|---|---|---|---|---|---|---|---|
| EGGS 100g | 850 | 1126 | 819 | 600 | 739 | 637 | 211 | 950 |
| 60kg Adult | 720 | 960 | 720 | 842 | 960 | 480 | 180 | 840 |
| TUNA | 1481 | 2178 | 2556 | 401 | 1074 | 1249 | 290 | 1554 |
The RDI (Recommended Dietary Intake) for teenage boys and men is approx.65g of protein per day.
This refers to the Total Protein Value of a food, for example, for tuna 30g per 100g or eggs 13g per 100g.
TUNA – 30G PER 100G(TOTAL PROTEIN VALUE) X 80% NET PROTEIN UTILISATION=22G OF USEABLE PROTEIN
To obtain better protein value from a meal, combine the following foods to obtain an increased Net Protein Utilisation (add vegetables whenever possible):
Bread & Cheese. Rice & Corn. Legumes & Rice. Chicken & Rice. Eggs & Bread. Almonds with Brazil & Cashews. Tahini & Bread. Milk & Cereals. Fish & Rice.
NOTE: All amounts in this book are measured in milligrams (mg) per 100 grams, unless stated otherwise.
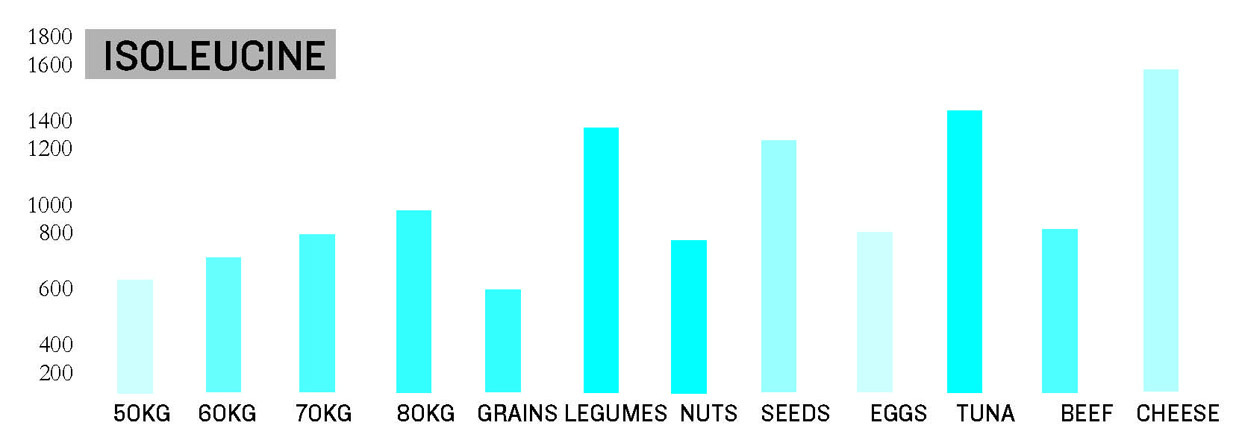
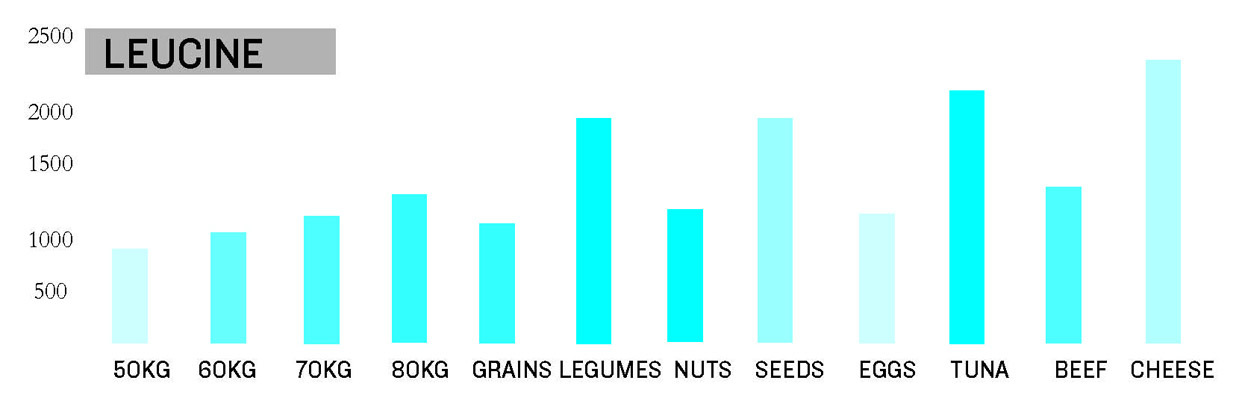
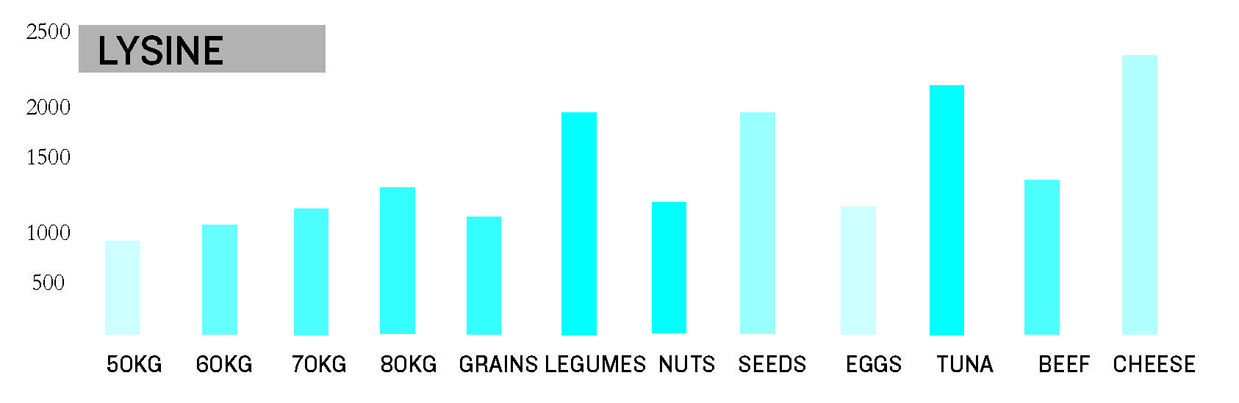
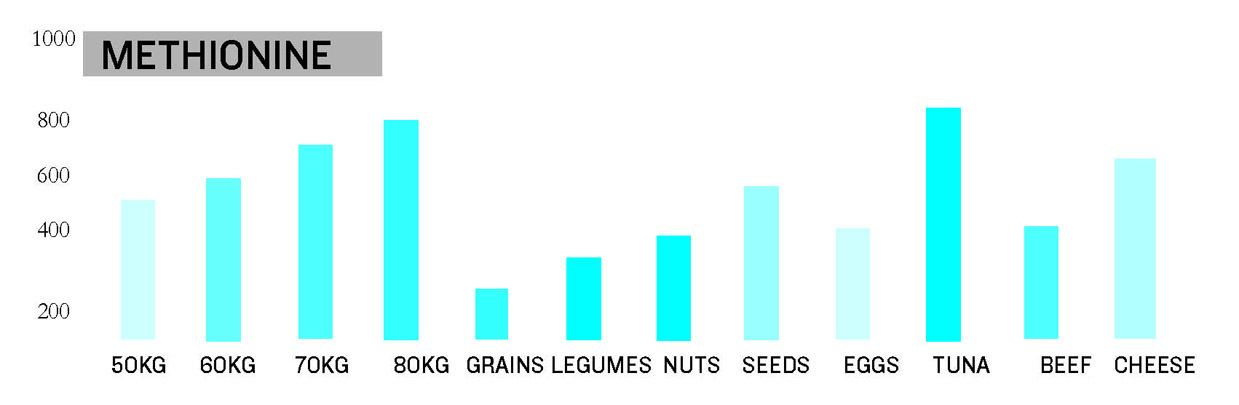
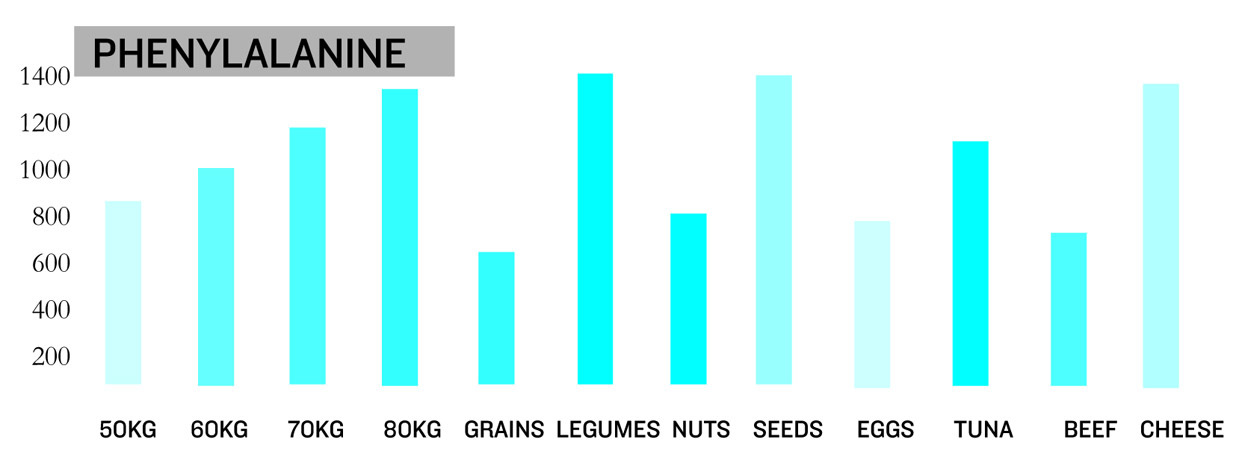
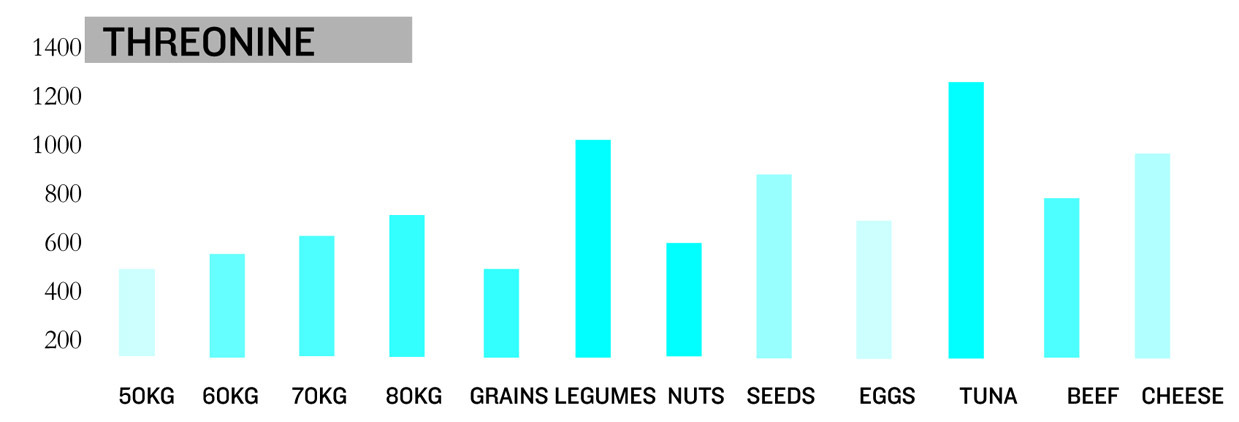
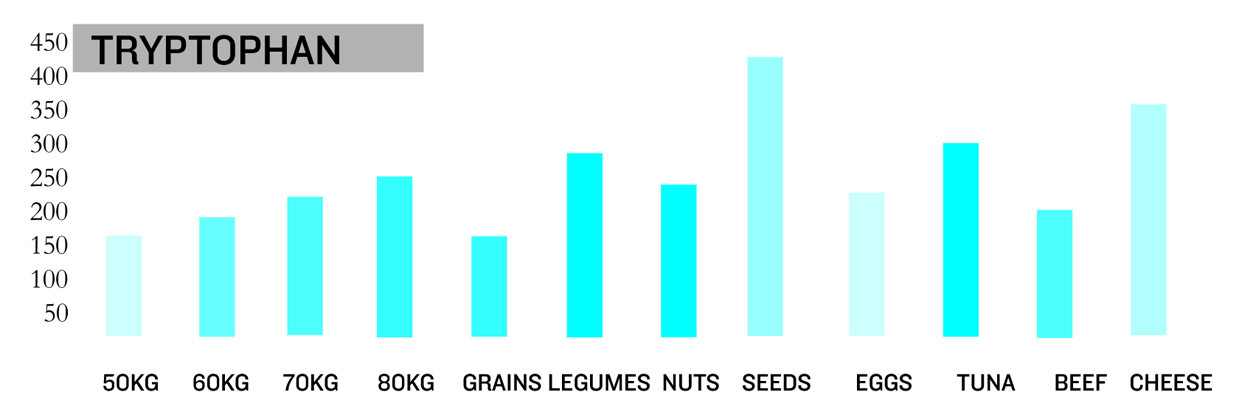
HOW MUCH PROTEIN DO FOODS CONTAIN?
Chart 8 below provides a detailed list of the individual amino acid content of the main protein foods, based on milligrams per 100g portions. It is clear that all the foods listed supply complete protein, as they contain the 8 essential amino acids. To obtain a well-balanced diet and good quality protein, include the whole grains, legumes, rice, fish, eggs, chicken, meat and cheese with vegetables regularly.
CHART 8
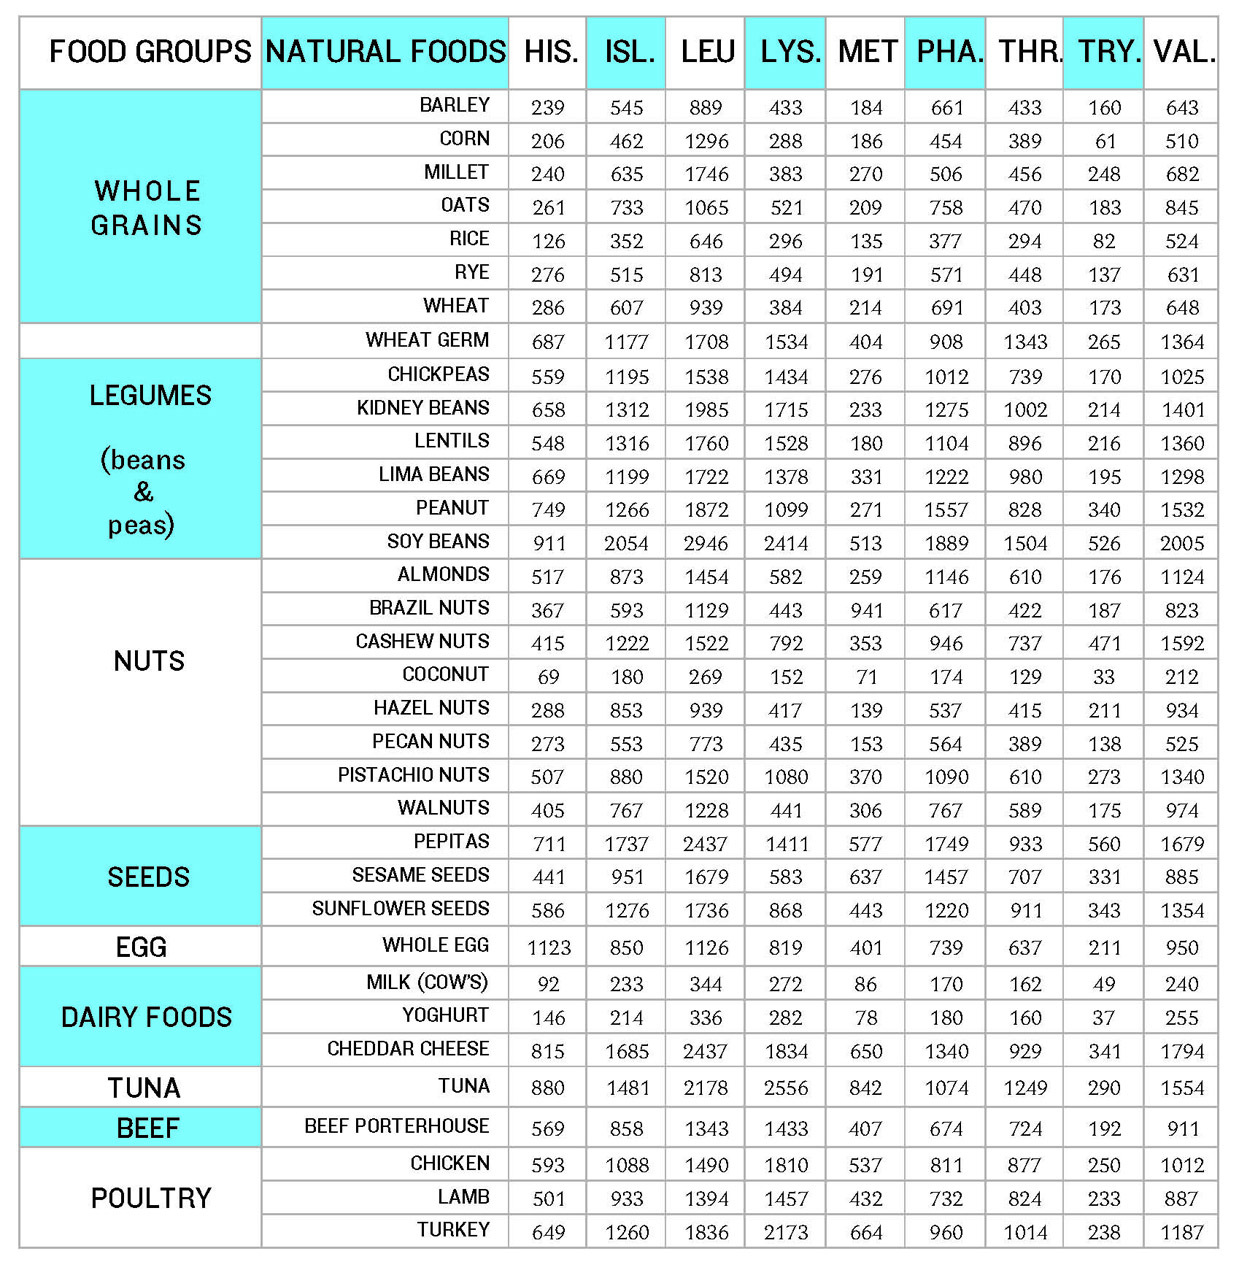
CHART 9
NOTE: All amounts in this book are measured in milligrams (mg) per 100 grams, unless stated otherwise.
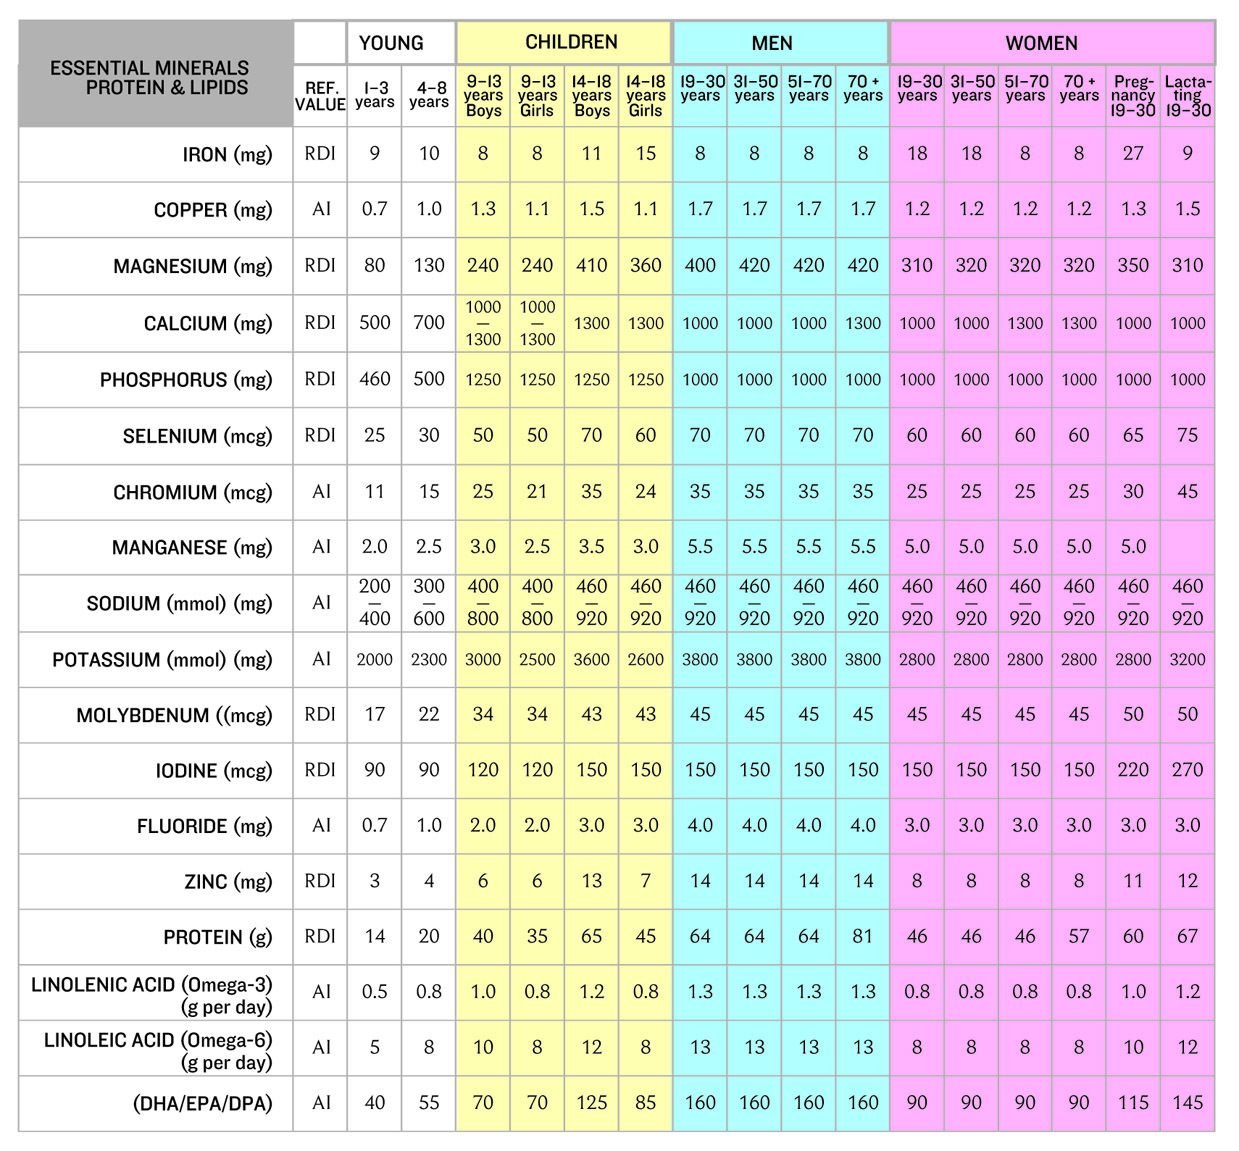
CHART 10

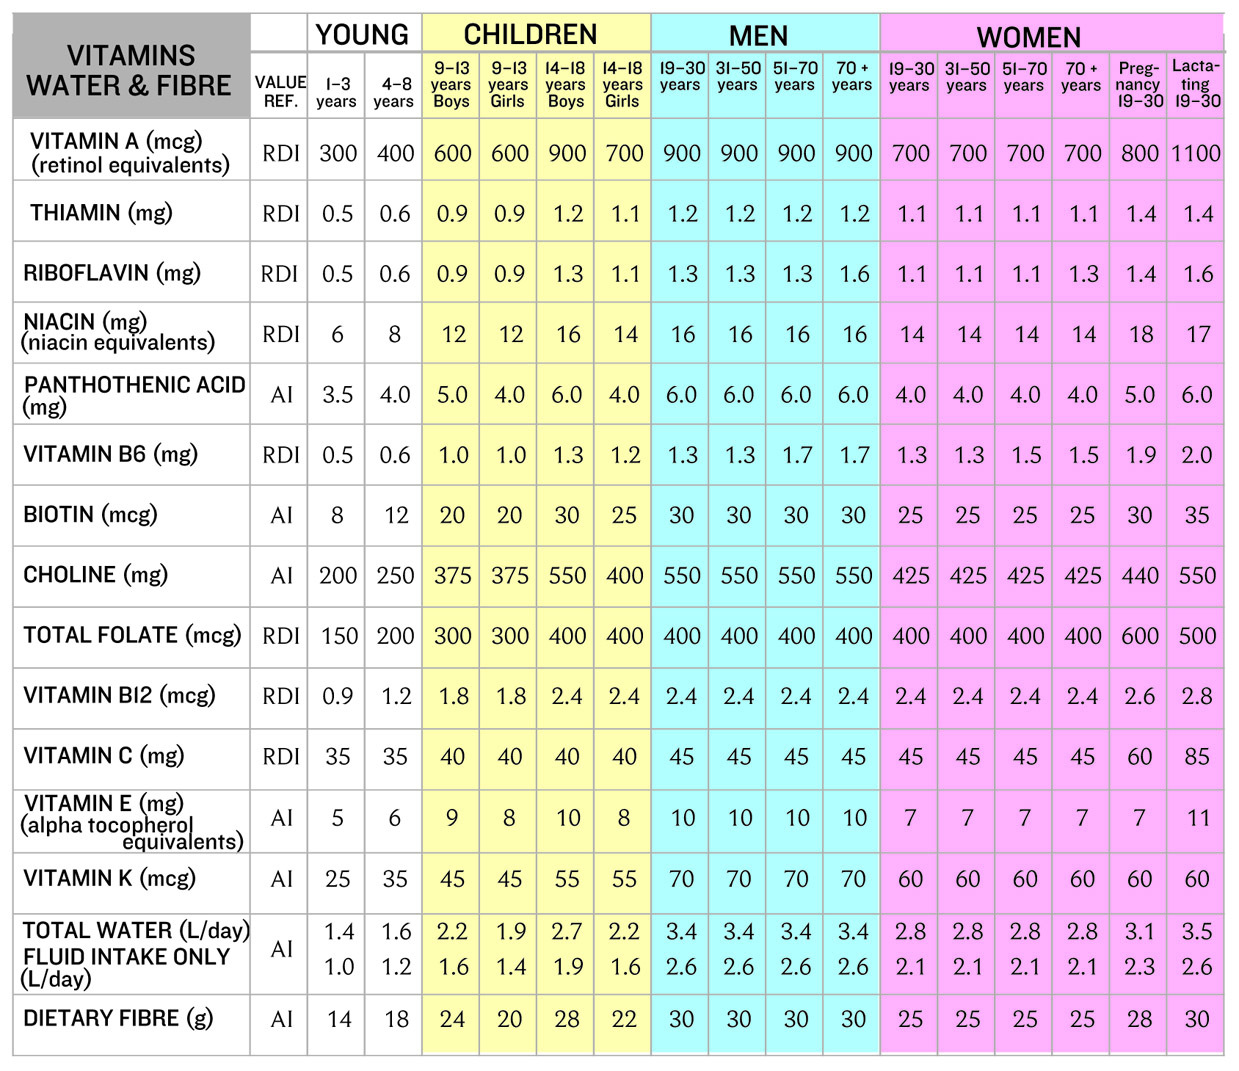
RECOMMENDED DIETARY INTAKE (RDI) CHART
The NHMRC (National Health and Medical Research Council) was commissioned in 2002 to manage the joint Australian/New Zealand RDI revision process. An expert Working Party was appointed to oversee the process with representation from both Australia and New Zealand, including end users from the clinical and public health nutrition research sector, the food industry, the dietetics profession, the food legislative sector and the Australian and New Zealand governments. The RDIs are the result of that review process.
CHART 11
NOTE: All amounts in this book are measured in milligrams (mg) per 100 grams, unless stated otherwise.
RECOMMENDED DIETARY INTAKE CHART
The RDI (Recommended Dietary Intake) was defined as: ‘the levels of intake of essential nutrients considered, in the judgement of the NHMRC, on the basis of available scientific knowledge, to be adequate to meet the known nutritional needs of practically all healthy people ... they incorporate generous factors to accommodate variations in absorption and metabolism. They therefore apply to group needs. RDIs exceed the actual nutrient requirements of practically all healthy persons and are not synonymous with requirements.’
The AI (Adequate Intake) is the average daily nutrient intake level based on observed or experimentally determined approximations or estimates of nutrient intake by a group (or groups) of apparently healthy people that are assumed to be adequate.
CHART 12