Curves
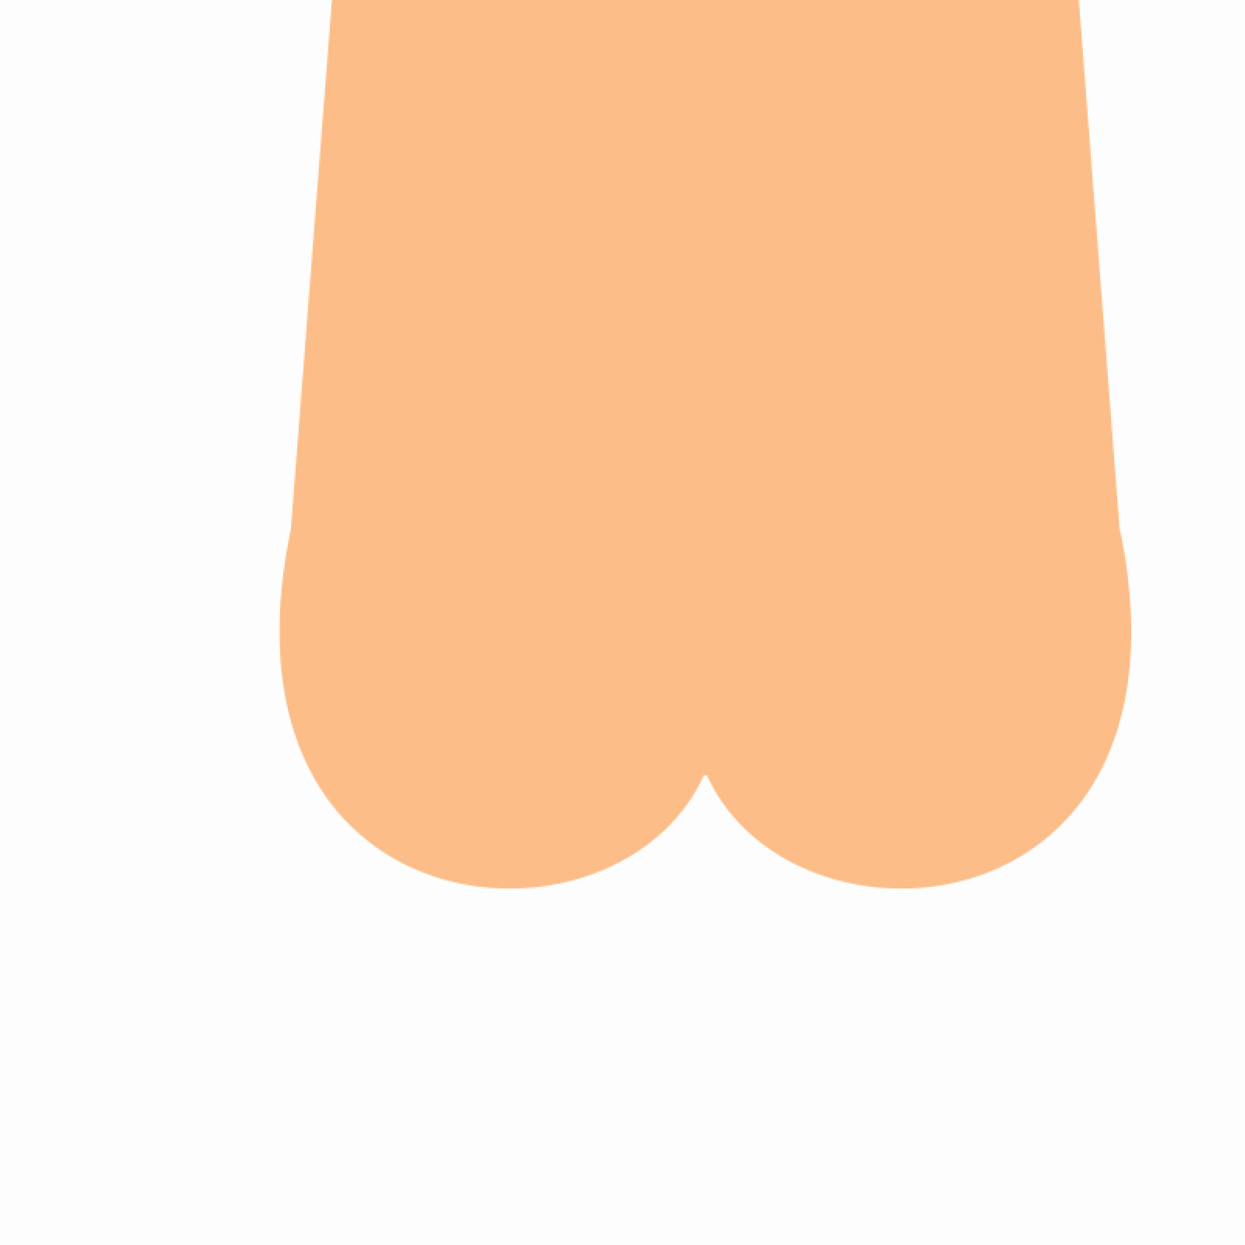
Write a program that uses arcs or Bézier curves to generate images of one or more butts.1
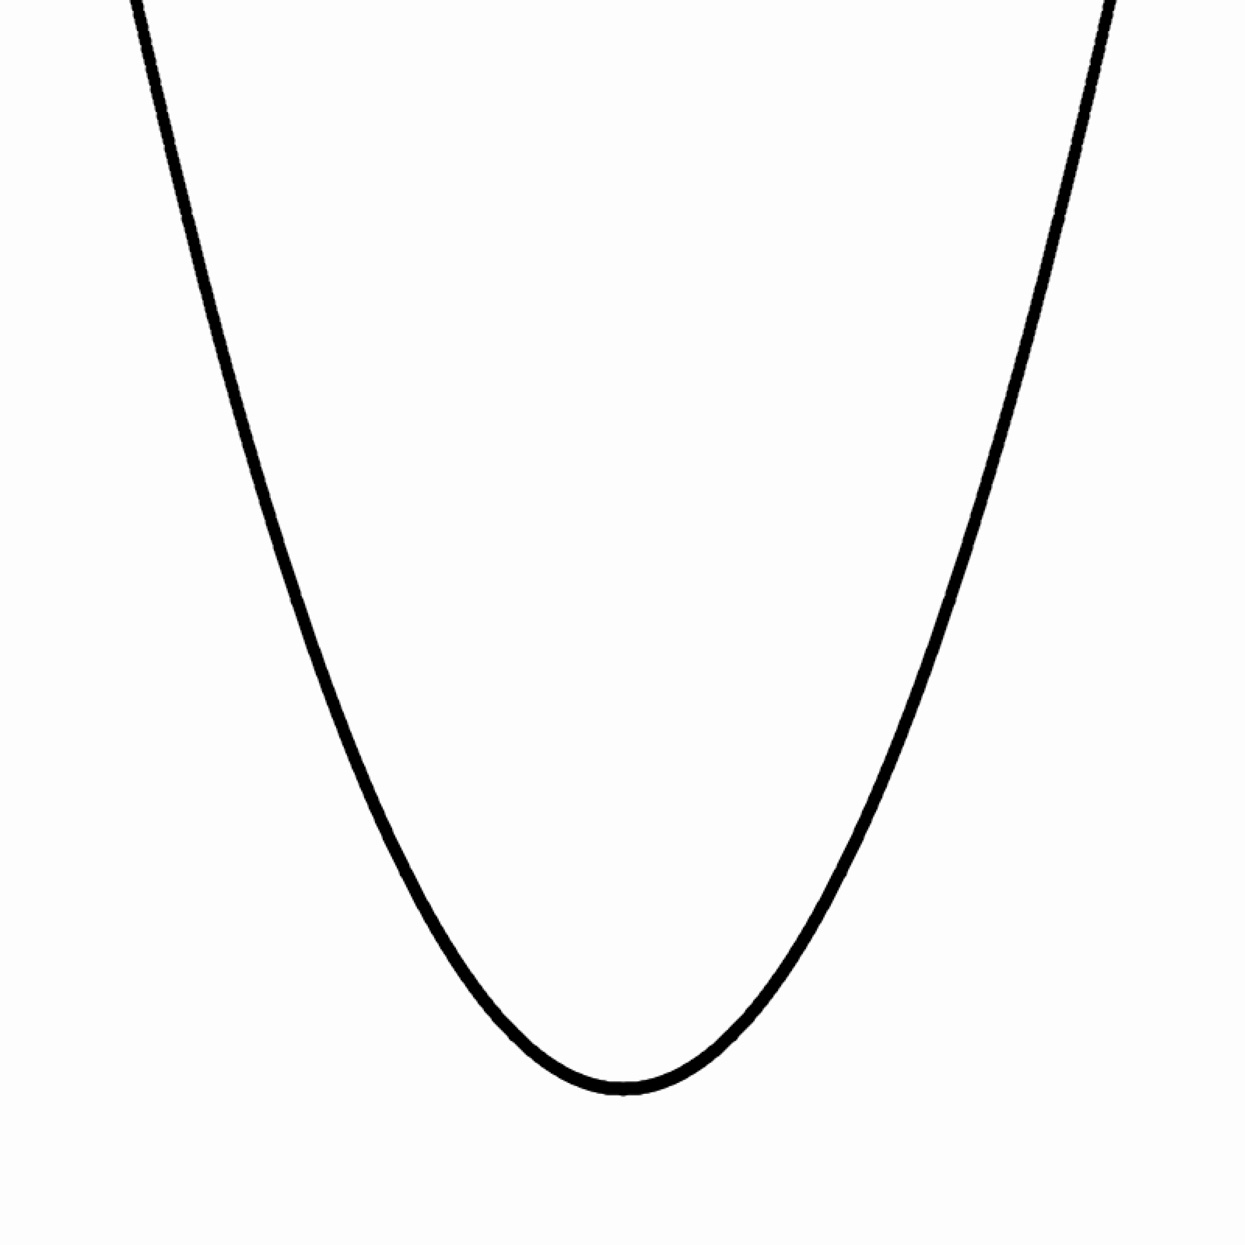
A parabola is a curve whose formula is y=ax<sup>2</sup>, where the variable a is some constant of your choice. Write a program that plots a parabola.
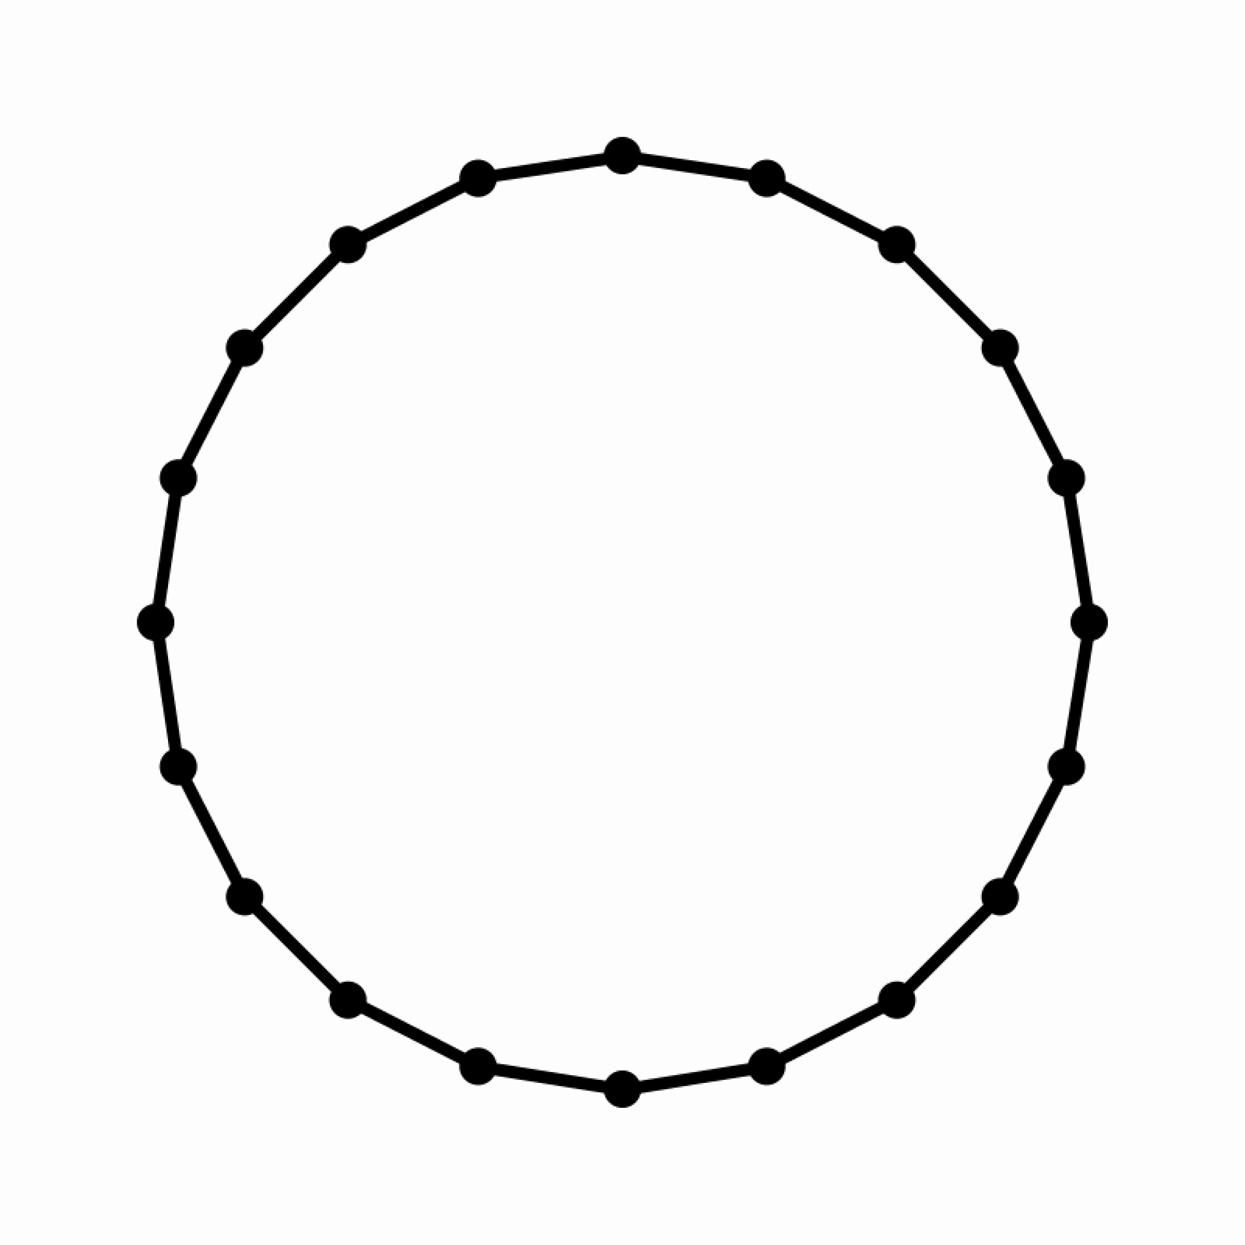
Plot a circle (from scratch) three different ways: use the trigonometric functions sin() and cos() to plot a series of points; approximate a circle with four Bézier curves; and construct a circle with “turtle graphics,” using a series of alternating forward steps and small rotations.2
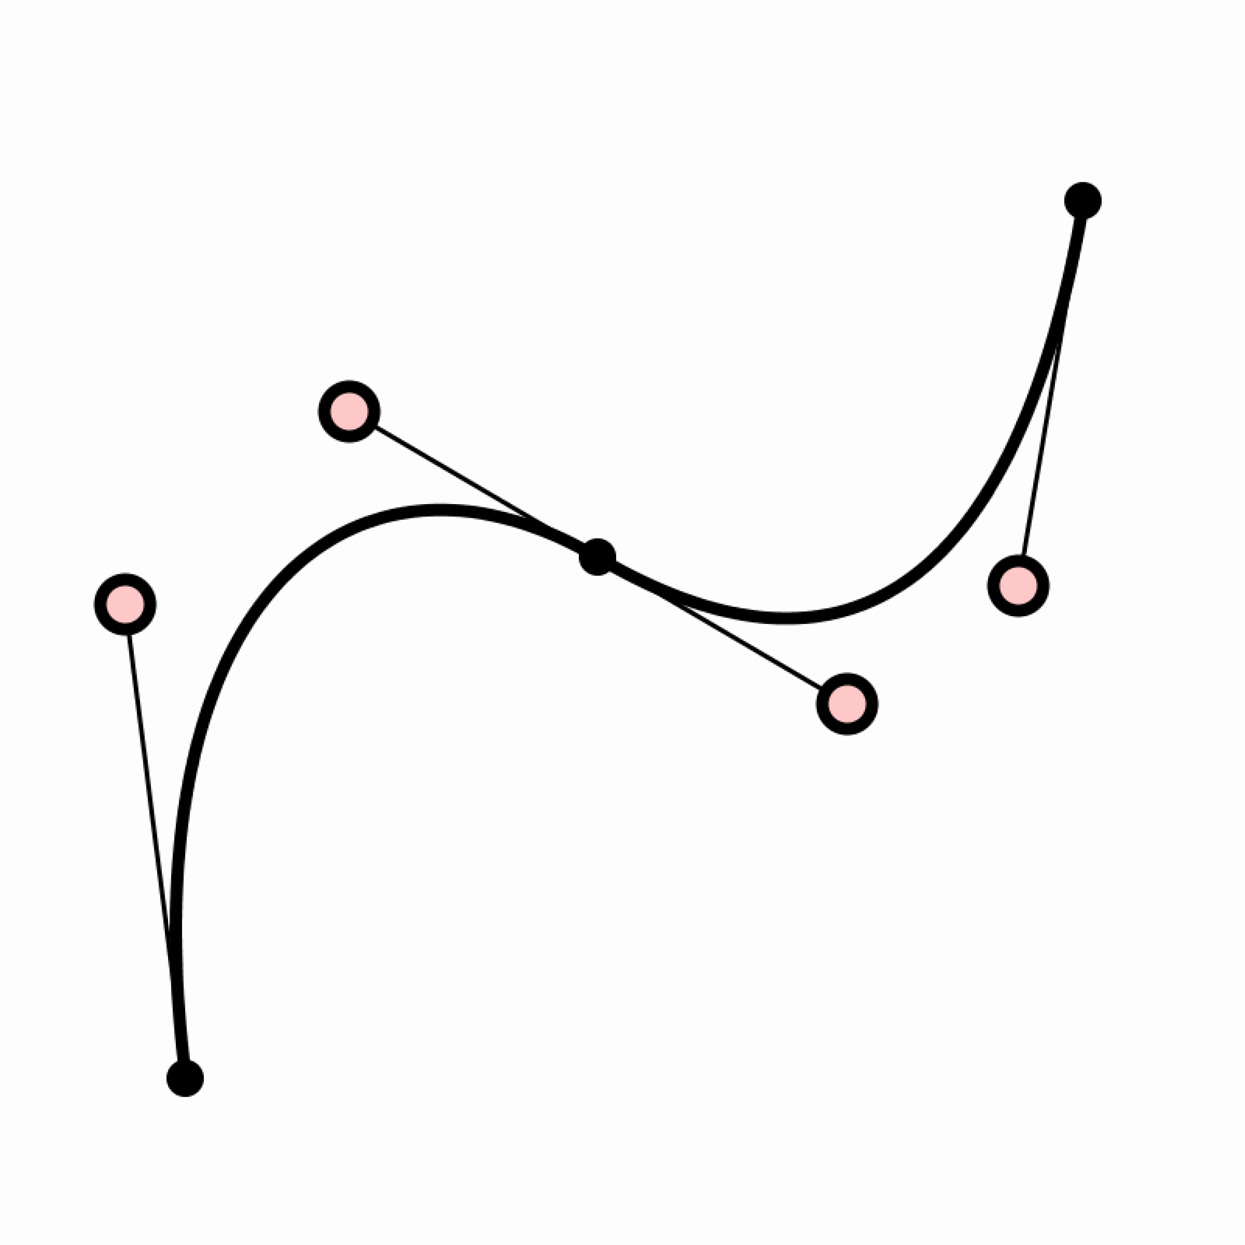
Create a curve by joining two Bézier curves. Now ensure that the combined curve is “C2 continuous,” with no visual discontinuities at the point where its components are joined. In other words, there should be continuity of position, tangent slope, and curvature.
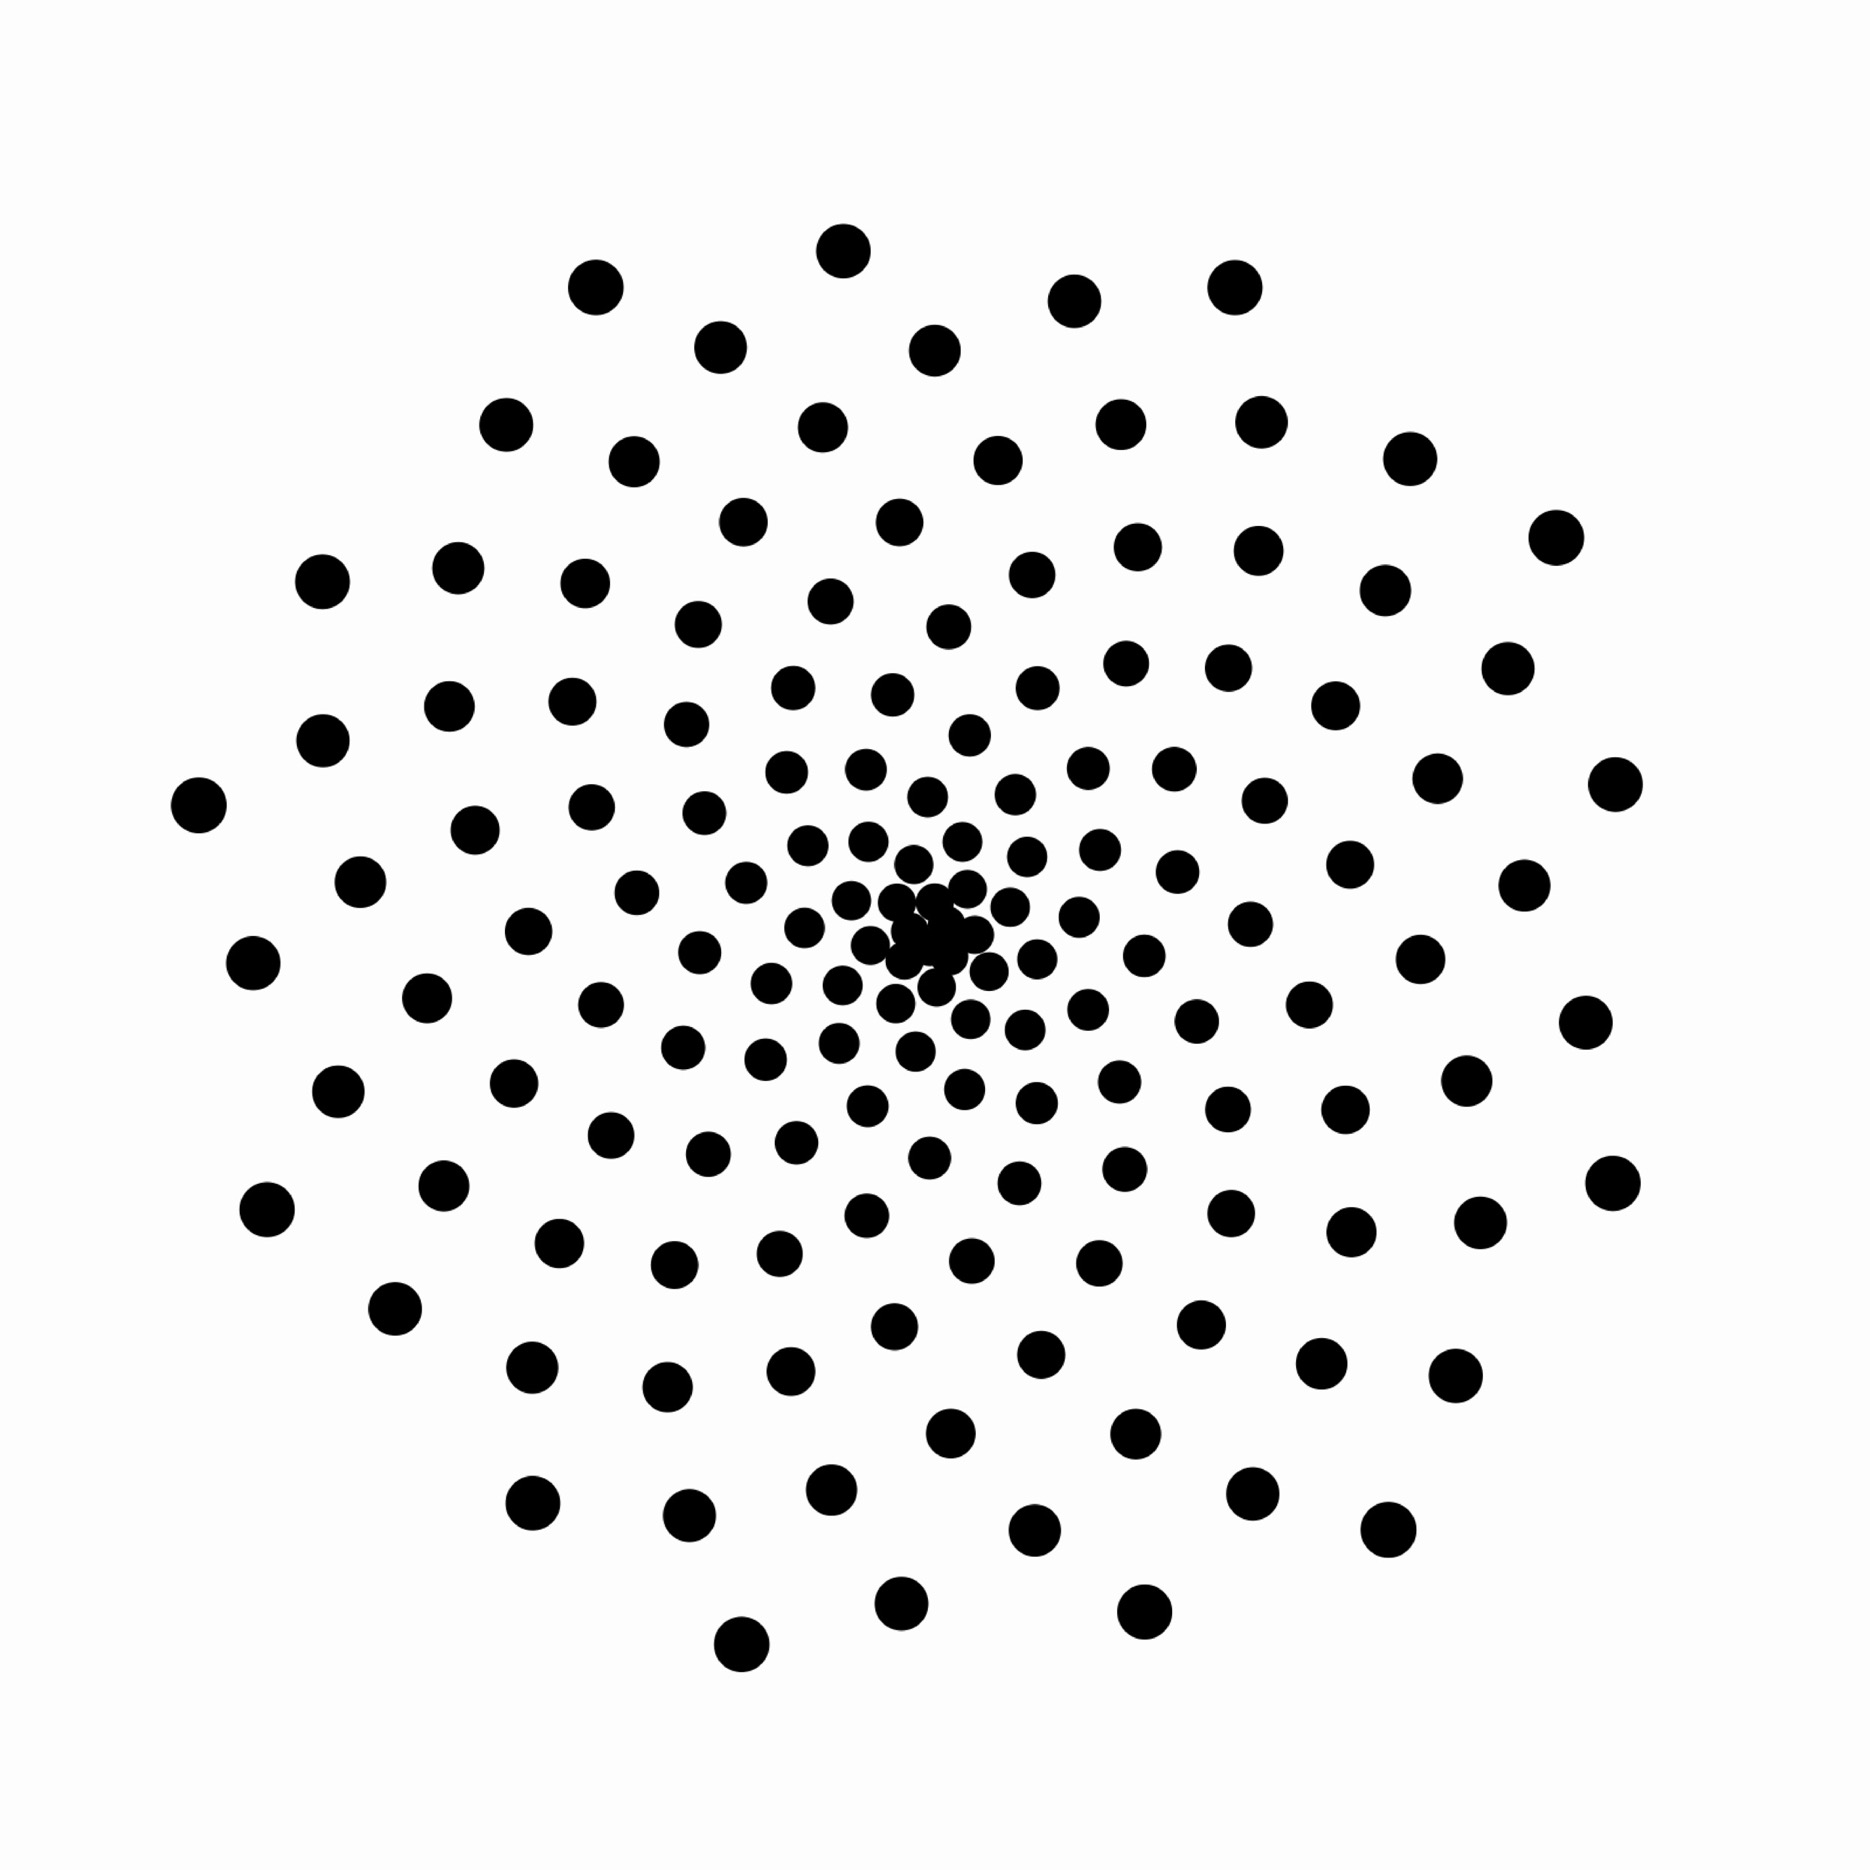
Use turtle graphics to generate a phyllotactic spiral.3 Start your turtle at the center of the canvas. At each step, your turtle should draw a small element; move outwards by a slowly increasing amount; and rotate its orientation by the “Golden Angle,” ~137.507764°.
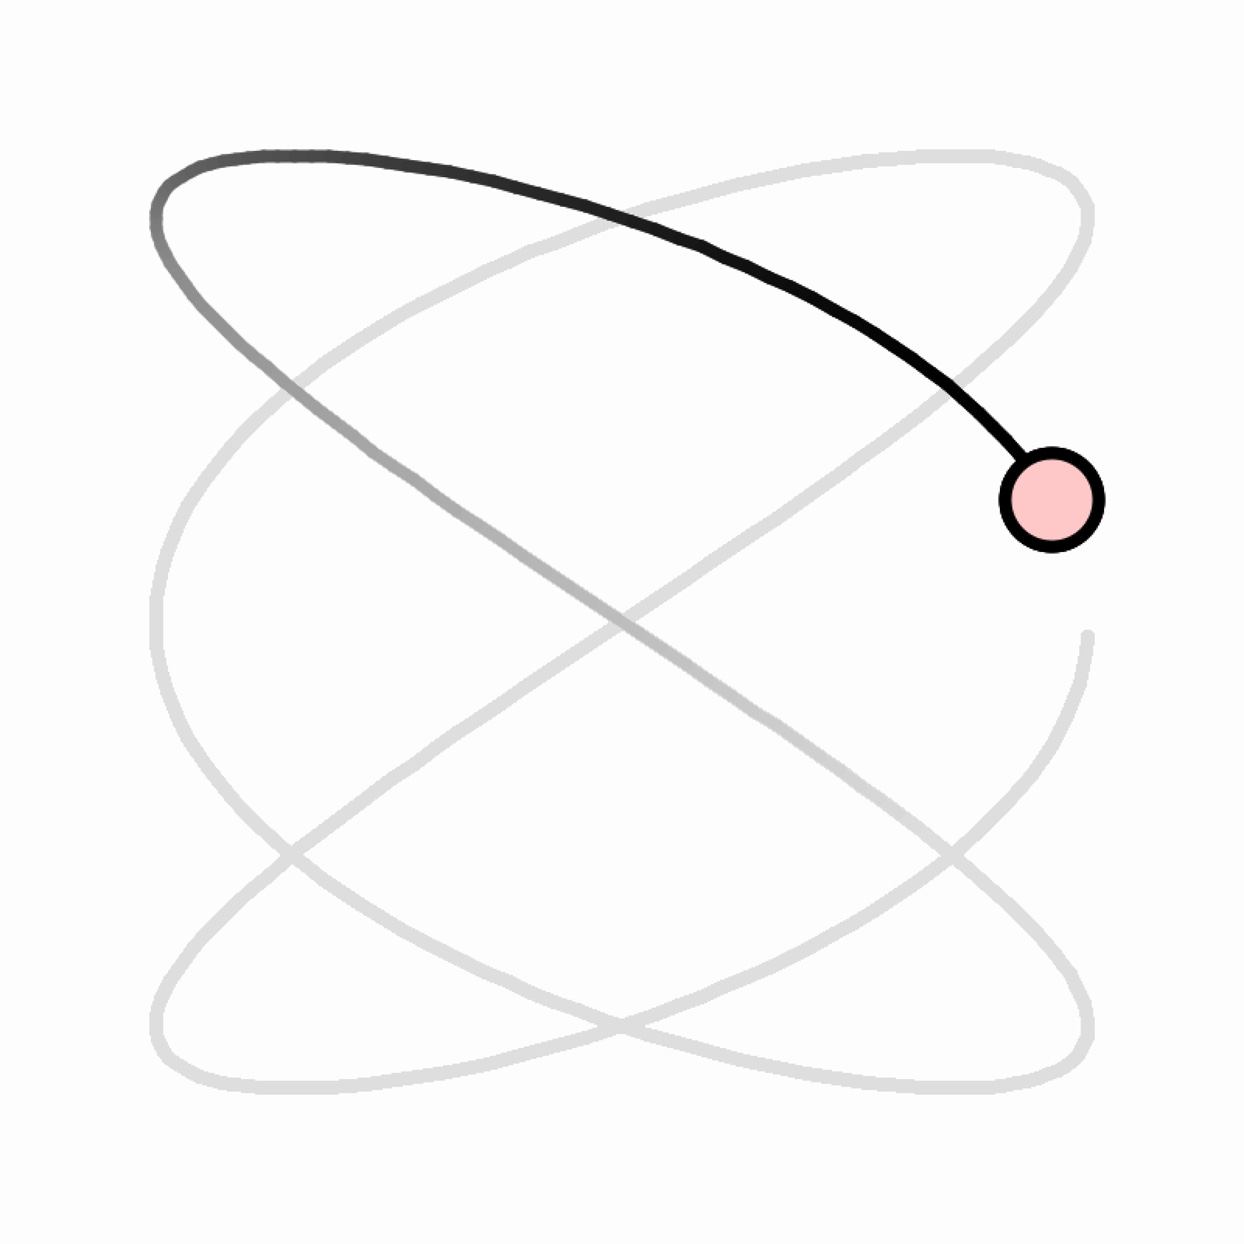
Lissajous curves are useful parametric functions of the form x=cos(a*t); y=sin(b*t);, where a and b are typically small whole numbers. Use the mathematics of Lissajous curves to plot the movements of an animated element.
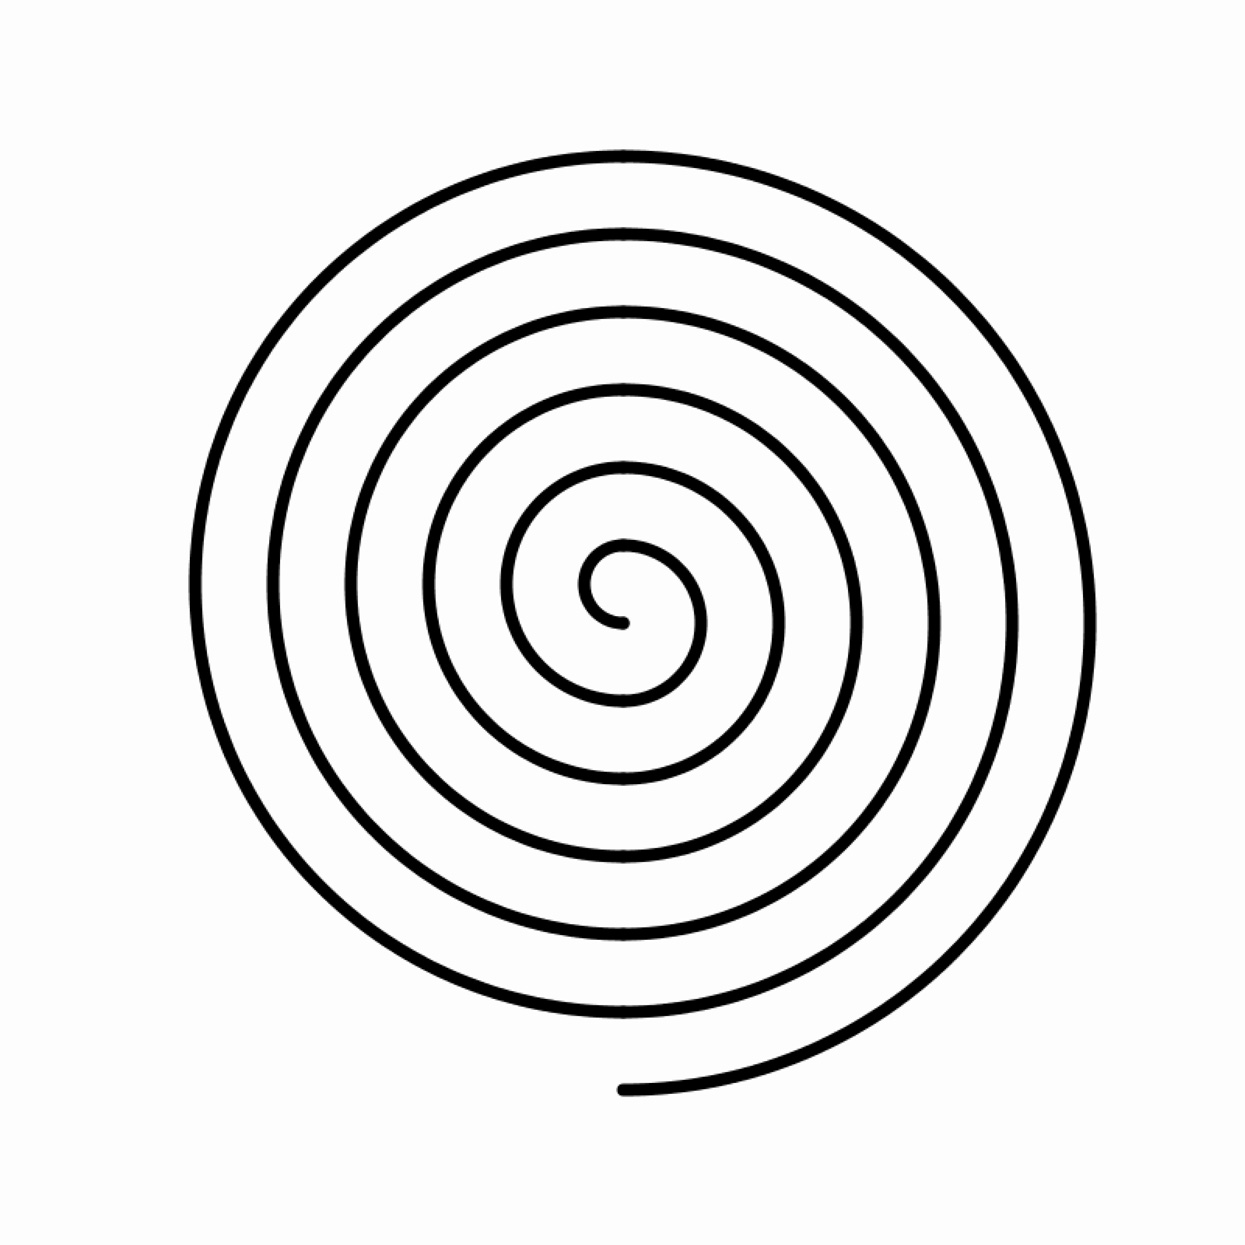
Write a program that draws a spiral. Before you begin, research different types of spirals, such as Archimedes's spiral (the radius of which grows arithmetically) and the logarithmic or equiangular spiral (whose radius grows geometrically). Consider different implementations, such as explicitly plotting your spiral using polar equations, implicitly rendering it by summing small differences (e.g., go forward, turn slightly, repeat), or approximating it piecewise with circular arcs.
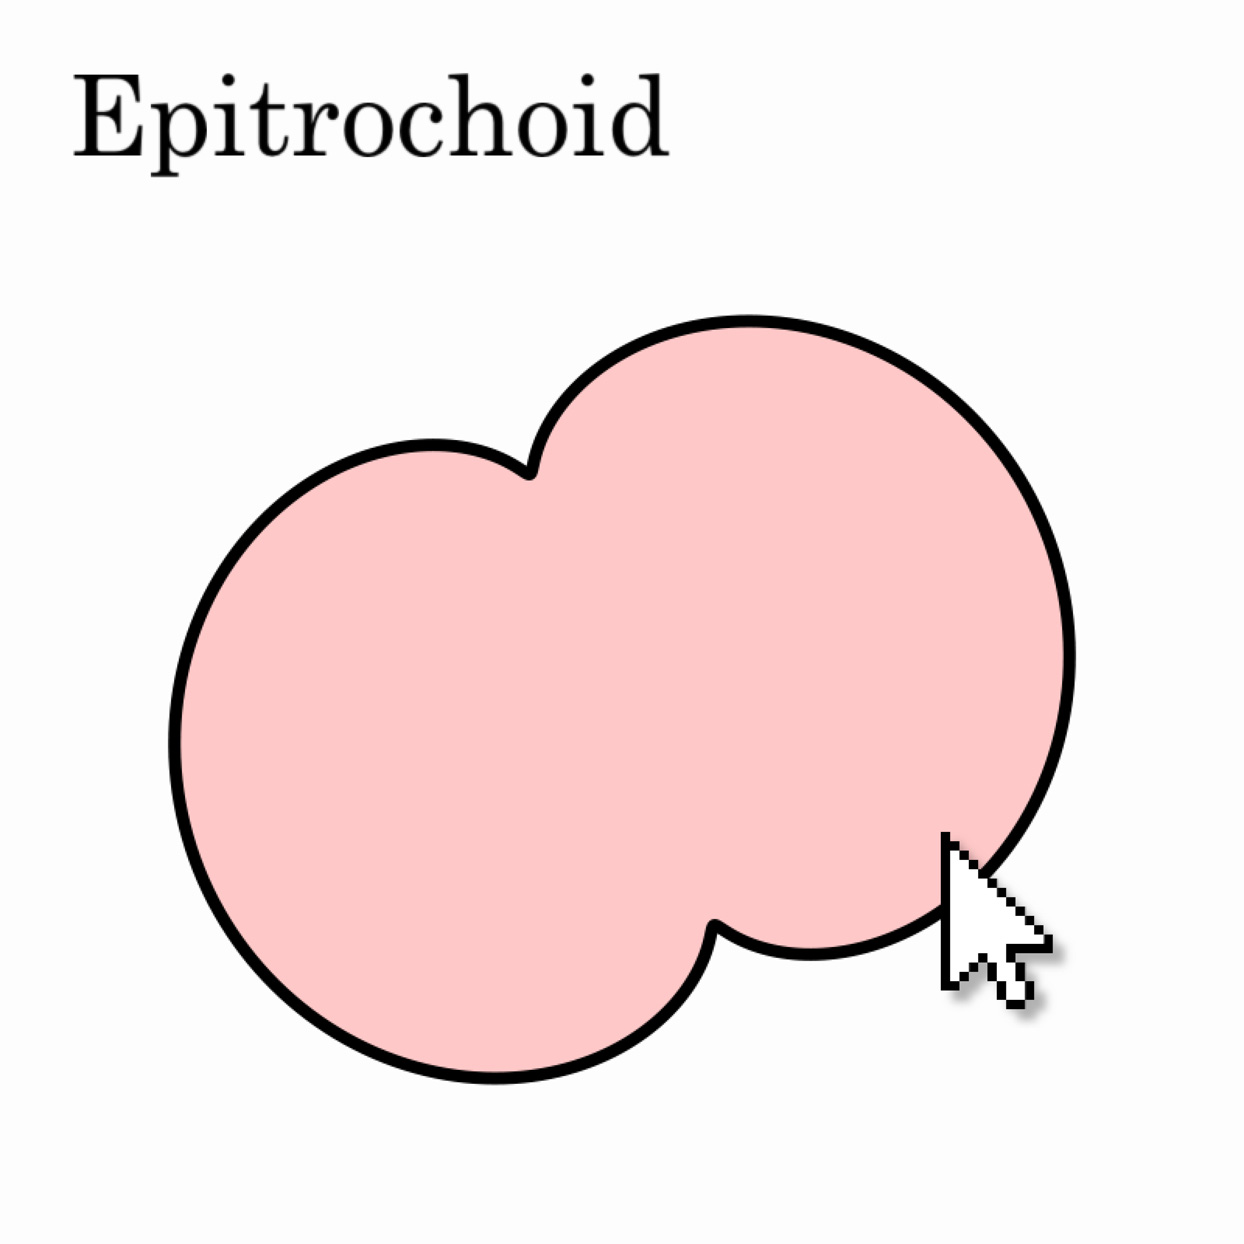
Write a program to display a cardioid, epicycloid, hippopede, or other polar curve4 whose equation takes the form r = f(theta). The identities x=rcos(theta) and y=rsin(theta) may be helpful. Use the cursor to control parameters of the curve in real time.
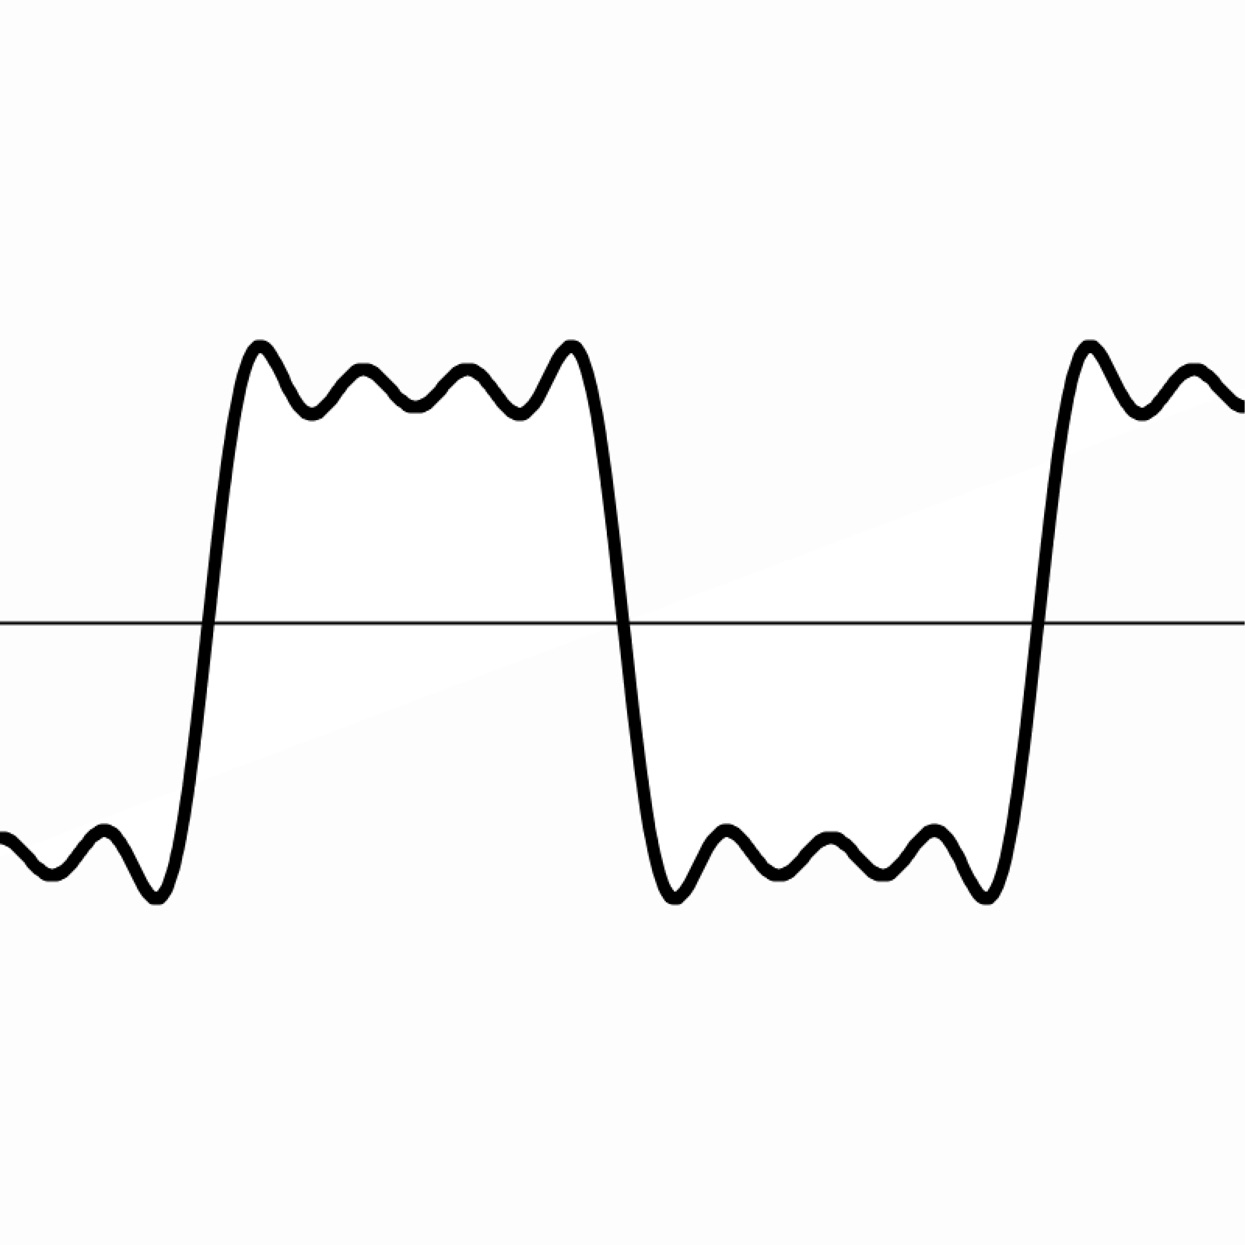
In Fourier synthesis, complex waveforms are made by summing up sine waves of different amplitudes and frequencies. For example, a square wave can be approximated by the sum: sin(x)+sin(3x)/3+sin(5x)/5+sin(7x)/7…. Generate a square wave with this technique.
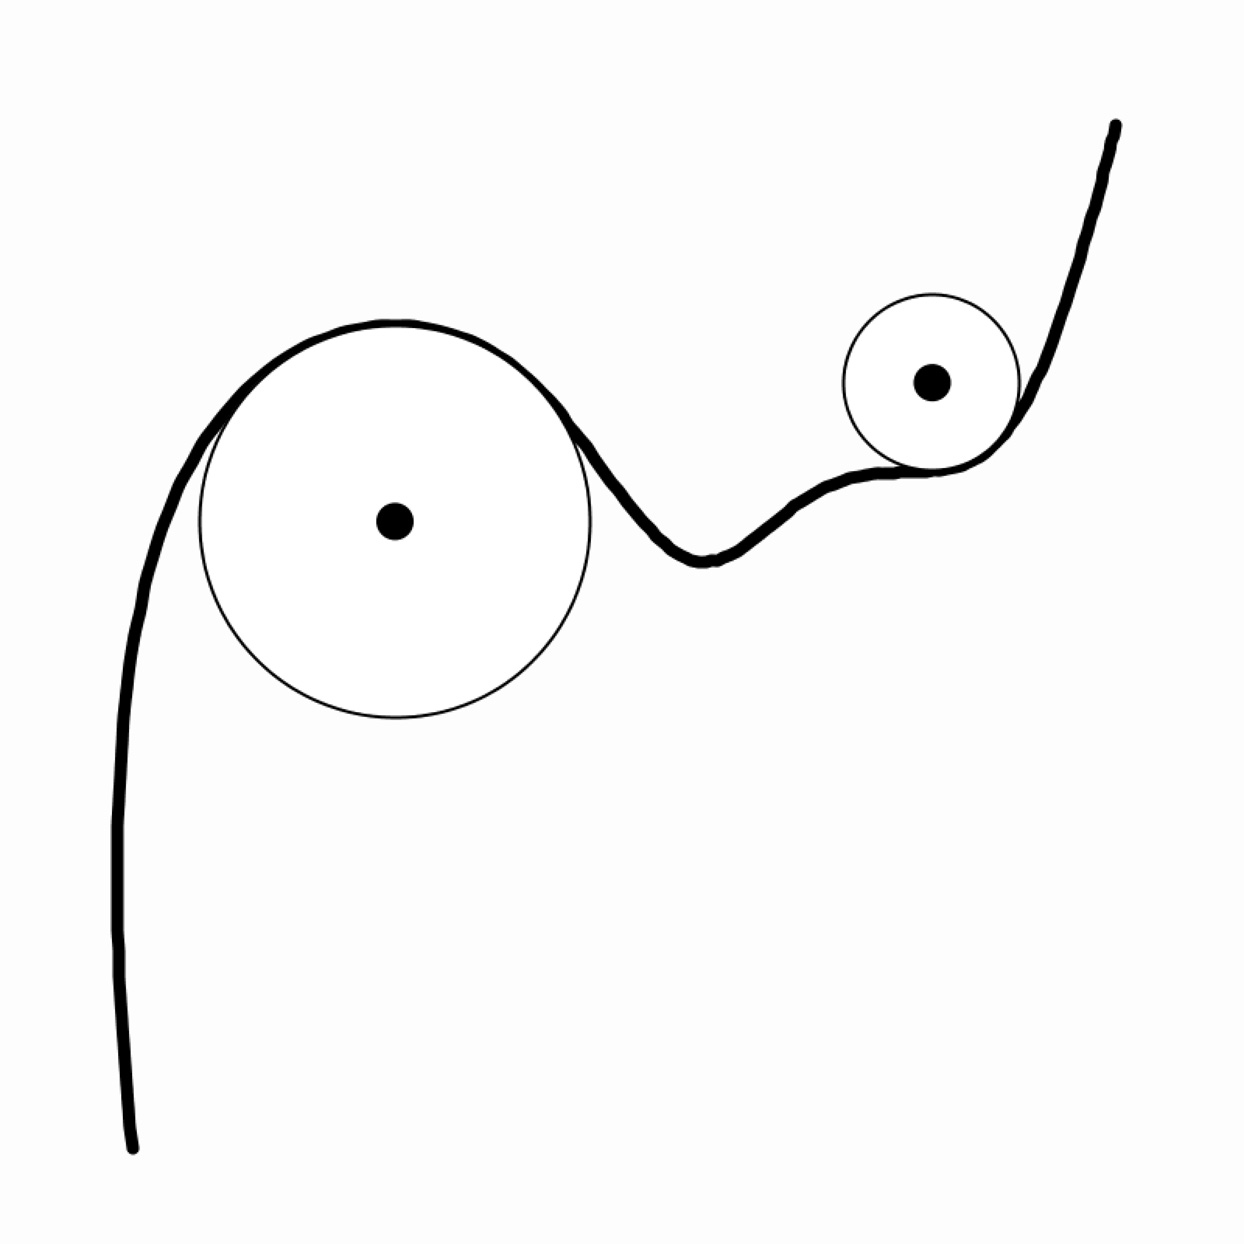
Every point on a curve has a local radius of curvature: the radius of the osculating circle that best approximates the curve at that point. Write a program that displays the osculating circle for points along a mark drawn by the user. You can approximate this by computing a circle from three consecutive points along the mark.
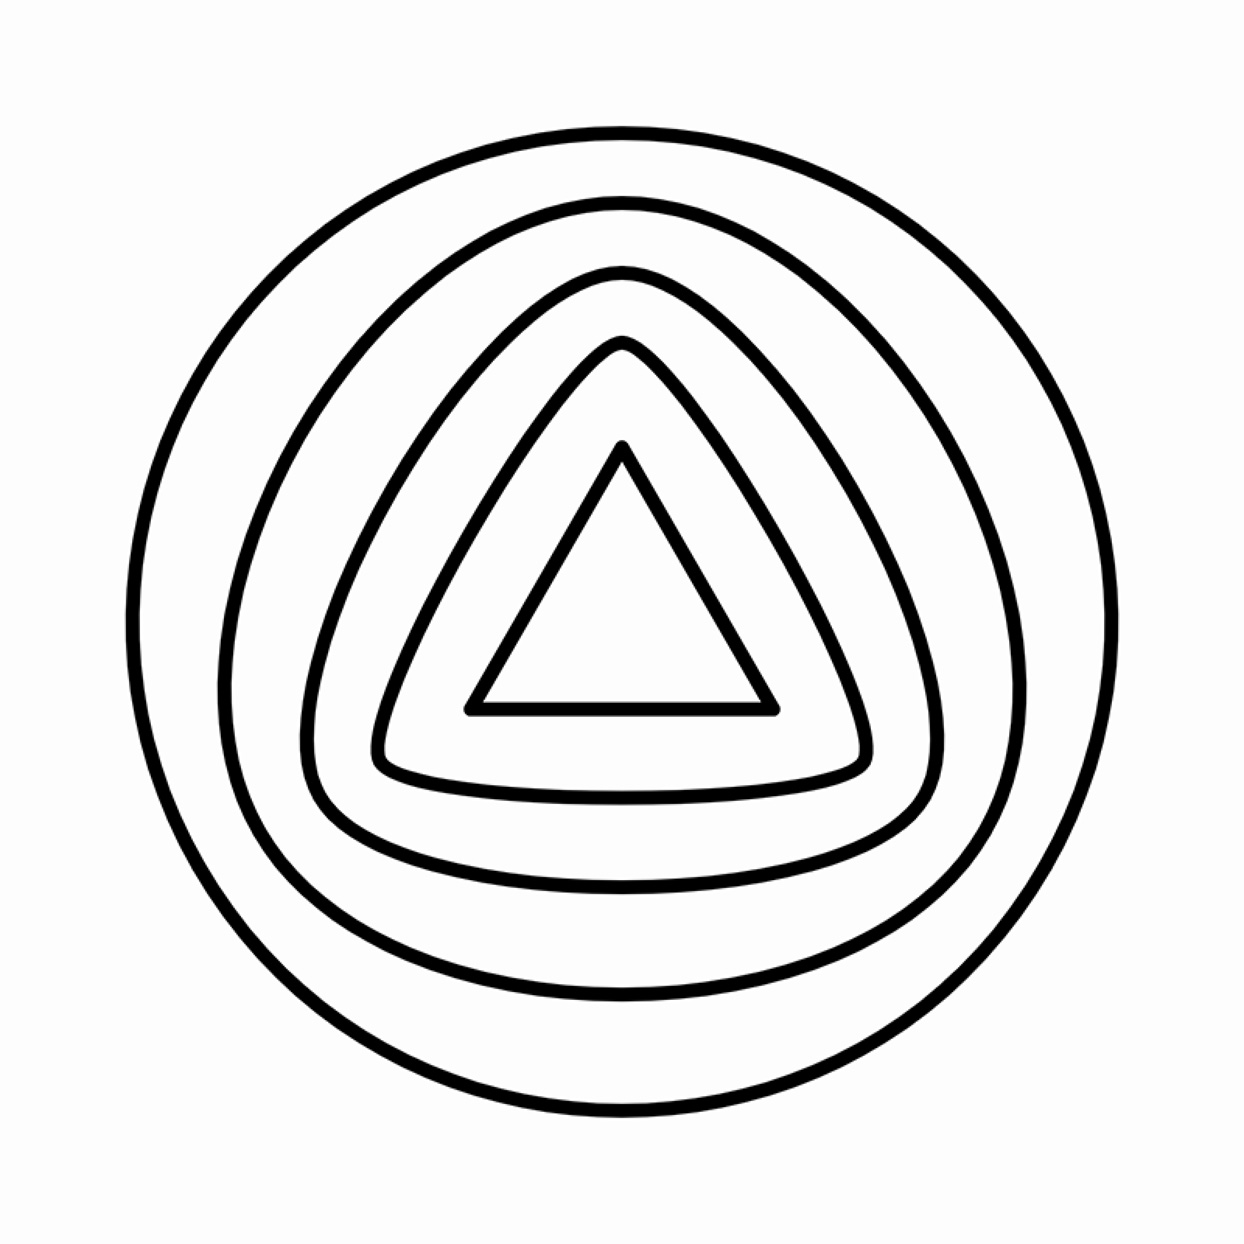
Create a program that interpolates between a circle and a triangle.5
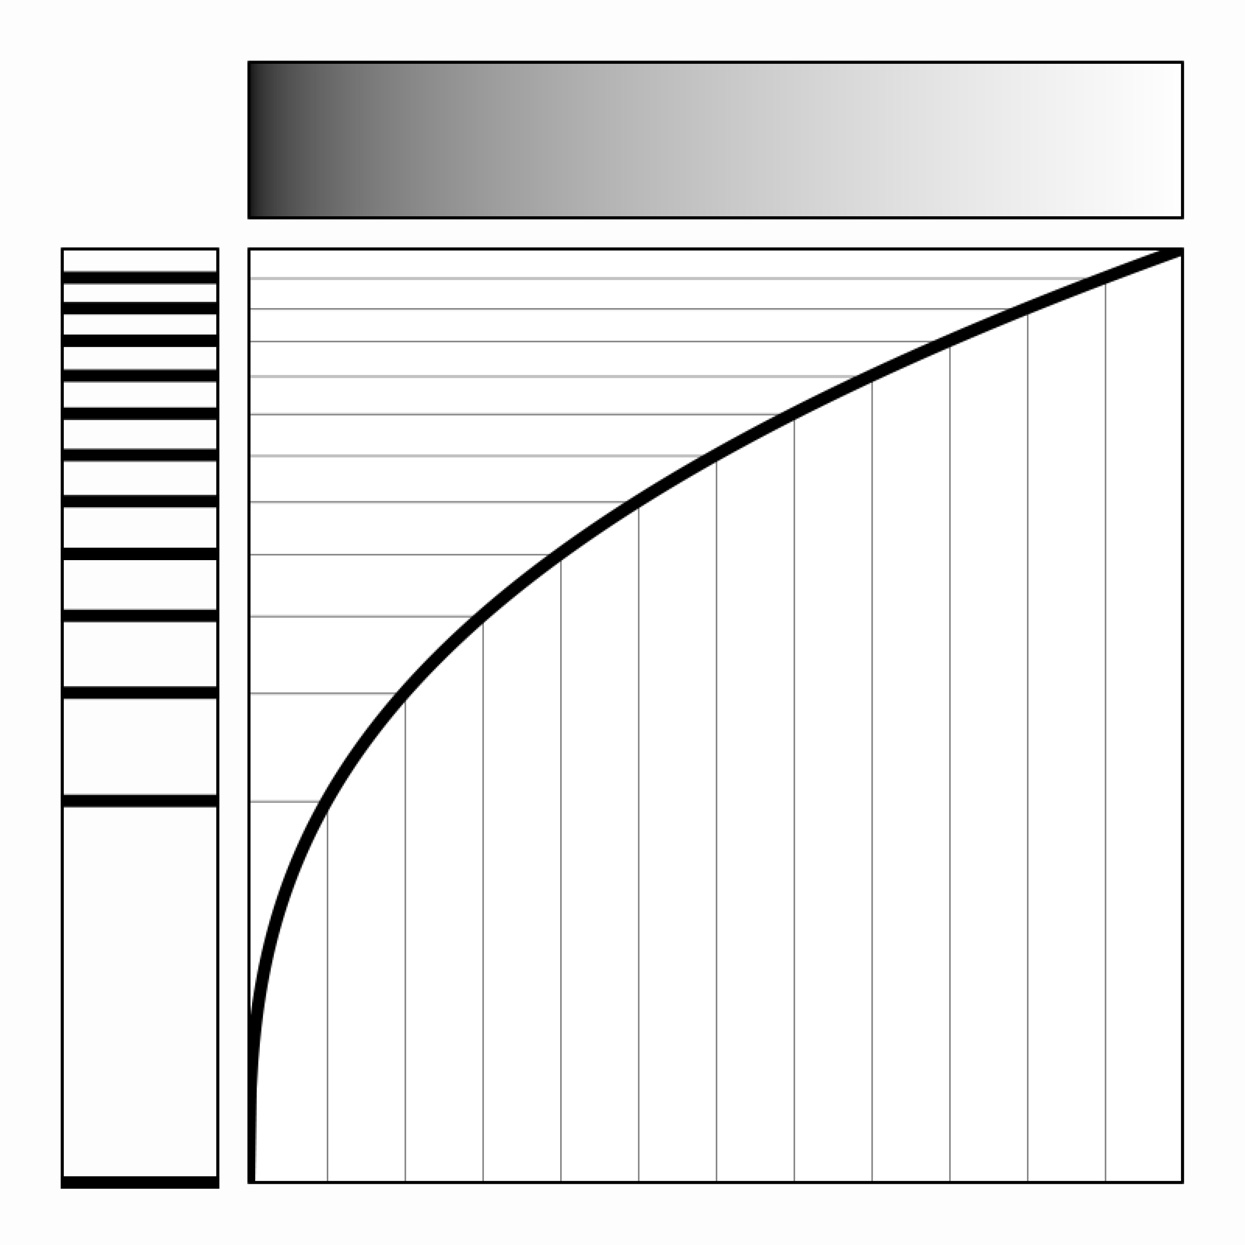
“Shaping functions” are indispensable in generating and altering signals for aesthetic purposes. Also known as tweens, interpolation curves, bias functions, easing curves, or unit generators, these functions are typically designed to receive and produce values between 0 and 1. Use a collection of shaping functions (such as p5.func by Luke DuBois, or Robert Penner's Easing Functions) to create nonlinear relationships between time and position (to make animations) or between position and color (to make interesting gradients).6