Chapter 23
The Body of Evidence Supporting the Call for Prosocial Education
Michael W. Corrigan
For more than a century now in the United States and abroad, educators, psychologists, philosophers, and researchers from many other disciplines have produced a body of evidence that quantitatively and qualitatively informs us as to what has worked and not worked in education. As this handbook has shared, a respectable portion of this body of evidence on what works in education is supportive of the present-day benefits of practicing prosocial education and its historical roots in the American education system. As the chapters and case studies in this handbook have documented, since our education system began, prosocial educators and education researchers have admirably been exploring the best ways to help our youth learn better while simultaneously developing into not only good students but good people—productive citizens. This is the dualistic goal of prosocial education. As the research shows, prosocial education has served as a critically important complement supporting the academic side of the educational coin. During the past few decades, however, the United States has been moving away from using prosocial education research and practice to inform and guide the totality of educational improvement efforts and turning progressively toward standards and accountability systems to determine how to best measure the effectiveness of our curricula.
In other words, within a few decades, we have moved our main research and practice focus away from informing what we do as educators and how best to help our students learn content material and develop into model citizens, to a focus or policy centered more specifically on how well our students score on standardized tests. As a result, many educators have been forced to change from a data-driven focus of applicability (how to use rubrics, test scores, and other data to improve our practice) to accountability (how to use rubrics, test scores, and other data to document the effectiveness of our practice). This would be fine if our existing practice was actually producing effective results, but as the body of evidence to be shared here documents, this is not the case.
It would appear our policy makers continue to ignore a large body of evidence highlighting the prosocial-based approaches or practices most beneficial to academic success. They continue to ignore a large body of evidence showing how social-based variables (e.g., socioeconomic status [SES], parent involvement, motivation to learn) can account for a large part of the discrepancies or variances in student tests scores. And at the same time they continue to ignore the fact that the accountability high-stakes testing approach we are taking is not producing higher test scores but in the process is dismantling what was once the model of education that many countries have strived to become. As this chapter will explain, the testing obsession in itself is one of the biggest threats to improving what we do in education and serves as an indicator that our nation’s current approach to improving education is shortsighted to say the least.
Ask any honest educator behind closed doors, and they will tell you that we now focus almost entirely on the input of standards-based curriculum and the output of test scores. Such a focus is so time consuming that many are now ignoring a large majority of the variables conducive to the learning process as well as the input, process, and formative data we could realistically be using to truly educate ourselves on what needs to be done to actually help test scores rise. Instead of focusing on how best to improve our schools, we now focus on how best to improve our scores. If the last few decades of minimal gains in proficiency have taught us anything, these two foci of improvement cannot be approached separately. As the chapters and case studies in this handbook have illustrated, your challenges will be far greater if you only focus on improving test scores and ignore efforts to help students improve developmentally, socially, behaviorally, ethically, and emotionally. Instead of using higher standards of evaluation and a system of accountability to fix what aspects of our education need more support and provide change we can believe in, we have developed a case of tunnel vision that has blurred the insight of far too many policy makers and lawmakers, and tied the hands of an even larger number of educators.
Unfortunately, what started out as a promising way to assess our progress or status has now turned into a mandate-driven system that has far too many educators scared to take time away from standards-based curricula and focus on what prosocial education practice, research, and common sense tells us works. If we know how to help students develop socially, behaviorally, ethically, and emotionally and we know that such prosocial development complements a student’s academic development, then why are we still so heavily focused on only academics, standards-based curricula, pacing guides, and test scores after a decade of failure? If we also know (as documented in numerous chapters throughout this handbook) that focusing on improving school climate and increasing the civic and community engagement of our schools promotes both academic achievement and prosocial development while also helping students to develop stronger attachments to school, higher motivation to learn, and greater affect for learning, then why do we continue to test our students (and subsequently teachers) into submission? Given the overwhelming amount of evidence and research available suggesting that greater success and satisfaction exists when a symbiotic relationship between prosocial education and academic achievement is embraced, it is truly a conundrum to me that the powers that be have not solved this simple riddle. Apparently for some this conundrum still needs to be unraveled a bit more. This is why we enlisted experts across a range of fields to write this handbook.
We asked our friends and colleagues, respected leaders in the field of education with a focus in prosocial development, to help us compile a body of evidence to support you the reader in helping others better understand why we need more prosocial education to make real change, real academic reform and improvement. This chapter is mainly written to summarize the body of evidence we have provided in this handbook. But if you will indulge me, I would like to first address in a bit more depth the academic outcomes we have experienced during the past decade of the high-stakes testing movement that has in many aspects separated itself from prosocial education. My goal is to provide a rationale that clearly shows that if we continue to do what we have been doing, then we will continue to get the same results: no significant increase in proficiency, no significant decrease in dropouts, and no significant increase in retention of highly qualified educators. My goal in critiquing the high-stakes testing movement is to show that what could truly make our test scores rise is a stronger focus on prosocial education. After more than ten years of failure under No Child Left Behind (NCLB), and the introduction of the Common Core State Standards Initiative (CCSSI) promising to not be much different, it is time to have an honest discussion of the policies at hand. It is time to reconnect prosocial education to our academic achievement efforts and solve this conundrum so that we can once again get back to being the education system other countries seek to emulate.
I see this conundrum having two sides that need to be systematically explored. First I want to document what is not working (our current policy) and then discuss what holds great potential for improving our education efforts. What I hope to show by using this step-by-step approach is that the two sides of the conundrum are interconnected and to some degree reliant upon each other. My goal is to connect the dots so to speak so that it becomes crystal clear as to how, if we truly want to increase achievement, we must expand our conceptualization of academic achievement to reach far beyond test scores, and we must stop ignoring the prosocial education side of the coin.
In the first part of this discussion of the body of evidence, I will examine our existing approach to standardized testing. I will share how the standardized tests we use annually at so many grade levels came about and have evolved. I will then address how these tests were intended to improve where we rank in the world in education today but have not produced such success. To me, this is where an abundance of evidence exists supportive of prosocial education, because as we unravel how our existing approach has not worked to increase tests scores (and certainly not to support the development of the full potential of students), it becomes evident how prosocial education might be the missing piece of the puzzle. In unraveling this first part of the conundrum, I will discuss briefly how this testing fixation began as well as the Programme for International Student Assessment (PISA) scores that are used presently to rank education systems internationally. If our goal is to use our standards-based focus to improve our standards-based standardized test scores in hopes of improving our international ranking (that evidence also suggests we have not accomplished what we wanted), then all education stakeholders should understand how our standardized test scores are used and what they actually are and are not capable of measuring in the current design. Furthermore, in this first part of the body of evidence, I will also examine what variables are accounting for better international tests scores. In the last year, some very interesting analysis of the PISA scores has uncovered once again how socioeconomic status and parent involvement are two variables related to prosocial education that are having a great impact on how students score no matter what country they live in.
Next, I will explore how others that are scoring better than us internationally are actually approaching assessment, and more importantly how their education system is designed to do so well. For example, in the latest set of PISA scores released, Finland once again is among the top-scoring countries. Therefore I would like to briefly share with you how Finland approaches standardized testing and what they do within their education system to produce superior scores. Not to ruin the ending, but what you will find is that Finland is focused heavily on prosocial education efforts, and the annual testing of students (beyond PISA) typically only takes place when they turn sixteen years of age. You will also find that they do not hold teachers accountable or school systems hostage for such test scores. In the discussion of the other side of this body of evidence, and assuredly not least, I will review what we have shared in this handbook—the evidence and promise of prosocial education. After dissecting these two sides of the body of evidence, in the final part of this chapter I will discuss how these two sides could be and should be joined together to reap greater benefits for all educational stakeholders, and just maybe increase those coveted test scores significantly. Let’s begin by addressing when this movement toward a higher-stakes test-centered approach began and the rationale behind such an approach.
The Paralysis of Analysis
As hundreds of the educators I work with have told me, they feel paralyzed by the high-stakes testing movement. What started out as a calling to inspire youth has turned for many into a career that has taken the wind out from under their sails. So when did this paralysis of analysis begin? Well, depending on which educational historian or policy expert you ask, and as the next chapter on policy shares, you will probably find a few different answers or starting points as to when this movement actually began. Yet according to Wynne (1972), early output accountability measures began in 1895 with the introduction of spelling tests and written exams as a means to measure the quality of education in schools. The Elementary and Secondary Education Act (ESEA) of 1965, however, required funded programs to conduct evaluations that used basic skills tests as the measurement of student and program success (Popham, 2001). This brought about the idea that programs and school performance could be measured or evaluated by the performance of students on standardized testing measures, and by the 1980s, many states had developed statewide testing programs, which for all intents and purposes were utilized as an early accountability system in the United States.
On April 26, 1983, the concern for low-performing schools and their connection to test scores was escalated when the Reagan administration released a report on the status of America’s schools, A Nation at Risk. This criticism of the public education system that basically blamed teachers and schools for the decline in student performance was prepared by a prestigious committee, given the endorsement of the secretary of education (William Bennett), and warned that this decline would be the demise of America’s industrial clout (Berliner & Biddle, 1995). Through the power of the media (with a great amount of help from the agenda-setting gurus working in our nation’s capital under the Reagan administration), the idea was branded and to some degree accepted that America’s future business prominence would only be as strong as the student test scores being produced in America’s public schools. To many, this was the tipping point when the movement toward a competitive testing environment and mandates for evaluation gained great momentum (Corrigan, Grove, & Vincent, 2011).
As the next chapter on policy highlights, however, the arguments put forth in the mid-1980s (or even during the Cold War for that matter) are not that different from the claims made prior to putting No Child Left Behind in place or the rhetoric associated with today’s Common Core State Standards Initiative and the call for a new common core standards-based national test. This reoccurring belief or claim is that our tests scores and greater need to improve our focus on STEM subjects is the fulcrum on which our ability to continue to compete globally in science, technology, and industry rests. Such claims are scary. That’s probably why they have had so much success in redirecting our education’s focus. I would agree that the quality of our education system will be one of the deciding factors as to whether our country will remain a world leader. But I am not so sure that the test scores we are putting so much value on will necessarily be the most reliable or valid indicator of the extent of our success or failure. Let’s hope not, because as the research to follow suggests, our standardized test scores do not look too promising. So in an effort to expedite this historical synopsis and fast-forward to the lessons learned part of this brief chronological overview, let’s move forward from the 1980s and parachute pants to the year 2011 and skinny jeans, where we find standardized tests to be the latest fashion.
It’s All the Rage
We all know that No Child Left Behind commendably set out to shrink the achievement gap between blacks and whites, mandated that schools demonstrate adequate yearly progress (AYP), put state standards in place, and assessed such efforts through testing. But has a focus on achievement tests helped to increase achievement scores or our international standing? To answer this question, given that PISA didn’t begin until 2000, let us take a moment to consider the National Assessment of Educational Progress (NAEP).
The National Assessment of Educational Progress is the largest nationally representative and continuing assessment of what America’s students know and can do in various subject areas. The NAEP is often referred to as our nation’s report card. If it is our report card, the next question to ask is, how are we doing according to the NAEP? Based on a five-hundred-point scale, the scores for the 2011 administration of the National Assessment of Educational Progress (National Center for Education Statistics, 2011) show the following for fourth and eighth graders in reading and math:
- In math, fourth and eighth graders scored on average one percentage point higher in 2011 than 2009. Both grades scored more than twenty points (four percentage points) higher in 2011 than in 1990 (when the test was first given). But please note that most of these gains were experienced in the 1990s, prior to NCLB.
- In reading, fourth-grade scores did not change from 2009 but were four points higher than in 1992, when the reading test was first given. Eighth-graders scored on average one point higher in 2011 than 2009 and five points higher than in 1992.
- The overall achievement gap between white and black students showed no real change between 2009 and 2011, and it remains wide. There persists, according to the NAEP scores, a twenty-five-point gap in reading in both tested grades and in math among fourth graders.
- The gap between Hispanic eighth graders and non-Hispanic white students in reading and math closed slightly. It went from twenty-four points in 2009 to twenty-two points in 2011; in 1992, it was twenty-six points.
So if we are to use the NAEP scores as our indicator of success, it would appear that our focus on testing has not produced any significant gains in test scores. As Valerie Strauss (2011) of the Washington Post wrote, “Someone should be printing up a T-shirt about now that says: ‘My nation spent billions on testing and all I got was a 1-point gain’” (para. 1). Strauss also points out that “it is important to remember that even NAEP has its critics, some of whom point out that the test cannot measure many of the qualities students must develop to be successful, and others who say that the NAEP definition of ‘proficiency’ is unnaturally high” (para. 17). I would agree that rarely can a test assessing content and subject knowledge, with a splash of critical thinking, assess all that teachers teach students and all that students learn. This is where the many measures utilized in prosocial development could help. The NAEP, however, is the one consistent test we currently have that has sampled students from states across the United States (at different grade levels) for more than two decades. And since we are currently unable to compare scores from all of the states that basically use a different standardized test to assess student achievement based upon the different standards and levels of proficiency adopted by each state under NCLB, regardless of the shortcomings associated with the NAEP, it is still the best longitudinal assessment of educational progress we have. Yet I would agree that the NAEP might be setting their standards for proficiency a bit too high.
As Peterson and Hess (2008), state,
According to NAEP standards, only 31 percent of 8th graders in the United States are proficient in mathematics. Using that same standard, just 73 percent of 8th graders are proficient in math in the highest-achieving country, Singapore, according to the AIR [American Institute of Research] study. In other words, bringing virtually all 8th graders in the United States up to a NAEP-like level of proficiency in mathematics constitutes a challenge no country has ever mastered. (p. 70)
In fact, a study conducted by a former acting director of the National Center for Education Statistics, Gary Phillips, showed that most of the countries that participate in the international tests called the Third International Mathematics and Science Study (TIMSS) would not do well under NAEP’s definition of proficiency (National Center for Fair and Open Testing, 2011). Phillips’ study found that of forty-five countries who took part in the TIMSS, only six have a majority of students who would score proficient on NAEP’s eighth-grade math test.
If the NAEP’s definition of proficiency is too high, demanding, or stringent, then should we assume that the standardized tests used in each state are a better or fairer measure of proficiency? The answer to this question rests upon how you define better or fairer. When we compare our state-based tests (that currently rest upon assessing students’ subject content knowledge aligned with state content standards) to national assessments such as the NAEP (which focuses more on critical thinking skills than most states’ tests), however, we find that the two different measures rarely paint the same picture. Take for example in West Virginia where 81 percent of students were proficient in reading according to the state’s standardized achievement test, while only 22 percent were proficient in reading on the NAEP, and while 73 percent were proficient in math according to the state’s test, only 18 percent were proficient in math according to the NAEP (Rosenberger, 2008). This type of discrepancy when comparing state achievement tests to NAEP scores is not uncommon or exclusive to Appalachia. Discrepancies between NAEP and state tests are even larger in Georgia, Tennessee, and Oklahoma. If you take the time to explore such discrepancies on the NAEP website, as did Peterson and Hess (2008), you will find that all but three states’ tests (Massachusetts, Missouri, and South Carolina) fall short or far short of the NAEP proficiency expectations. It would appear that while the NAEP expectation for proficiency is too stringent, for the majority of the states the level expected for proficiency is not stringent enough. Yet despite the fact that a large portion of the body of evidence related to testing suggests that most states are giving a test that is far too lenient in assessing proficiency, some still believe that our differing states’ standardized tests provide a more feasible alternative to assessing academic success. If this is the case, how does our adequate yearly progress look when we consider our states’ tests?
Before I answer this question, for those not familiar with our high-stakes testing system (or for those who are just trying to make sense of it—and I sincerely wish you luck), I suspect I should first address briefly in a bit more detail what AYP is, how AYP is calculated, and more specifically how a level of proficiency achieved on the states’ standardized achievement tests is determined by each state for assessing AYP. Sounds kind of convoluted, doesn’t it? Well, to be honest, it is. In theory, the idea of requiring schools to make adequate yearly progress seemed like a good idea; as did leaving no child behind. But when you begin to dig into what this acronym (AYP) actually represents, you can see it has many flaws as well. For brevity’s sake, please allow me to give you the CliffsNotes on this little caveat of our testing system. Basically, under NCLB, the federal government wanted to make sure that schools were making progress each year. The goal was to get states to set achievable annual goals that helped them to gradually stair step to 100 percent proficiency by 2014; this part sort of makes sense if you believe 100 percent proficiency to be achievable. But to determine a way to actually gauge AYP, states first had to determine (in the early years of NCLB) what score would constitute a proficiency level on the standardized achievement tests adopted or created by the states at the beginning of NCLB. For example, some states created quartiles to categorize their scores and then designated a certain quartile (i.e., cut scores) to be reflective of proficiency.
Unfortunately, as you might surmise, each state has a different level of proficiency that was calculated in different ways based upon the variation of scores collected on their tests at the beginning of NCLB. Therefore, the discrepancies between NAEP scores and state test scores are not necessarily due to the standards set forth or the test that is being given but are also heavily reliant upon what proficiency level the state determined for such standards-based tests. Therefore, it would require far too much explanation to detail how each state has designated what test scores represent a proficient score. Regardless, the goal of AYP was to use this proficiency level to show that more students were becoming proficient in the tested content areas as NCLB matured. So, in order to show how the states would reach or accomplish 100 percent proficiency by 2014, and to keep funding coming in, they developed different plans to meet AYP. For example, if a state was at 64 percent proficiency at the beginning, they might have said they would increase proficiency by 3 percent every year for twelve years (3% × 12 = 36%; and 36% + 64% = 100%). Other states knew how hard it would be to increase proficiency every year, so they took a different approach (i.e., an ARM loan approach, if you will) and said they would increase 1 percent every year and then in the last few years they would make huge gains. These states most likely were hoping that NCLB would go away before they were required to meet their end goal. So how did the efforts to meet AYP (show gains in proficiency) based upon state tests work out?
Unfortunately, even when we set the NAEP scores aside, we are still not seeing progress in proficiency or AYP. According to the Center on Education Policy (Usher, 2011), and based upon using the states’ standardized test scores, “An estimated 38% of the nation’s public schools did not make AYP in 2011. This marks an increase from 33% in 2010 and is the highest percentage since NCLB took effect” (p. 2). In other words, even using each state’s standardized achievement tests (that they were allowed to create and set the level of proficiency for) did not yield adequate yearly progress. Even after allowing states to “renorm” or “improve” their tests (i.e., create new tests), the bottom line here is that we are not seeing the improvements that the billion-dollar testing policy set out to achieve. So the question that still lingers for many (who have not yet unraveled the conundrum and moved on to the question of how we actually improve our scores) is how do we create a fair and accurate measure of proficiency for what some like to call or think represents academic achievement? Personally, I believe the question should be whether it is even possible to create a fair measure of proficiency at national or international levels. Regardless, this is the challenge that our next line of policy, the Common Core State Standards Initiative, could and should address as well as fix. Unfortunately, as I will share with you next, I am not sure that what has been proposed will provide us with any major progress.
Common Sense versus Common Core
Next, I would like to address the role of common sense in testing. And to do this, before I go any further and address how the system will be “improved” under the Common Core State Standards Initiative, please allow me to clarify where I stand on testing. I am not suggesting we need a world free of testing. I think testing and holding students accountable on what they should be trying to learn is an essential component to providing a rigorous learning environment. Using tests, or even better, in some instances, using projects (or writing assignments) to test understanding and knowledge, is essential to helping a student get better. Such forms of testing are some of the best ways to help teachers better understand how to help and guide students. And only with the rigor that comes from testing, and providing the academic and social support needed to succeed in testing, can we help a student rise to the challenge and actually hit that zone of proximal development (ZPD) that Vygotsky (Ormrod, 2006) set for our ideal target. I am not saying to throw the baby out with the bathwater when it comes to testing, but it has been more than ten years that we have labored under this testing policy, and we might at least consider changing the stagnant, stinky bathwater before it becomes toxic.
I do believe test scores are important. I am a parent, a former teacher who taught in a juvenile detention center, and currently a professor, and I want my children and students to score well on tests. I also have researched more than a half dozen federally funded grants that required longitudinal and experimental designs to document success based upon test scores. I want my children and students to be challenged by tests. In many instances, I want my children and students to reach mastery on tests. But a well-designed test in a world cursed with the reality of the normal distribution of intelligence, should rarely ever produce all passing grades or for that matter 100 percent proficiency. If it is truly testing the knowledge or ability levels of all our students, it should mirror a spectrum of scores reflective of our students’ differing intelligence, knowledge, ability, motivation to learn, work ethic, and prosocial support levels.
If you ask any of my students, they will tell you that I am a believer in (yet not necessarily a practitioner of) normal distribution. I tell my undergraduates the first day of class that to me an A is for excellence, a B is for good, a C is for average, a D is for diploma, and an F means you forgot to drop my class. I explain to them on the first day that I am a fair grader, and the grades I assign will reflect how well they performed based upon the grading scale. But I also explain that from my experience, the performance of my students normally reflects a normal distribution, and I doubt that all in the class (for many reasons beyond intelligence) will reach excellence. Not a semester goes by that I do not give a wide spectrum or distribution of grades ranging from A to F. Is it possible that one semester I might have a group of driven, motivated, and intelligent students who receive all high grades? Sure it is, and that is what keeps me motivated to help all in my classes do their best work. But I do believe that if used wisely and created to assess critical thinking skills and content knowledge accurately, tests can be beneficial to educators and students. But the tests are only beneficial when we use them to guide our efforts with individual students and use them as an assessment to help each student improve in his or her weaker areas.
To make standardized tests useful instructional tools rather than mainly instruments of accountability, we need to start using the tests to diagnose student needs and progress, not as indicators of whether the class (i.e., teacher) or school has made adequate yearly progress (AYP). If we are going to spend billions of dollars more on testing annually, with only 2.6 percent of our federal budget going to education and states experiencing some of the largest deficits in educational funding to date (i.e., an underfunded education system), we need to invest more wisely and start developing tests that actually allow us to track an individual student’s growth and ability level. We need to create tests that inform what we are doing rather than just serving as an indicator of our being.
Furthermore, we need to stop using a cross-sectional comparison of last year’s student test scores to this year’s student test scores to hold teachers and schools accountable, as our current all-knowing analysis relies upon. If you are unaware of this analysis, you might be surprised to learn that we don’t actually use the tests to longitudinally track if individual students are increasing their test scores. Instead, we use the tests to compare Mrs. Jackson’s class test scores from last year to Mrs. Jackson’s class test scores this year. At best this cross-sectional approach only provides us with an assessment of how smart this year’s kids are compared to last year’s kids. And if the normal distribution of intelligence research (see figure 23.1) provides us with a bell curve, historically showing that when assessed by an IQ test (heavily reliant upon reading and math skills) a great majority of individuals (68 percent) fall within one standard deviation of the norm (100-point IQ), shouldn’t we assume that each year will provide a normal distribution of intelligence in our classes? And if our standardized tests are also heavily reliant upon reading and math skills (just like the IQ tests), shouldn’t we also expect a normal distribution of standardized achievement scores each year?
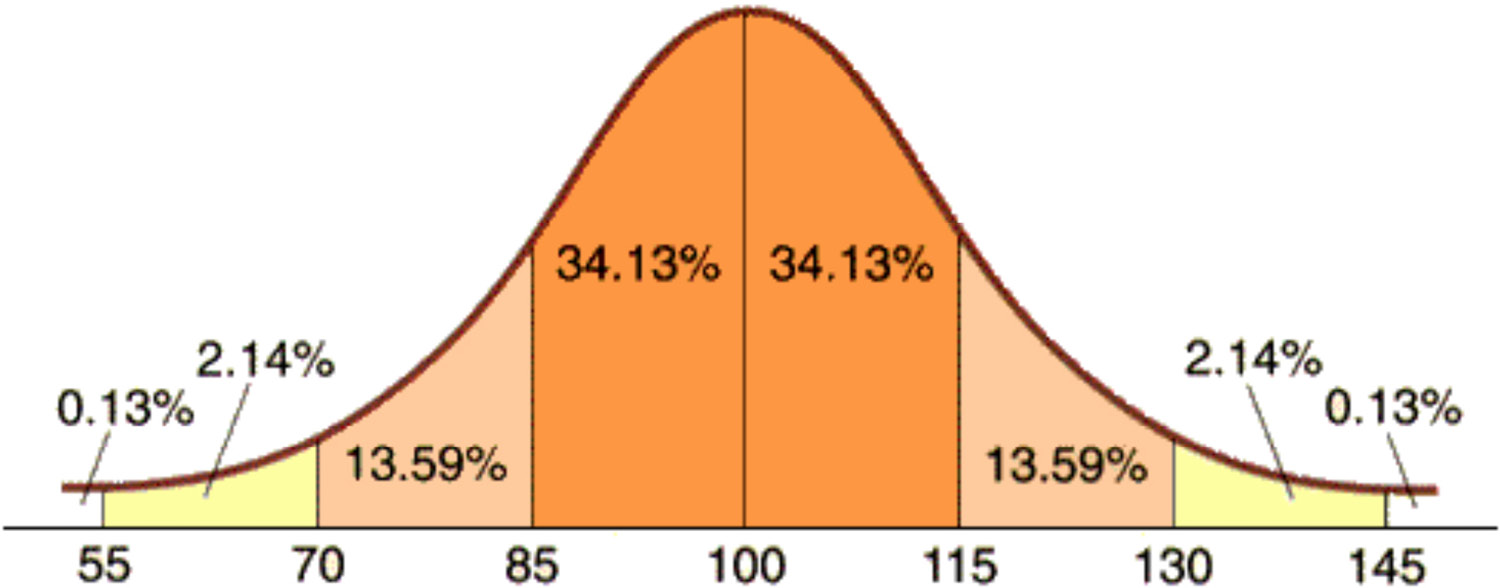
Figure 23.1. Normal distribution of intelligence.
Basically, what our tests are showing us is that we have little change taking place when we only compare last year’s class to this year’s class. In my opinion, beyond showing a normal distribution of intelligence (not to mention a normal distribution of motivation or effort put forth due to a test that does not hold students accountable), what the scores show us is that we have hit a ceiling, and if we continue this strict focus on testing void of common sense and an equal focus on prosocial education, we probably cannot increase our scores to the subjective level set to somehow miraculously take us to 100 percent proficiency by 2014. We have not made the gains expected even after allowing the states to change their tests annually if for some reason after they have not met their goals they feel it might be due to the tests they are using. We have not made the gains even after some states give a “practice” test that coincidentally is very similar to the real test. We have not made adequate yearly progress even after we have basically dismantled all other activities not related to the tested subject matter. Even after some have gotten rid of physical education, art, music, recess, and a great number of prosocial education efforts such as character education, we still cannot find enough instructional time to reach such unrealistic heights. And instead of realizing that such unreachable goals will lead to desperate people doing desperate things (e.g., the cheating scandal in Atlanta Schools), we continue to “stay the course.” Instead of being honest and forthright, our leaders at the highest levels and their federally funded research wings continue to shake the shiny keys and say “look over here—we have a new test and new standards.” Instead of discussing the fact that we have not made any adequate progress over several decades, all we seem to hear about is that NAEP is not fair, the state tests need to focus on a common core of standards and use a common test, and we need to continue our pursuit of the mirage known as 100 percent proficiency.
This is basically what the Common Core State Standards Initiative (CCSSI) is trying to accomplish. Through political strong-arming (e.g., if states do not agree to adopt the common core state standards, they will not be allowed to apply for certain federal monies), the decision makers at the federal government level have been able to push this new policy through. But when we look at who funded this program, we find that it is funded through the organizations and corporations that provide the testing services and subsequent texts developed to teach the new standards (Corrigan et al., 2011). Now that is truly scary. Even a student at only 27 percent reading proficiency could read the writing on the wall that there might be a problem (conflict of interest) when a large publishing company (such as Pearson) is funding (i.e., committing resources to) a federal movement to rewrite standards so that they conveniently might have a role in writing the new test, printing the new test, and/or publishing the new books to teach to the test. But welcome to Washington, D.C., where common sense is not that common anymore.
Furthermore, though some of the new CCSSI standards have been provided for educators to begin teaching, the curricula and different content subject knowledge tests are not quite ready. As a result, for the first few years of the CCSSI, many will be teaching new standards with inadequate resources and using old tests that measure different standards while the powers that be create, pilot, and set new proficiency levels for the new test. I am very curious, however, how the news of the first CCSSI test scores will be handled. I am also very curious as to what method they will use to determine the proficiency level for the tests and how such proficiency levels will compare to NAEP scores. I should mention that in some states such as California and Massachusetts, there is debate over whether the common core state standards are actually lower standards than the current California and Massachusetts standards used for NCLB (Stotsky & Wurman, 2010). Regardless, we know what is needed to move from a cross-sectional comparison of test scores to a more meaningful assessment that allows us to track whether educators are actually helping individual students get better academically. But with the rumors leaking out from behind the closed doors where these tests are being created suggesting they are developing another battery of content subject–based knowledge tests with a pinch of critical thinking that cannot be compared between grade levels (i.e., tracked longitudinally), it would appear that the new tests will not be used to track individual student progress. To steal President Obama’s words from the 2008 presidential election that caused so much debate, “You can put lipstick on a pig, but it’s still a pig.”
And despite the uproar in response to using such assessments of academic success as a means to hold teachers and administrators accountable, we will probably see these new CCSSI tests being used as some sort of “value-added” indicator of teacher effectiveness. This seems strange given that the test typically only starts in fourth grade and then often skips grades up to the junior or senior year. How can such an approach be fair to the teachers who teach the grade levels tested compared to those who do not? How can such a test be used fairly to assess teachers who teach pre-K through third grade or the primary or secondary grades not tested? And given that the tests typically only assess math, reading, history, and science, how will the tests be used to assess teachers who teach the few existing nontested subjects? And not to avoid the eight-hundred-pound gorilla in the classroom, why aren’t we taking this opportunity to incorporate age-appropriate developmental measures into the new tests to assess the developmental level of our students and possibly the impact of all the other prosocial education efforts put forth by a teacher or principal to help students develop? Because what I tell many of my students is that what some might call a learning disability is actually just developmental delay that can be remedied with a prosocial focus. Furthermore, even though policy does not mandate and in some instances does not even encourage prosocial education, many educators still focus on prosocial education and should be commended and rewarded for such efforts. To many, in addition to me, this standardized testing path we continue to stumble down as some states use their monies to theoretically Race to the Top makes absolutely no sense at all.
Why do we continue to think we can move so many test scores from the left of the normal distribution curve (and the middle) to the far right, turning a bell curve of scores into a graph resembling a tsunami? Why do we think a system so focused on academics can change historical research which finds that intelligence is somewhat innate (inherited from nature and for the most part not nurture dependent or changeable) (Simonton, 2001) or that we can rarely increase our intelligence more than one standard deviation (fifteen points) (Flynn, 1999)? Some might think my analogy comparing IQ tests to standardized tests is problematic. I find this resistance strange and ironic because it is as if some believe you don’t have to be intelligent to do well on a standardized test that is heavily reliant upon reading and math skills. Some think teaching to the test can actually help students memorize hundreds of answers regardless of their intelligence level. Such a perspective might explain why there are an endless number of students in classrooms across the United States who are being drilled and killed (not drilled and thrilled) with a plethora of test-based worksheets daily. I guess their educational psychology professors didn’t teach them the limitations of rote memory–based instruction. It is as if some want to state that intelligence has nothing to do with our ability to think critically when it comes to scientific inquiry, how well we can read and comprehend, how well we can do mathematical analysis, or how well we can recall history correctly and comprehend how historical events play a role in shaping our society. If standardized tests don’t measure intelligence, then what else are they measuring?
To play devil’s advocate against myself, it is quite possible the test scores are not reflecting intelligence in some instances. I am sure there are a great number of students who are highly intelligent that do poorly on the standardized tests. I know this for a fact because I was one of those students who, when told my IOWA test did not matter to my grades or moving on to become a sophomore, proceeded to fill in the letter C (for Corrigan) in order to complete the test more efficiently. I would say the standardized tests (in addition to reflecting one’s intelligence and subject matter knowledge, or lack thereof) are also measuring motivation to learn, intrinsic motivation, and work ethic (or lack thereof). I think the standardized test scores also reflect whether a student is actually interested in taking the test or even cares about his or her test score. An experiment led by Duckworth (University of Pennsylvania, 2011) was conducted in which researchers observed video footage of adolescent boys taking a standard IQ test to rate their motivation and then measured how well they fared in terms of criminal record, job status, and educational attainment more than a decade later. According to Duckworth, one’s motivation to take a test and IQ scores were nearly equally predictive of the adult outcomes of years of education, employment status, and criminal record. “What we were really interested in finding out was when you statically control for motivation, what happens to the predictive power of the IQ tests? What we found is that the predictive power goes down significantly,” Duckworth said (University of Pennsylvania, 2011, para. 6). From my experiences and from reviewing research similar to Duckworth’s, I believe that our low test scores are not necessarily a reflection of lack of intelligence (or lower reading and math ability) but quite possibly a reflection of lack of motivation.
I have spoken to a great number of students (from elementary to high school) who tell me that they know their scores will not influence whether they move on to the next grade. They have told me that they know it won’t affect their grade point average (GPA). And a few have even told me that they know the only person these test scores will impact is the teacher. From the devilish smile on a few of the faces that shared such news, I could only predict that they did not try that hard because it appeared they did not like their teacher. That is why I tell my students (i.e., preservice teachers and teachers getting a graduate degree) that if you want your test scores to rise, you must first focus on building relationships with your students and their parents. I share the old saying with them often, “They don’t care how much you know until they know how much you care.” And to do this, a teacher must use prosocial education to be successful.
But if you take the time to research how tests for IQ originated, you will find that Alfred Binet (of the Stanford-Binet test) created the IQ test in France in 1905 to determine which kids were not smart enough to be in public schools (Ormrod, 2006); therefore, both IQ and standardized tests were developed for similar uses to assess students’ cognitive abilities as they relate to public schooling. Furthermore, as mentioned earlier, the standardized tests and IQ tests are both heavily reliant upon reading and math abilities. In fact, if you take the time to analyze standardized test scores as I have on quite a few grants, you will often find collinear relationships between reading, math, science, and history scores. In other words, students’ reading abilities account for the lion’s share of the variance in their other subject area test scores and vice versa. This makes good common sense. Because how can one do well on one of those tricky algebraic math problems that require you to read and comprehend how long it takes a train to get from point x to point y at z speed if one does not have good reading comprehension skills? Furthermore, according to a study by Lynn, Meisenberg, Mikk, and Williams (2007) titled “National IQs Predict Differences in Scholastic Achievement in 67 Countries,” in an analysis of TIMSS assessments and IQ, the average correlation between IQ and mathematics scores was .89, and the average correlation between IQ and science scores was .86. In laymen’s terms, this means that IQ scores accounted for (predicted, if you will) 79 percent of the student math scores and 74 percent of science scores.
One might argue that the criterion-reference test requirement of No Child Left Behind is a fairer approach, as it is less dependent on a forced normal distribution and more dependent on a reflection of student content mastery. The hope of 100 percent proficiency even on a test that theoretically everyone could pass remains an unobtainable goal for many, and studies show that distributions of student proficiency on criterion-reference tests can have a normal distribution or be negatively skewed due to the test being a minimum proficiency test (Fusarelli, 2004). Therefore, because intelligence is one of the strongest predictors of high achievement, even for criterion-reference tests, IQ and mastery remain difficult to separate (Corrigan et al., 2011). The bottom line is that regardless of IQ, motivation, test anxiety, and the many other variables that possibly lead to testing fatigue or whatever it is one chooses to place blame on for the lack of stellar proficiency scores, there are many who still debate whether a challenging curriculum and intensive instruction within a public setting can actually improve intelligence significantly, which ultimately leads theoretically to increased test scores reaching 100 percent proficiency. One might debate whether we can do anything to raise our level of proficiency to 100 percent. But while we debate this construct of 100 percent proficiency, and even possibly my theory of how the normal distribution of intelligence relates to proficiency, let’s set aside the NAEP scores and the state standardized test scores and for a few moments more see if our efforts to increase achievement while separating it from a prosocial education focus have helped to increase our scores internationally.
It Depends on How You Slice the PISA
If this whole accountability movement, however, is based to some extent upon the belief that the fate of our nation’s industrial or economic clout (our ability to compete globally) is dependent upon how well our students score on tests, let us continue by looking at how our international test scores compare to other countries. As the research shared so far suggests, our efforts to increase proficiency by using the standardized tests we have created at home have not garnered the success we had hoped for with NCLB. But just maybe our problems lie within the testing challenges that we have with the NAEP and states’ tests (the ability to accurately and fairly assess proficiency), and just maybe by some strange serendipitous occurrence this focus has helped us to test better at the international level. If you have not read this research before and you are hoping for good news, I suggest that you not hold your breath.
The Organisation for Economic Co-operation and Development’s (OECD’s) Programme for International Student Assessment, is an international comparison of fifteen-year-olds’ scholastic performance in more than sixty-five countries. According to the OECD’s website, “the Programme for International Student Assessment is an international study which began in the year 2000. It aims to evaluate education systems worldwide by testing the skills and knowledge of 15-year-old students in participating countries/economies. Since the year 2000 over 70 countries and economies have participated in PISA” (OECD, 2011b, para. 1). The PISA is administered every three years. The PISA assesses reading, mathematical, and scientific literacy as well as problem solving. Please note, however, that the content areas are not designed to assess “merely in terms of mastery of the school curriculum, but in terms of important knowledge and skills needed in adult life” (OECD, 2012, para. 1). In fact, if you take some time to explore some of the questions they ask (which I strongly encourage), you will find that they truly do require a fifteen-year-old to think, not just recall a fact or circle a multiple-choice answer.
To some it seems that the United States has been in a free-fall on the international education rankings for several decades now. As President Obama stated in his January 2011 State of the Union address, “America has fallen to ninth in the proportion of young people with a college degree” (Obama, 2011, para. 34); we were once number one. In the 1970s, we were number one in high school graduation and now we have fallen to thirteenth, and the United States now has the highest college dropout rate in the industrialized world (Symonds, Schwartz, & Ferguson, 2011). And when it comes to how well we have performed on the PISA, which started around the same time as NCLB, “unfortunately, the USA’s performance on the four rounds of PISA over the past decade has been uniformly mediocre” (Symonds et al., p. 18). The 2009 PISA scores, the most recent scores analyzed, did not help to improve the picture.
The 2009 PISA scores ranked the U.S. average at fourteenth out of thirty-four OECD countries for reading skills, seventeenth for science, and a below-average twenty-fifth for mathematics. There is some news that a few desperate individuals might call good. In mathematics, no countries moved ahead of the United States since 2006, and the United States caught up with nine countries that previously had higher average scores. The best news rested in the science scores, where the United States went from 489 in 2006 to 502 in 2009—on par with the average OECD score. Additionally, the United States caught up with six countries in science and moved ahead of six other countries, though it still scored below twelve of them. In reading, despite the states’ efforts to increase their Sustained Silent Reading blocks to longer time allotments than what research shows kids are capable of paying attention (this is why I call it Sustained Silent Daydreaming), the United States had no change in reading from previous years. So once again, on a whole other level of testing, we are seeing no progress with our existing efforts to increase achievement and proficiency. But as the subheading suggests, how well we performed on the PISA administered in 2009 depends on how you look at the data; it depends on which slice of data you choose to digest.
While some reading this chapter might think I am being harsh when it comes to criticizing standardized tests and this proficiency movement, when you read the plethora of criticism of the PISA coming from the United States, you will think I have been nice. As a methodologist who spends a great amount of his time designing, reviewing, and critiquing research studies, I know all too well the increased challenges that arise as you add in an exponential number of covariates (variables that one can typically only statistically control for) and when you increase the diversity and size of the sample you are studying. For the individuals running the PISA, it has to be a nightmare at times. All of the tests are translated into the language of each participating country and then tested for reliability and validity. Some countries have a true sample of their students take part, while other countries, such as China, handpick which cities and schools take the test (while avoiding the rural poorer and less-educated areas). Some countries are quite diverse and have a large number of nonnative language speakers, while others are quite homogeneous. And some countries have a large number of what we might title low-socioeconomic-status students, while other countries (typically more socialist-based countries) do not have such a disparity of income and social support.
After the most recent PISA scores were released, there were a great number of naysayers who came out in the media to point out the shortcomings of the PISA. They brought up many of the methodological challenges I have just listed; “We have more diverse schools,” “We have the most kids in poverty of any other industrialized nation” (note to self: be careful what you use as an excuse, because it might make things worse), “We have 20 percent that do not speak English at home,” and “We test all of our kids” and “do a true random selection of schools across the states.” And from a psychometric standpoint, I would have to agree with them. It seems like a heroic effort that would have to be completed to validate the assessment tools as being equally reliable and accurate after they have been translated into so many languages. Also, the sampling procedures are equally challenging. How could it be fair to have one nation (such as the United States) have a truly random sample of a diverse group of individuals of different races and income levels take the test while another nation does not even have to worry (like the United States does) that 20 percent of the participants don’t even speak the native language fluently that they are being asked to read on the test? But the United States is not the only country that has its challenges with PISA. For example, in Germany, fifteen-year-olds are enrolled in five different grade levels, leaving them with 34 percent of fifteen-year-olds being in lower grades than expected (as compared to other countries) (Stanat et al., 2002). But what I found truly interesting is the research on socioeconomic status and parent engagement as it relates to the international PISA test scores.
Sending out an SES
For quite some time now, research has established that there is a strong relationship between socioeconomic status (SES) and academic achievement (Henry, Cavanagh, & Oetting, 2010; Kruse, 1996; Lee, Daniels, Puig, Newgent, & Nam, 2008). It makes sense that a child who grows up in a home where the parent or parents have lower education levels, possess fewer resources and skills to provide for good nutrition and academic support, and spend much less time on average helping their children with schoolwork or emphasizing schoolwork as an important part of life would by these circumstances be delayed (or at least challenged) developmentally, and as a result challenged when it comes to tests that rely heavily on reading comprehension. For example, Hart and Risley (1995) found that vocabulary growth differed sharply by SES class and that the gap between the classes opened early. By age three, children from professional parents had vocabularies of about 1,100 words, while children of parents on welfare had vocabularies of about 525 words. The children’s IQs correlated closely with their vocabularies. The average IQ among the professional children was 117, while the welfare children had an average IQ of 79. To throw insult after injury, by age three, the average child of a professional heard about 500,000 encouragements and 80,000 discouragements. For the welfare children, the situation was reversed: they heard, on average, about 75,000 encouragements and 200,000 discouragements. You do not have to be a developmental psychologist to understand how such early developmental challenges translate into academic challenges that persist into adolescence. As early as 2002, Germany had connected the lower PISA test scores with their low-SES students (Stanat et al., 2002).
Most recently Gerald Tirozzi, executive director of the National Association of Secondary School Principals, brought the SES debate to the forefront again in relation to how U.S. reading scores on PISA compare with the rest of the world’s by stating, “Once again, we’re reminded that students in poverty require intensive supports to break past a condition that formal schooling alone cannot overcome” (as cited in McCabe, 2010, para. 6). The head of the National Association of Secondary School Principals took a closer look at how U.S. reading scores compared with the rest of the world’s by overlaying the statistics on the tested students receiving the government’s free and reduced-price lunch program (provided to all students below the poverty line) to the PISA scores. Here’s what he found:
- In schools where less than 10 percent of students get free or reduced-price lunch, the reading score is 551. That would place those U.S. students at number two on the international ranking for reading, just behind Shanghai, China, which topped the ranking with a score of 556.
- In schools where 75 percent or more of the students get free or reduced-price lunch, the reading score was 446. That’s off the bottom of the charts, below last-place Greece’s 483. (as cited in McCabe, 2010, paras. 3–4)
Basically what Tirozzi is showing is that if PISA scores used SES as a covariate and controlled for this variable statistically, our scores and rankings would quite possibly be much higher in international rankings. Tirozzi also points out that other nations sort students into professional and labor tracks in the early teen years. In other words, many of the countries that take part in the PISA do not expect all students to be viable candidates for higher education and use their governmental powers to dictate that some are better suited for vocational careers or a trade. As a result, in some of the participating PISA countries, they only have the students heading to higher education actually taking the test. Not so in the United States, where educators must commit to educating all students and encouraging all in the belief that they too can go to college. Tirozzi goes on to say, “The release of the (Programme for International Student Assessment) data gives school leaders occasion to recommit to that goal [of helping low-SES students break past a condition that formal schooling alone cannot overcome].” Tirozzi added, “And we hope policymakers and all with a stake in the success of U.S. schools will take this occasion as well not merely to consider the problem, but to recommit with us to solving it” (as cited in McCabe, 2010, para. 8). What Tirozzi is asking policy makers to do is to focus on what we call prosocial education.
So how do we solve the problem? Do we adopt a policy where we allow one’s SES to dictate one’s achievement and thus dictate one’s education? “I’m sorry, Mike, but your IOWA test was horrible and your reading scores are too low due to your cultural upbringing, and there is nothing we can do to help you. . . . You will be a great janitor someday,” states my imaginary counselor. At what age would we “tell” a student he or she will not be pursuing the college prep track and instead will go to vocational school? Is it at fourteen so we can strategically increase our PISA test scores? I hope not. As a child of a single mom who survived on food stamps, I am very hesitant to say or suggest that students of poverty due to their academic performance should be destined for blue-collar work. This is the United States (not communist China and not fairly socialist Germany for that matter) and this is not part of the American dream. We believe that all deserve equal opportunity, and if our education system is not equipped to help students overcome the social challenges children of poverty face, then we need to revamp our education system. At the same time, it sure would be nice if we did revamp our education system to actually allow students of whatever SES the option to pursue a vocation or trade. Given that most students drop out of school due to not seeing how the material taught relates to what they want to do in life, a stronger commitment to vocational schooling offers true hope of not only reducing our dropout rate but engaging students in understanding how different careers, vocations, and trades are reliant upon the content knowledge and skills they learn in high school. Schools and teachers should have the support to be able to develop these connections in classes, in service learning, and in other out-of-school opportunities.
As this handbook has suggested, another possible way to solve (or at least address) the poverty issue (which may or may not be highly correlated with the vocational school movement when all is said and done) is to put more time toward helping low-SES students get the social support they need to compete with the other children who have many of the resources that low-SES students do not. And as this handbook suggests, this will require the powers that be to actually widen their educational lens to focus on the prosocial side of education. This will require our policy makers and others who play a role in the educational lobbying arena to read the research so they actually understand what is happening. One such area that prosocial education holds great potential for improving is parent involvement. As I will address next, parent involvement also is a variable that has been found to greatly impact PISA scores. The point is that those with lower-SES backgrounds may lack the developmental support needed to help them reach higher levels of proficiency (or possibly excellence) by the age of fifteen. More instruction and more testing have not produced these results. Yet as the prosocial education research this handbook has shared shows, we do know how to help them. We just need to make time for it.
Home Sweet Home
Parent involvement probably holds the greatest potential for helping us solve the effects of poverty on education—the differing scores between the “haves” and the “have nots.” Epstein (1995) argues that school, family, and community are important spheres of influence on children’s development and that a child’s educational development is enhanced when these three environments work collaboratively toward the same goals. Many of the foundational learning and developmental theories and philosophies taught to preservice teachers (and shared in chapter 5 and many case studies as well as other chapters) focus on these same spheres of influence. Vygotsky, Piaget, Erikson, Kohlberg, Dewey, and many others stressed the importance of the larger community’s and parent’s impact on developing the whole child and helping them accomplish higher levels of learning. Numerous literature reviews (e.g., Mitchell, 2008) and meta-analyses (e.g., Fan & Chen, 2001) clearly demonstrate the relationship between parent involvement and a student’s success in the test of life as well as the life of tests. We know that no matter what one’s economic status, having an involved parent can be the difference between academic success and failure.
Most of the individuals at the top of the food chain in education know this to be a fact. This is why increasing parent involvement, communication with parents, and surveying of parents were actually requirements under NCLB Title I efforts. Unfortunately, most educators did not have time to focus on all that NCLB set out to fix and instead decided to focus on increasing test scores in order to keep or get more funding. Some at the federal level continue to ignore research that highlights how poverty and parent involvement in education are tied together. Some even choose to live in a state of denial. One such person in a position of power with the ability to make a positive impact on education is Bob Wise, president of the Alliance for Excellent Education and the former governor of West Virginia. “The good news is that the free-fall seems to have stopped—and it was a free-fall for a while,” says Wise. He adds that he’s encouraged by the fact that 30 percent of the United States’ students who are low-income performed in the top quartile. “That says to me . . . that the child’s income level is not determinative of how well they can do” (as cited in Paulson, 2010, para. 8).
Really, the fact that 30 percent of low-income students performed in the top quartile shows that poverty does not determine academic success? Maybe he is confused and actually thinks it is the child’s income and not their family’s income. Maybe he meant to say that “it is encouraging that a child’s SES is not the sole determinant of how well they can do.” But if not, it makes me wonder how Governor Wise got elected to run a state that suffers from mass poverty. I guess during his one term of office, which included constant clog dancing with his constituents, he did not find the time to see firsthand how poverty impacts education. But as a professor who has taught for more than nine years in West Virginia and evaluated several federally funded longitudinal studies in the state, I can tell you with 100 percent confidence that it does. I guess he never met any of the kids I met who lived in homes without electricity or running water and whose role models consisted of a drug-addicted relative or a parasocial relationship with someone such as Dr. Phil. Maybe he didn’t meet any of the poverty-ridden parents who relied upon their children to read the mail because they did not finish ninth grade and thus could not help their children with schoolwork as other more affluent and educated parents could. There is ample evidence, however, that might explain to individuals such as Governor Wise why 30 percent of low-SES students do better than the others on the PISA. It just makes me wonder if they know and don’t care (or care to tell the truth), or if they just don’t understand the research.
To better understand why some students do well on the PISA tests, and others not as well, Andreas Schleicher of OECD was encouraged by the countries participating in the PISA to look beyond the classrooms. So, starting with four countries in 2006, and then fourteen more in 2009, her PISA team went to the parents of five thousand students and interviewed them about how the children were raised and then compared that with the test results. The OECD study found the following:
- Fifteen-year-old students whose parents often read books with them during their first year of primary school show markedly higher scores on PISA 2009 than students whose parents read with them infrequently or not at all.
- The performance advantage among students whose parents read to them in their early school years is evident regardless of the family’s socioeconomic background.
- Parents’ engagement with their fifteen-year-olds is strongly associated with better performance on PISA. (OECD, 2011a, p. 1)
According to the OECD, differences in performance that are associated with parental involvement partially mirrored the differences in the socioeconomic backgrounds of households. The study states that typically students in socioeconomically advantaged households experience an environment that is more advantageous to learning in many ways, including having more involved parents. However, even when comparing students of similar socioeconomic backgrounds, those students whose parents regularly read books to them when they were in the first year of primary school scored fourteen points higher, on average, than students whose parents did not. What they found was that when parents read with students at an early age, or discussed with their children what they had done that week in school, or even cared enough to ask how their day was, students did better in school. Furthermore, when parents were willing to discuss political or social issues, books, movies, or television programs, the kids did better on the tests. And the more involved the parents were, the smaller the test score gap was between those of lower socioeconomic status and others.
Who were the 30 percent of the lower-SES students that Governor Wise says are proof SES doesn’t matter? I would be willing to bet that 95 percent of the time they have some very caring parents (or grandparents) at home who want to help them break the cycle of learned helplessness that haunts his native state of West Virginia. I would also be willing to bet they have some great teachers and principals who welcome them every day at school and make them feel like someone actually cares about them and wants them to succeed. Finding out what truly is helping our low-SES students excel academically should be pushed to the forefront of our national research efforts. But there is plenty of research beyond this study that should lead us to be more prosocially focused on getting parents more involved.
Darling-Hammond (2011), in her latest book, The Flat World and Education, says the school reform challenge is all about equity. Darling-Hammond uses the example of Singapore, where “80% of families live in public housing, yet its 4th and 8th-grade students scored first in the world in both mathematics and science on the TIMSS assessment in 2003” (p. 5). Darling-Hammond’s statement highlights the investment in the schools themselves and in teacher training and support the country has initiated. As a side note, it’s not coincidental that we often see representatives from the Singapore ministry of education at prosocial education conferences in the United States. They attend to learn more about character education and social-emotional learning every year and are focused on building social skills into the national curriculum.
According to researchers Karen Smith Conway and Andrew Houtenville (University of New Hampshire, 2008), in order to experience the same achievement results gained by parent involvement, schools would have to increase per-student spending by more than one thousand dollars. Research suggests that there is a significant, positive relationship between parent involvement and student educational experiences, including improved academic outcomes (Barton & Coley, 2007; Henderson & Mapp, 2002). The literature explains that parent and community involvement activities associated with student learning have a greater effect on academic achievement than general forms of involvement (e.g., volunteering in schools, event attendance) (Henderson & Mapp, 2002). More specifically, parental involvement has an even greater impact when the involvement revolves more around specific academic needs such as mathematics (Sheldon & Epstein, 2005). Such increased parental involvement has an impact on secondary students (Tonn, 2005) and an even greater impact in some circumstances on elementary students (Horvat, Weininger, & Lareau, 2003; McNeal, 1999).
Research also shows us that greater parental involvement and helping parents (or guardians) better understand the social-emotional learning and socialization challenges their children encounter, can greatly complement teachers’ efforts to get students more engaged, and can reduce behaviors that create barriers to effective instruction and learning (Spoth, Randall, & Shin, 2008). As Boethel (2003) explains, “Relationships are the foundation of parent involvement in schools” (p. 71). And at the end of the day, this is what prosocial education aims to bring to the table—a way to bring the social side of education back to the forefront of our education efforts. Nearly every chapter in part 2 of this handbook links prosocial efforts to working more closely with parents. Nearly every chapter in this book holds some tie to communicating to parents that we (educators) care about their children and not just test scores. As an old saying in education reminds us, they don’t care how much we know until they know how much we care.
Let me Finnish
Research shows that during the past ten years of NCLB and the PISA, we have made no significant gains in improving our NAEP or state standards–based test scores, nor our international ranking; and sadly, according the PISA we are scoring at average to below-average levels. There are very few teachers or principals I have worked with who would disagree that as we have moved deeper into testing as our focus, we have moved further away from allowing our teachers the time and resources to focus on developing the whole child and promoting prosocial education. Though some might say that our early childhood development efforts requiring pre-K in many states’ schools and the fact that some states now require all-day kindergarten equates to a focus on prosocial education or prosocial development, in reality this effort is not enough, and to many it is obvious that these efforts are just an attempt in many instances to get our kids up to speed academically and theoretically prepared to be ready to better excel on the more demanding standards set for elementary school. Finland, however, doesn’t have children start formal schooling until seven years of age (Sahlberg, 2011). As I will explain next, Finland basically does education nearly completely differently than the United States. Finland focuses on prosocial education, and Finland is doing great in the PISA rankings. Furthermore, Finland was not performing well educationally in the 1970s, when the United States was the unquestioned education leader in the world. As the United States has fallen in the ranks, Finland has soared to the top. The process of change is basically the reverse of policies in the United States. “Over the past 40 years, Finland has shifted from a highly centralized system emphasizing external testing to a more localized system in which highly trained teachers design curriculum around the very lean national standards” (Darling-Hammond, 2010, para. 12). Therefore, I would like to take a moment to explore what Finland has done to help them improve so much and score as well as they do.
First, however, I didn’t pick Finland because of all the press they have received for being one of the top dogs in the PISA race. I picked it because a colleague and I were having a discussion about the Finnish approach to education and how they are very prosocially focused. My nine-year-old daughter overheard the discussion and said, “I wish I went to school there!” Reflecting back to when she was younger and we spent part of a summer in Ireland and Great Britain while I did several lectures, she enthusiastically suggested, “You could get a professor’s job there!” Why did she suggest such a career move for me? Is it because she heard us say they don’t start school until they are seven? Is it because she heard us say they don’t bring homework home during the elementary grades? Is it because she heard us say they don’t do widespread standardized testing until they are sixteen? Knowing full well that my daughter, being the youngest in her class and being as gifted as she is, loves school and is an amazing student who sees grades as a competition to be the best in her class, she still is a kid at heart who would much rather come home and be able to find time to just be a kid. Therefore, the answer to all of these questions of why my daughter would suggest such a move is probably yes. All of what Finland does sounded great to my daughter, and her enthusiasm made me realize even more so how Finland’s approach holds great promise for the United States. Why? Because Finland understands that in order for students to be excellent they must first have a chance to grow up, and we must help them to actually like going to school. They understand that children first need to actually experience childhood. They don’t expect children to take more courses than a college student while they are in fourth grade. Finland focuses on helping each child develop individually. This is why I feel that Finland is a perfect example to use to show how the United States could once again get back to prosocial education, and that, among other things, could be the conduit to higher test scores.
Finlandophilia is a term that has been used to define the world’s infatuation with the Finnish education system. While some might think we cannot learn from other countries that are not like us (i.e., Finland is a socialist country that many believe to be a very homogeneous population that speaks a common language), others disagree and strongly suggest that if we are to improve, the answer rests in adopting or, more importantly, adapting what other more successful PISA-scoring countries do so well to our education system (Symonds et al., 2011). Some believe that the U.S. student population is too diverse ethnically and economically to adopt a Finland-like approach. Although the United States does have some very diverse and multicultural schools (mainly located in urban areas), given that the majority of our schools rest in rural and suburban areas typically populated by a majority of English language speaking Caucasian students, to me this is not the case. But the facts are that Finland has a fairly diverse population. According to Darling-Hammond (2010), “One recent analysis notes that in some urban schools the number of immigrant children or those whose mother tongue is not Finnish approaches 50 percent” (para. 7). Although most immigrants come from places such as Sweden, the most rapidly growing sectors since 1990 have been from Afghanistan, Bosnia, India, Iran, Iraq, Serbia, Somalia, Turkey, Thailand, and Vietnam. These recent immigrants speak more than sixty languages. Yet achievement has been climbing in Finland and produces a highly equitable distribution of achievement for its growing share of immigrant students. Sure we are a more diverse country than Finland, but if their system is working in their homogeneous and also in their rather diverse urban schools, I think it would be wise to at least consider for a moment what they have learned and accomplished during the forty years we have digressed.
To me there are many aspects we can learn and adopt/adapt from Finland in regard to how prosocial education is the foundation for a better education system. In fact, much of what they do is diametrically different from our current approach. Dr. Pasi Sahlberg (2009, 2011), a Finnish educator, author, and director general at the Finnish Centre for International Mobility and Cooperation, states,
- The first six years of education are not about academic success or measuring academic success. It’s about being ready to learn and finding a student’s passion.
- Finland does not have high-stakes testing.
- Finnish students do little homework.
- Finland does not have a thick tome of national standards. Instead they are designed more at the local level.
- The notion of caring for students educationally and personally is a central principle in the Finnish schools.
- There is meaningful technical and vocational education in Finnish schools.
- More than 99 percent of students now successfully complete compulsory basic education.
- About 90 percent complete upper secondary school (i.e., 10 percent dropout rate).
- Two-thirds of the graduates enroll in universities or professionally oriented polytechnic schools.
- And most interesting of all to me is that he says it is harder to get into teacher education than law or medicine.
According to Sahlberg, at the University of Helsinki where he teaches, 2,400 people competed last year for 120 slots in the (fully subsidized) master’s program for school teachers. “The Finns have worked systematically over 35 years to make sure that competent professionals who can craft the best learning conditions for all students are in all schools, rather than thinking that standardized instruction and related testing can be brought in at the last minute to improve student learning and turn around failing schools” (Sahlberg, 2009, p. 22). Finland has a productive teaching and learning system that was created by investing purposefully in ambitious educational goals using strategic approaches to build teaching capacity (Darling-Hammond, 2010). Finnish schools are generally small (fewer than three hundred students) with relatively small class sizes (in the twenties) and are uniformly well equipped. Students receive a free meal daily, as well as free health care, transportation, learning materials, and counseling in their schools so that the foundations for learning are in place. “Most visitors to Finland discover elegant school buildings filled with calm children and highly educated teachers. They also recognize the large autonomy that schools enjoy, little interference by the central education administration in schools’ everyday lives, systematic methods to address problems in the lives of students, and targeted professional help for those in need” (Sahlberg, 2009, p. 7).
There are many things we can learn from Finland. Can we actually just fully transplant what they do to our education system? I would think that such an effort would fail. As Sahlberg said quoting an old Finnish saying once in an interview, “Only dead fish follow the stream.” The reason they succeeded was because they went completely against the stream and developed something unique to their schooling and then allowed each school to personalize it even more. And as if that were not enough, they allow each teacher to do what he or she needs to do to help each student succeed in school and life. In reality what they are doing is a better job of creating citizens capable of running a democracy than we are doing.
Divided We Fall
I do believe the great divide that exists between policy makers, educators, and not to forget parents and students is that we disagree on what the most important outcome (or possibly outcomes) should be for our education system. Showing realistic improvement in proficiency on the basic content knowledge currently tested is a worthy endeavor. We can and should try to increase the number of academically proficient students in our schools. But as the critics of the NAEP suggest, a test cannot measure all that we do or accomplish in a classroom. Furthermore, scores that do not reach our goals of proficiency should not be our only concern or sole focus. As this handbook has shared, there are so many other prosocial education related variables that should be of major concern to educators, parents, and lawmakers. If our education system is the fulcrum our nation’s clout rests upon, this means we are hoping our education system produces not only the knowledgeable workers we need to be astute in subjects such as math, science, and reading, but also the ethical workers we need who will have the social skills and perseverance to truly put such knowledge to work. As this handbook has put forth, our education system was created to develop the citizens we need to make our democracy (or republic) work and thrive.
We must stop limiting our focus to testing and curricula. We must stop treating the symptoms of our education system’s ailments with first-order changes (surface-level changes such as a new test with common core state standards or the latest curriculum) and begin addressing the causes of the illness (Corrigan et al., 2011). For example, we can often revive a person who is having a heart attack, but if we do not help that person understand the life changes they need to make in diet and exercise, the probability is great he will find himself again under emergency medical care. We need to be more proactive and preventive in our approaches so that we do not find ourselves in ten years creating another bastardized version of NCLB because we have once again failed under CCSSI to increase proficiency. We must focus on the vital signs (e.g., our students’ prosocial needs) to take a more comprehensive approach. This is crucial. To provide long-term health for the patient (the students our education system produces) demands a more prosocial education systemic focus capable of making second-order or more meaningful change. We must get back to assessing and focusing on what we do that helps students do better and develop into the citizens we need to compete globally and flourish locally, as well as help teachers experience greater success and satisfaction. And we must move away from overtesting our students and inducing the boredom that results.
As my colleagues and I wrote in our recent book focused on data-driven education reform,
GPA and standardized testing supposedly offer insight into one’s academic achievement. Yet most of us know a smart child who is not motivated to learn or take a test. Motivation is a key factor to learning (Skinner, 1969) that typically accounts for a significant percentage of achievement (10+%) (Uguroglu & Walberh, 1979). Also one’s feelings (affect) for the subject matter or schoolwork play a key role and account for an equally significant percentage of academic achievement. As a result, improving educational attitudes is often the answer to improving learning and increasing test scores. In reality, if a student is not held accountable for his or her test scores and the scores do not have any impact on their GPA, moving to the next grade, or graduating, why would they try hard on the tests? One answer is that they actually feel intrinsically motivated, empowered to do well, and want to show how smart they have become. Another possibility for trying harder is that students know it is the teacher and school that are held accountable for their test scores, and they like you the educator (and the school) and want to do well to help you. How about considering the students’ feelings toward school or testing? How about seeking more information as to how one might build an intrinsic drive to learn or achieve? (Corrigan et al., 2011, pp. 34–35)
I do believe that if we continue to overfocus on standards-based testing we will continue to see more students grow bored and disillusioned with school and learning. And given that we still have approximately one-third of our students dropping out of school (as discussed and cited in chapter 5), ignoring efforts to focus on prosocial education, increase motivation to learn, and make the material we teach more meaningful to students is something we cannot do. Furthermore, if we are losing a high percentage of our new teachers within three to five years of starting their careers and seeing some of our best teachers taking early retirement or leaving for jobs in other sectors (which as chapter 5 explained is related to the testing focus), we must focus equally on what we can do to help teachers overcome the side effects that result from the overfocus on testing. If we are to escape this paralysis of analysis, we must move to a broader conceptualization of what measures, or more importantly helps us to achieve, a broader definition of academic success.
The Body of Prosocial Education Evidence
In this handbook we have shared with you different levels and kinds of evidence for prosocial education. The persuasive stories in the case studies and the thematic analyses addressed in the chapters provide an abundance of anecdotal and qualitative evidence. The well-designed randomized controlled trial (RCT), quasi-experimental, and experimental studies cited within the chapters have added to the body of prosocial education evidence sound quantitative research to further support the efficacy of prosocial education. From small-sample qualitative studies to large longitudinal quantitative studies, a great number of hypotheses have been answered with data supporting the impact that prosocial education can have on a range of developmental and academic outcomes and suggesting that prosocial education holds great potential for turning around the not-so-successful results we have experienced with our efforts to increase proficiency and our international standing.
The body of evidence that relates to prosocial education shows that educators and education researchers are using their heads, hearts, and hands to actually improve education. The body of prosocial education research is focused on (1) the developmental needs of students and (2) the needs of educators and school systems to make the climate and culture conducive to student learning and growth (i.e., fixing an archaic, broken system overly focused on standards and testing). The body of prosocial education evidence provides a logical response (or alternative) to the challenges of today that show that much of the current programmatic, political, and reform agendas guiding our education efforts are bankrupt or corrupt, misdirected, or simply ineffective or inadequate. We need standards and good reading programs, but if the school culture is dehumanizing, it becomes an unproductive hidden curriculum that dominates daily life and overpowers the academic goals for many or most kids.
One such chapter that provides strong evidence supportive of prosocial education is Kidron and Osher’s chapter, “The History and Direction of Research on Prosocial Education.” This chapter shows how the debate over the role of education in improving prosocial behavior and prosocial development (i.e., prosocial education) has been ongoing for quite some time. But this chapter also provides you with results from a great number of federally funded studies that have produced evidence suggesting not only that such efforts can be accomplished by schools to try to make a difference, but also that such efforts can make a statistically significant difference. In its practice guide from the What Works Clearinghouse (Epstein, Atkins, Cullinan, Kutash, & Weaver, 2008), the Institute of Education Sciences identified five research-based, prosocial education practices for reducing problem behavior in elementary school classrooms. Character education, civic engagement, and life skills training are just a few of the programmatic foci that have produced quantitative evidence showing that such efforts work toward improving education and instruction while reducing the risky and problem behaviors that hold so many classrooms back from increasing academic achievement.
Sheldon Berman’s chapter, “The District Superintendent’s Role in Supporting Prosocial Education,” is a wonderful combination of evidence and narrative that shows how the social environment creates the foundation on which productive learning can occur. Cohen’s chapter, “School Climate and Culture Improvement,” shares an abundance of prosocial education research showing indirect and direct relationships between school climate and academic success. The Snyder and Flay chapter, “Positive Youth Development” (PYD), shows how PYD-related approaches are beginning to amass a body of literature that demonstrates how PYD programs work to augment youth development that can contribute greatly to improving the positive effects of instructional efforts. As we contemplate solutions for problems such as declining academic motivation and achievement; escalating school dropout rates (Battin-Pearson et al., 2000); and increasing school bullying and aggression (Swearer, Espelage, Vaillancourt, & Hymel, 2010) that our current policy is not helping to improve, Schonert-Reichl’s chapter, “Social and Emotional Learning and Prosocial Education,” as well as Durlak and colleagues’ meta-analysis on social-emotional learning (Durlak, Weissberg, Dymnicki, Taylor, & Schellinger, 2011), supports the assertion that a focus on our youth’s mental well-being is greatly needed. All of these slightly different areas of prosocial education research point to the systemic nature of human development and the relational systems, including children, parents, and teachers, that are needed for education to be effective. When you begin to connect these slightly different areas of prosocial education research, you can begin to see the systemic nature demanded for education to truly work. In order for true academic or educational success to occur, we must begin connecting how the environment (climate, culture) provides a place for youth to develop physically, ethically, mentally, socially, and emotionally before we can hope to see the academic developmental gains our current federal policy focuses upon.
The chapters on character education, civic engagement, service learning, prevention of bullying and harassment, and after-school efforts provide even more evidence showing how educators, who have developed a mind-set (philosophy) to help students develop prosocially, have made incredible and commendable gains to broadening the focus and success of their education efforts when they developed a process to approach education reform systematically. And even though we set out to develop a handbook that stresses process over programs, we still shared within this handbook a great number of examples of successful programs supported by research. Too Good for Violence, Positive Behavior Supports, Facing History and Ourselves, and the Olweus approach to preventing bullying and harassment are just a few of the programs cited within the chapters and case studies that have strong quantitative and qualitative evidence. Please note, however, that these are programs that all stress process and are adaptable to different classes and schools.
Furthermore, the chapter on the emerging field of contemplative education, “Supporting Educational Goals through Cultivating Mindfulness,” demonstrates how to build a research program based on evidence from different sources. They cite Benson’s work on the relaxation response (thirty years old); Kabot-Zinn’s work showing an impact on the chronically ill, which is translated to prevention with more diverse groups; and neuropsychology research, which is now directing hypothesis testing and program design in schools. The moral-reading intervention case study is a good example of how to build in evaluation from the beginning of a new program. Though moral education (e.g., Kohlberg) has a very strong quantitative and qualitative evidence base built off of the research performed several decades ago on moral dilemma exercises integrated into social studies classes and curricula (which both the Cohen and Powers chapters refer to), today the research is resurfacing again stronger than ever under the efforts of Just Communities and democratic classrooms as described by the Powers chapter on moral education. Therefore, the evidence provided in this handbook offers insight as to how numerous prosocial education fields are continuing to evaluate and replicate interventions and programs in different contexts, classrooms, and countries and to document the evolution of school policy changes over the decades since they started. To me this is a very important point.
Though there is a great amount of excellent longitudinal research taking place, in my opinion, too often in academia we perform what some might refer to as one-shot studies. A professor, graduate student, or group of researchers sets out (with possibly some grant monies) to study how one variable (e.g., an intervention) impacts other variables or practices. They spend anywhere from a day to years performing the study. Some collect data on the sample as the study is taking place, while others might perform what they want to believe is a causal analysis on an archived (secondary) data set. These studies produce results that are either found to be statistically significant or not significant. Unfortunately, all too often, once the study is completed and the conference papers and manuscripts are presented and published, they move on to another focus of study, which is typically not related to the variables they first investigated. Instead of replicating studies (which is truly needed to establish anything close to claiming causation), in educational research we seem to too often be in search of the next discovery. In prosocial education, however, when you begin to read the mass of research as presented in this handbook, you can begin to see how the research has been built up for decades and generations. From decades of research on prosocial education, you can see how the qualitative research has fed and informed the quantitative research. And what I find most admirable, for which we editors are truly grateful to the authors of the chapters and case studies in this handbook (as well as the hundreds of others who research prosocial education), is that despite a tenure of policy that has taken us away from a focus on prosocial education, they have not given up. They continue to replicate studies to produce evidence for the day when the powers that be come to the realization that what we are doing is not working and come back to a state of common sense. They continue a research focus with an emphasis on building school processes that acknowledge the two sides of education—prosocial and academic—are sealed together.
Between this chapter, the following chapter on education policy, and chapter 1, we editors have given you a rich array of arguments, theories, examples, and stories that should have persuaded you about the importance of starting with prosocial education as the necessary basis of educational and school reform and the promotion of student learning, excellence, and preparation for life. This brings us to summarize the major points that we introduced in chapter 1 of this handbook.
- All educational policies should foster schools that are safe, humane, respectful, and caring because all human beings (in this case the children and adolescents and their teachers and school personnel) have intrinsic worth and should not be abused or neglected or overcontrolled. The editors of this handbook believe that bad schools are guilty of neglect in the same way that parents can be guilty of neglect. The problem is that when schools neglect children, we accept it because we think there is not enough money to tackle the problem, teachers are too overburdened, neighborhoods are poor or communities are uncommitted to education so there is no tax base, and so forth. Yet none of these excuses hold water. This handbook and the abundance of research cited within it demonstrate that many schools are caring and intellectually stimulating places in which students and adults thrive. The authors herein offer many variants on the fundamental recipe that integrates prosocial education with academic learning.
- All educational policies should permit, that is, not hinder, the fullest development of each child’s social, emotional, self-regulatory, and cognitive skills. The basis for this is the same as above, the intrinsic worth of each human. To acknowledge the intrinsic worth of someone means that she should be treated as you yourself would want to be treated, as you seek to be treated, and as you try to get others to treat you—that is with deep respect.
- Educational policies must also be based on science, on evidence. This book compiles evidence of all kinds about specific programs that all focus on prosocial development—so there is a good and growing evidence base that shows we have the practical knowledge and skills to create the positive conditions demanded by points 1 and 2.
- Specifically, moral education promotes perspective taking, empathy, and social reasoning; SEL programs promote self-regulation and emotional growth skills; character programs promote positive attitudes and prosocial behaviors; better school climate promotes safety; and so on. The theoretical point to be made is that there are strategies and programs that effectively target and promote child development and conditions in which children can thrive (points 1 and 2).
- Most importantly, there is evidence from many of the authors cited in our handbook that shows that prosocial processes enhance motivation to learn and academic achievement. This is a key point for policy, as we all know.
Sometimes Nothing Is Something
This chapter has focused mainly on research and data supportive of the need to focus on prosocial education and also on data supportive of changing the dysfunctional strictly focused, standards-based testing approach. But I would like to end this chapter by posing a question that I am sure many individuals in education have wrestled with at some point in the past: If something cannot be accurately measured or tested, if we are unable to place a numerical value on a specific effort’s worth or contribution, does that mean it has no value? I pose this question because some still question the research findings of specific studies in prosocial education while neglecting to consider the totality of the body of evidence that supports it.
I wrote this question down the other day as one of my graduate students left my office. While working on a research proposal focused on the contribution that teaching the arts (more specifically, teaching art instruction in schools) provides to academic achievement, she had discovered that research supportive of the arts’ ability to directly influence positive improvements in academic achievement was not that easy to find. She was disappointed to discover that the few studies completed which suggested that such a direct relationship existed held many limitations such as small sample sizes (studies performed on a few art students taught by one art teacher in one school), bias in research design (e.g., nonexperimental studies on the arts funded by large arts organizations), and questionable psychometrics (lack of reliable and valid assessment tools used to measure the outcomes). After nearly a semester of researching the topic she wanted to study as an aspiring art teacher, and a lifetime of striving to become a great artist, I could see the disappointment on her face. This is when I decided to share with her the difference between the belief in additive models versus mediated models.
I shared with her Anderson’s (1982) work on school climate that explains how “the simplest models are purely additive. That is, they assume that variables directly influence student outcomes in a separate but additive way” (p. 384). For example, some still seek (often to no avail) to support that a new curriculum can by itself increase achievement. While from a simplistic research design additive models appear easy to use (i.e., you only have to theoretically capture a variable assumed to measure whether art instruction took place and compare it to achievement scores), these models do not adequately reflect reality, where many highly related variables are constantly interacting (Burstein, 1980; Levin, 1970). For example, wouldn’t variables such as the quality, frequency, duration, or types of art instruction have a role in the impact that art instruction could make? Furthermore, what other challenges exist in the schools studying whether art instruction can improve academic achievement that might also be holding back efforts to increase achievement? Is it even feasible to think that art instruction given a few hours a week could overcome the academic challenges related to socioeconomic status (SES) and lack of parent involvement? I explained how often a distal (long-term) goal such as increasing academic achievement is frequently reliant upon many mediating variables. We discussed how there are many variables that impact a school’s or teacher’s ability to increase achievement such as school climate, peer relationships, motivation to learn, student attitudes toward education, school leadership, and parent involvement. We talked about the many other variables that students face when trying to increase achievement, such as getting adequate sleep, nutrition, academic support, and time to study, not to mention wrestling with the intelligence they were innately granted at birth (and which quite possibly has not been nurtured to the highest extent). We talked about how many of these mediating variables can and should be addressed from a more short-term or proximal perspective, and we discussed how they impact each other in more of a systemic way. In other words, in order to accomplish your long-term goal, there are a great number of short-term variables that will impact and predict whether you are able to accomplish the long-term goal. And as a result, under a mediated model, you should be including these many variables as part of your focus.
In order to truly capture (statistically) the potential power of art instruction, many of these variables mentioned would also need to be addressed in the research design or at least statistically accounted for or controlled for in the analysis. If we only look at a few variables, the existence of art instruction and academic achievement, we probably are not going to find much evidence suggesting that art instruction helps achievement, because as numerous studies cited within this chapter suggest, the majority of the variance in test scores is typically accounted for by prosocial variables such as motivation to learn, affect toward the subject matter or school, socioeconomic status, parent involvement, and IQ. Studies that only consider a few variables are just flawed shortsighted studies in my opinion. And the truly sad part is that these types of studies are often the majority of studies that are published. Even more disappointing, typically journals will not publish studies that do not find statistical significance; therefore we truly only see the portion of these studies that actually find something. As a result, people in charge of making policy decisions in the age of data-driven education are left with little evidence to make critical decisions. Furthermore, they use this type of research to make statements that could be paraphrased as “the arts have no significant impact on achievement.” But for those who understand Type I and Type II errors in statistics, we must be careful not to assume that what we find to be true is true, because it might actually be false. We must also be careful in assuming that what we find to be false is false, because it might actually be true. In other words, that which apparently has no value, worth, or power statistically might actually be very significant to our efforts.
The research my colleagues and I have produced suggests that educational success (or academic achievement, for individuals who have not yet accepted the prosocial side of the education coin) is reliant upon a multidimensional assortment of variables and efforts (Corrigan et al., 2011). And though measuring the impact of instruction in the arts (e.g., arts, music) might be hard to capture and link directly to increases in academic achievement, in reality, if the arts increase creativity, inspire critical thinking, and provide a class that students actually enjoy being part of, then logic would suggest that to some degree the instruction of arts in schools holds great value. I then shared how there are also very few studies on specific curricula showing a direct impact on achievement scores.
I share this little anecdotal story because I think it relates closely to the evidence existing in education today related to academic achievement (and curriculum) as well as the evidence supporting prosocial education. In my opinion, we are making too many education policy decisions based upon not enough research or research that needs more research (replication). I think part of this is due to the publish-or-perish mandate that many in academia are forced to work under. It is much easier and more efficient to produce and publish a great number of small studies than it is to truly adopt a research agenda and stay focused on that agenda for quite some time while still producing the publications required for tenure and promotion. I think part of this approach to research, however, is due to the fact that as a society we are often directed and dictated by headlines. We read one headline saying “Study Finds Character Education to Be Ineffective,” and suddenly we believe that character education holds no value. As the evidence presented in this handbook suggests, this could not be further from the truth. Character education and the many prosocial efforts we have shared have great value. And though some of the studies might be methodologically or statistically challenged, it is the body of all of the evidence, the totality of decades of research, that must be the main point of consideration. When we consider the totality of the evidence, it becomes overwhelming and obvious that our education system must widen the focus of our efforts to move far beyond the academic tunnel vision we suffer from today.
Why did I spend the first half of this chapter focused on achievement scores? Now that is a good question. As I was writing I kept thinking about a bumper sticker my father had on one of his old dilapidated cars. The bumper sticker said, “If it works, don’t fix it.” I was lucky enough to be given this car when I was in college—and I say this with great sarcasm. This car was a piece of junk. Yet his idea of what constitutes “working” was much different from mine. It worked for him because it started, and though shaky and stinky of burning oil (a sign that the engine was soon to explode), it got him to work every day. But once I had the car, I soon realized that this working car could not go faster than forty-five miles per hour without nearly falling apart and jumping off the road. The inside of the car reeked of years of neglect. I actually coached football during my college years at a local middle school. At first I was glad to receive the car, but then I realized it would cost more for me to fix it on a weekly basis, and it was more of a headache and an embarrassment than it would be if I just parked the car and went back to riding my bike. Just working is not enough. This is the education system we are stating that our future rests upon. Furthermore, the U.S. government is not my dad, and I am sure they have much more money and resources than a drug/alcohol counselor at the VA would have to upgrade the vehicle that can get us someplace tomorrow.
Yet despite our great amount of wealth and assets we hold as a country, we still underfund our education. And despite an underfunded education, the fulcrum our success as a nation rests upon, we still expect excellence. How can we give so little and expect so much? With undersupported teachers responsible for too many students in too few classrooms lacking today’s technology, air conditioning, and operational heating systems, we still continue to blame the teachers. With antiquated school buildings made of cinder block and surrounded by fencing resembling the architecture of the county jail, we blame school systems. Instead of fully funding our education system, we throw the cost back onto tax-paying citizens who are far too often voting down bond issues due to being strapped in a horrid economy. And still we say that our test scores are the biggest predictor of our country’s future success. As a result, we spend a large portion of the little monies we have on testing. If our kids’ test scores, the effectiveness of their teachers, and the climate of the school buildings are the predictor of our future success, why are we only putting 2.6 percent of our federal budget to education? The answer is politics and lobbyists. And we need you to help us help the powers that be to better understand what is needed to make real change in education. And as this handbook has shared, a stronger focus on prosocial education should be a part of this change.
Doing versus Being
For quite some time now, research has suggested that if we truly want to improve the quality and productivity of our learning environments we should focus on variables in education that measure “doing” and not focus as much on “being” (Bloom, 1976, 1980; Mood, 1970; Wolf, 1966). In other words, as Bloom and others proposed back during the decades when our education system was still actually considered to be one of the best in the world, we should focus on what our educators and students do and not as much on the outcome assessments telling us how well our students might be performing on tests. To me this makes good common sense.
When it comes to today’s data-driven side of education, however, too often school-level administrators and teachers are told what scores or statistics they will be responsible for rather than being provided with the scores and statistics they need to improve what they are responsible for (Corrigan et al., 2011). If you have ever tried to lose weight, you know that getting on the scale every morning and staring at the number will not help that number significantly improve. No matter how much we wish or pray we would lose weight, it does not happen until we actually do something. Now we could just adjust the scale so that it appears we lost weight, but that would not be right. You could also change your diet. And for some this will help. But though it might help you drop your weight, it might not help improve your health, cardiovascular fitness, or muscular definition. For most of us trying to get healthy (trying to get stronger and better), we have to change our diet, and we also have to change our daily routines. We often have to add different types of exercise to the schedule. We often need to eliminate unhealthy practices. In order to change our “being,” it is normally reliant upon changing what we are “doing” (Corrigan et al., 2011). If we want to figure out why our students are doing well or not so well on tests, it will require that we look at research on education-related variables and measures that go far beyond student test scores. This is where the body of evidence related to prosocial education can help.
For educational leaders who are growing frustrated with focusing on achievement and proficiency scores and long for the flexibility to get back to focusing on developing the whole child, this handbook is written to help them by presenting a more rational argument for how one can truly improve academic success, not to mention the satisfaction and effectiveness of teachers. This handbook holds many of the answers for educators who continue to look at their test scores and wish (and pray) they would improve. We wrote this handbook for the educational leaders who have embraced a new “diet” of curriculum that helped to improve things a little but did not get their schools to where they want them to be. We wrote this handbook to provide educators with an exercise regimen that helps them to focus on the prosocial side of education. And no matter how many times we “improve” or “renorm” the standardized tests (i.e., adjust the scale), from the static scores holding so many schools back from meeting the requirements of NCLB (100 percent proficiency), it would appear we need to widen the focus of our lens to once again encompass the prosocial side of education. If what we are doing is not changing the being of our test scores, we need to refocus on fixing what we are doing. As a friend of mine likes to quote one of those pithy Zen sayings, “Having lost sight of our goals, we must now redouble our efforts.”
References
Anderson, C. (1982). The search for school climate: A review of the research. Review of Educational Research, 53(3), 368–420.
Barton, P. E., & Coley, R. J. (2007).The family: America’s smallest school. Princeton, NJ: Educational Testing Services.
Battin-Pearson, S., Newcomb, M. D., Abbott, R. D., Hill, K. G., Catalano, R. F., & Hawkins, J. D. (2000). Predictors of early high school dropout: A test of five theories. Journal of Educational Psychology, 92, 568–582. doi:10.1037/0022-0663.92.3.568
Berliner, D., & Biddle, B. (1995). The manufactured crisis: Myths, fraud, and the attack on America’s public schools. Cambridge, MA: Perseus Books.
Bloom, B. S. (1976). Human characteristics and school learning. New York: McGraw-Hill.
Bloom, B. S. (1980).The new direction in educational research: Alterable variables. Phi Delta Kappan, 61, 382–385.
Boethel, M. (2003). Diversity: School, family, & community connections. Austin, TX: Southwest Educational Development Laboratory.
Burstein, L. (1980). The analysis of multilevel data in educational research and evaluation. In D. C. Berliner (Ed.), Review of research in education (Vol. 8, pp. 158–233). Washington, DC: American Educational Research Association.
Corrigan, M. W., Grove, D., & Vincent, P. F. (2011). Multi-dimensional education: A common sense approach to data-driven thinking. Thousand Oaks, CA: Corwin Press.
Darling-Hammond, L. (2010). What we can learn from Finland’s successful school reform. Washington, DC: National Education Association. Retrieved January 10, 2012, from http://www.nea.org/home/40991.htm
Darling-Hammond, L. (2011). The flat world and education: How America’s commitment to equity will determine our future. New York: Teachers College Press.
Durlak, J. A., Weissberg, R. P., Dymnicki, A. B., Taylor, R. D., & Schellinger, K. B. (2011). The impact of enhancing students’ social and emotional learning: A meta-analysis of school-based universal interventions. Child Developments, 82(1), 405–432.
Epstein, J. L. (1995). School/family/community partnerships: Caring for children we share. Phi Delta Kappan, 76, 701–712.
Epstein, M., Atkins, M., Cullinan, D., Kutash, K., & Weaver, R. (2008). Reducing behavior problems in the elementary school classroom: A practice guide (NCEE #2008-012). Washington, DC: National Center for Education Evaluation and Regional Assistance, Institute of Education Sciences, U.S. Department of Education. Retrieved November 25, 2011, from http://ies.ed.gov/ncee/wwc/publications/practiceguides
Fan, X., & Chen, M. (2001). Parental involvement and students’ academic achievement: A meta-analysis. Educational Psychology Review, 13, 1–22.
Flynn, J. R. (1999). Searching for justice: The discovery of IQ gains over time. American Psychologist, 54, 5–20.
Fusarelli, L. (2004). The potential impact of the No Child Left Behind Act on equity and diversity in American education. Educational Policy, 18(1), 71–94.
Hart, B., & Risley, R. T. (1995). Meaningful differences in the everyday experience of young American children. Baltimore, MD: Paul H. Brookes.
Henderson, A. T., & Mapp, K. L. (2002). A new wave of evidence: The impact of school, family, and community connections on student achievement. Austin, TX: Southwest Educational Development Laboratory.
Henry, K. L., Cavanagh, T. M., & Oetting, E. R. (2011). Perceived parental investment in school as a mediator of the relationship between socio-economic indicators and educational outcomes in rural America. Journal of Youth and Adolescence, 40(9), 1164–1177.
Horvat, E. M., Weininger, E. B., & Lareau, A. (2003). From social ties to social capital: Class differences in the relations between schools and parent networks. American Educational Research Journal, 40(2), 319–351.
Kruse, K. (1996). The effects of a low socioeconomic environment on a student’s academic achievement (Research study submitted for the requirements of CNE 579, Research in Education). Huntsville, TX: Sam Houston State University. (ERIC Document Reproduction Service No. ED 402380). Retrieved January 18, 2012, from http://www.eric.ed.gov/PDFS/ED402380.pdf
Lee, S., Daniels, M., Puig, A., Newgent, R. A., & Nam, S. (2008). A data-based model to predict postsecondary educational attainment of low-socioeconomic-status students. Professional School Counseling, 11(5), 306–316.
Levin, H. M. (1970). A new model of school effectiveness: A report on recent research on pupil achievement. Stanford, CA: Stanford Center for Research and Development on Teaching, Stanford University. (ERIC Document Reproduction Service No. ED 040 252)
Lynn, R., Meisenberg, G., Mikk, J., & Williams, A. (2007). National IQs predict differences in scholastic achievement in 67 countries. Journal of Biosocial Science, 39(6), 861–874.
McCabe, C. (2010, December 9). The economics behind international education rankings. NEA Today. Retrieved January 3, 2011, from http://neatoday.org/2010/12/09/a-look-at-the-economic-numbers-on-international-education-rankings
McNeal, R. B., Jr. (1999). Parental involvement as social capital: Differential effectiveness on science achievement, truancy, and dropping out. Social Forces, 78(1), 117–144.
Mitchell, C. (2008). Parent involvement in public education: A literature review. Philadelphia: Research for Action. Retrieved October 17, 2010, from http://www.maine.gov/education/speced/tools/b8pi/reports/review.pdf
Mood, A. M. (1970, February). Do teachers make a difference? Washington, DC: U.S. Office of Education, Bureau of Educational Professions Development. (ERIC Document Reproduction Service No. ED 040 253)
National Center for Education Statistics. (2011). National Assessment of Educational Progress. Washington, DC: Author. Retrieved January 24, 2012, from http://nces.ed.gov/nationsreportcard
National Center for Fair and Open Testing. (2011). Would foreign students score proficient on NAEP? Jamaica Plain, MA: Author. Retrieved December 28, 2011, from: http://fairtest.org/would-foreign-students-score-proficient-naep
Obama, B. (2011, January 25). State of the Union address. Washington, DC: White House. Retrieved December 29, 2011, from http://www.whitehouse.gov/the-press-office/2011/01/25/remarks-president-state-union-address
Organisation for Economic Co-operation and Development. (2011a). What can parents do to help their children succeed in school? Paris: Author. Retrieved from http://www.pisa.oecd.org/dataoecd/4/1/49012097.pdf
Organisation for Economic Co-operation and Development. (2011b). What PISA is. Paris: Author. Retrieved December 27, 2011, from http://www.pisa.oecd.org/pages/0,3417,en_32252351_32235907_1_1_1_1_1,00.html
Organisation for Economic Co-operation and Development. (2012). Programme for international student assessment. Paris: Author. Retrieved January 31, 2012, from http://www.oecd.org/department/0,3355,en_2649_35845621_1_1_1_1_1,00.html
Ormrod, J. E. (2006). Essentials for educational psychology. Columbus, OH: Pearson.
Paulson, A. (2010, December 7). US students halt academic “free-fall,” but still lag in global testing. Christian Science Monitor. Retrieved December 23, 2011, from http://www.csmonitor.com/USA/Education/2010/1207/US-students-halt-academic-free-fall-but-still-lag-in-global-testing/%28page%29/2
Peterson, P. E., & Hess, F. M. (2008). Few states set world class standards. Education Next, 8(3), 70–73.
Popham, J. (2001). The truth about testing: An educator’s call to action. Alexandria, VA: Association for Supervision and Curriculum Development.
Rosenberger, B. (2008, March 21). Study: State must improve test scores. Herald-Dispatch. Retrieved January 18, 2012, from: http://www.herald-dispatch.com/news/x2087241981
Sahlberg, P. (2009). Educational change in Finland. In A. Hargreaves, M. Fullan, A. Lieberman, & D. Hopkins (Eds.), International handbook of educational change (pp. 1–28). New York: Springer.
Sahlberg, P. (2011). Finnish lessons: What can the world learn from educational change in Finland? New York: Teachers College Press.
Sheldon, S. B., & Epstein, J. L. (2005). Involvement counts: Family and community partnerships and mathematics achievement. Journal of Educational Research, 98(4), 196–206.
Simonton, D. K. (2001). Talent development as a multidimensional, multiplicative, and dynamic process. Current Directions in Psychological Science, 10, 39–42.
Skinner, B. F. (1969). Contingencies of reinforcement. New York: Appleton-Century-Crofts.
Spoth, R., Randall, G. K., & Shin, C. (2008). Increasing school success through partnership-based family competency training: Experimental study on long-term outcomes. School Psychology Quarterly, 23(1), 70–89.
Stanat, P., Artelt, C., Baumert, J., Klieme, E., Neubrand, M., Prenzel, M., et al. (2002). PISA 2000: Overview of the study design, method and results. Berlin, Germany: Max Planck Institute for Human Development. Retrieved January 18, 2012, from http://www.mpib-berlin.mpg.de/Pisa/PISA-2000_Overview-2.pdf
Stotsky, S., & Wurman, Z. (2010, July). Common core standards still don’t make the grade: Why Massachusetts and California must regain control over their academic destinies (White Paper No. 65). Boston: Pioneer Institute.
Strauss, V. (2011, November). What the new NAEP test results tell us. Washington Post. Retrieved December 28, 2011, from http://www.washingtonpost.com/blogs/answer-sheet/post/what-the-new-naep-test-results-really-tell-us/2011/11/01/gIQADSOtcM_blog.html
Swearer, S. M., Espelage, D. L., Vaillancourt, T., & Hymel, S. (2010). What can be done about school bullying? Linking research to educational practice. Educational Researcher, 39, 38–47.
Symonds, W. C., Schwartz, R., & Ferguson, R. F. (2011). Pathways to prosperity: Meeting the challenge of preparing young Americans for the 21st century. Cambridge, MA: Pathways to Prosperity Project, Harvard University Graduate School of Education.
Tonn, J. L. (2005, June 8). Keeping in touch. Education Week.
Uguroglu, M. E., & Walberh, H. J. (1979). Motivation and achievement: A quantitative synthesis. American Education Research Journal, 16(4), 375–389.
University of New Hampshire. (2008, May 27). Parental involvement strongly impacts student achievement. Science Daily. Retrieved January 18, 2012, from http://www.sciencedaily.com/releases/2008/05/080527123852.htm
University of Pennsylvania. (2011, April 26). Penn research demonstrates motivation plays a critical role in determining IQ test scores. Penn News. Retrieved January 19, 2011, from http://www.upenn.edu/pennnews/news/penn-research-demonstrates-motivation-plays-critical-role-determining-iq-test-scores
Usher, A. (2011, April 28). Update with 2009–10 data and five-year trends: How many schools have not made adequate yearly progress? Washington, DC: Center on Education Policy. Retrieved January 10, 2012, from http://www.cep-dc.org/displayDocument.cfm?DocumentID=357
Wolf, R. (1966). The measurement of environments. In A. Anastasi (Ed.), Testing problems in perspective (pp. 491–503). Washington, DC: American Council on Education.
Wynne, E. (1972). The politics of school accountability. Richmond, CA: McCutchan Publishing.