CHAPTER FOUR
Putting the Building to Work for You
I am persuaded that no common air from without is so unwholesome as the air within a close room that has been often breathed and not changed.
—BENJAMIN FRANKLIN
BUSINESSES ARE IN A GLOBAL competition for talent. How do you attract the best and brightest, and how do you retain them? Then, once you’ve hired them, how do you give them the opportunity to perform their best? It turns out that your building has a role to play in all of this, acting as a differentiator for recruitment and retention and optimizing employee productivity. From an individual point of view, what environment helps you be “the best you”?
In Chapter 3 we saw that time spent indoors is a big driver of health, and that the human capital in buildings is the biggest driver of business costs. We argue, then, that the person who manages your building has a bigger impact on your health than your doctor. And this person just may have as big an impact on your bottom line as your CFO.
The natural follow-on question is, What specific actions can we perform to start putting our building to work for us? The answer is literally right under our noses.
Tomes have been written with tips and tricks for improving worker productivity—standing meetings, work-from-home strategies, employee bonuses, and engagement programs, to name just a few. What’s always missing from this list is the easiest one: the impact of air quality on worker productivity.
Let’s look at one critical factor: the amount of fresh air being supplied to people. In many of the hundreds of forensic investigations of sick buildings that Joe was involved in, the root cause of the problem could be traced to inadequate ventilation. In fact, in 100 percent of those cases, even if ventilation wasn’t the root cause, it had to be fully understood to solve the problem.
When we talk about ventilation, we are talking about the amount of fresh air brought into a building—outdoor air ventilation. Decades of research have shown that ventilation is a key determinant of health indoors. But we didn’t really need decades of research to know this when we’ve known it anecdotally for hundreds of years. As Benjamin Franklin once professed, “I considered fresh air an enemy and closed with extreme care every crevice in the room I inhabited. Experience has convinced me of my error. I am persuaded that no common air from without is so unwholesome as the air within a close room that has been often breathed and not changed.”1
Ventilation and Cognitive Function: The COGfx Study
Take recent work by Joe’s Healthy Buildings research team that examined the effect of air quality on cognitive function, a useful indicator of productivity in knowledge workers. In the COGfx Study, a study that was simple in concept but sophisticated in design, we enrolled office workers to spend six days over two weeks with us in a highly controlled, simulated office environment at the Syracuse Center of Excellence. We asked them to show up at this office space instead of their regular offices and spend their nine-to-five day with us, doing their normal work routines.2
What is unique and interesting about this study is that each day, without their knowing, we changed the air quality in that office space in subtle ways. This was very much akin to an animal lab study in which different things are injected into the cage, except this time we did it with humans. (Lest you be concerned with this “humans as guinea pigs” study, this testing was governed by Harvard’s Institutional Review Board, which makes sure study participants are protected in public health research. All of our protocols were reviewed and approved by the board, and at no time was anyone placed in a condition that would even remotely be considered dangerous to his or her health.)
At the end of each day, we administered a cognitive function test while the subjects were still in their offices. This test was developed by Usha Satish and her colleagues at the State University of New York Upstate Medical Center and has been used on thousands of participants. It allowed us to quantify performance across nine cognitive function domains. We’re pretty sure you’ll agree that this is a list of performance skills that are relevant and valued in knowledge workers:
- Basic activity level
- Applied activity level
- Focused activity level
- Task orientation
- Crisis response
- Information seeking
- Information usage
- Breadth of approach
- Strategy
Each person was compared with him- or herself—we didn’t really care if John scored higher than Joe. We just cared how people scored against their own baselines. Importantly, this was what we call a double-blind study: the participants didn’t know how we changed the air in the room each day, and the data analysts weren’t aware, either.
So what did we change about the air each day? We tested the impact of three different factors on cognitive function performance: ventilation, volatile organic compounds (VOCs), and carbon dioxide. To be clear, we didn’t test exotic conditions or weird VOCs—we tested levels of these three factors that are or can be encountered in nearly every building. For ventilation, we tested what would happen if we doubled the ventilation rate from the current standard.
When workers were in an optimized indoor environment (“green+” in this figure), meaning high ventilation rates, low VOCs, and low carbon dioxide, we found a dramatic improvement in higher-order cognitive function across all nine cognitive function domains.
Think about that for one second—simply increasing the amount of air brought into an office, something nearly every office can easily do, had a quantifiable benefit to higher-order cognitive function in knowledge workers. When John Mandyck, the CEO of Urban Green Council, saw these results, he immediately grasped their economic significance. He recognized that, unlike rolling out a new enterprise-wide system to improve worker performance, where it can take a year or more to see results once everyone is trained, there was no learning curve for the COGfx Study—all you had to do was breathe. Even better, from a practical standpoint, VOCs and carbon dioxide can largely be controlled in a building through higher ventilation rates.
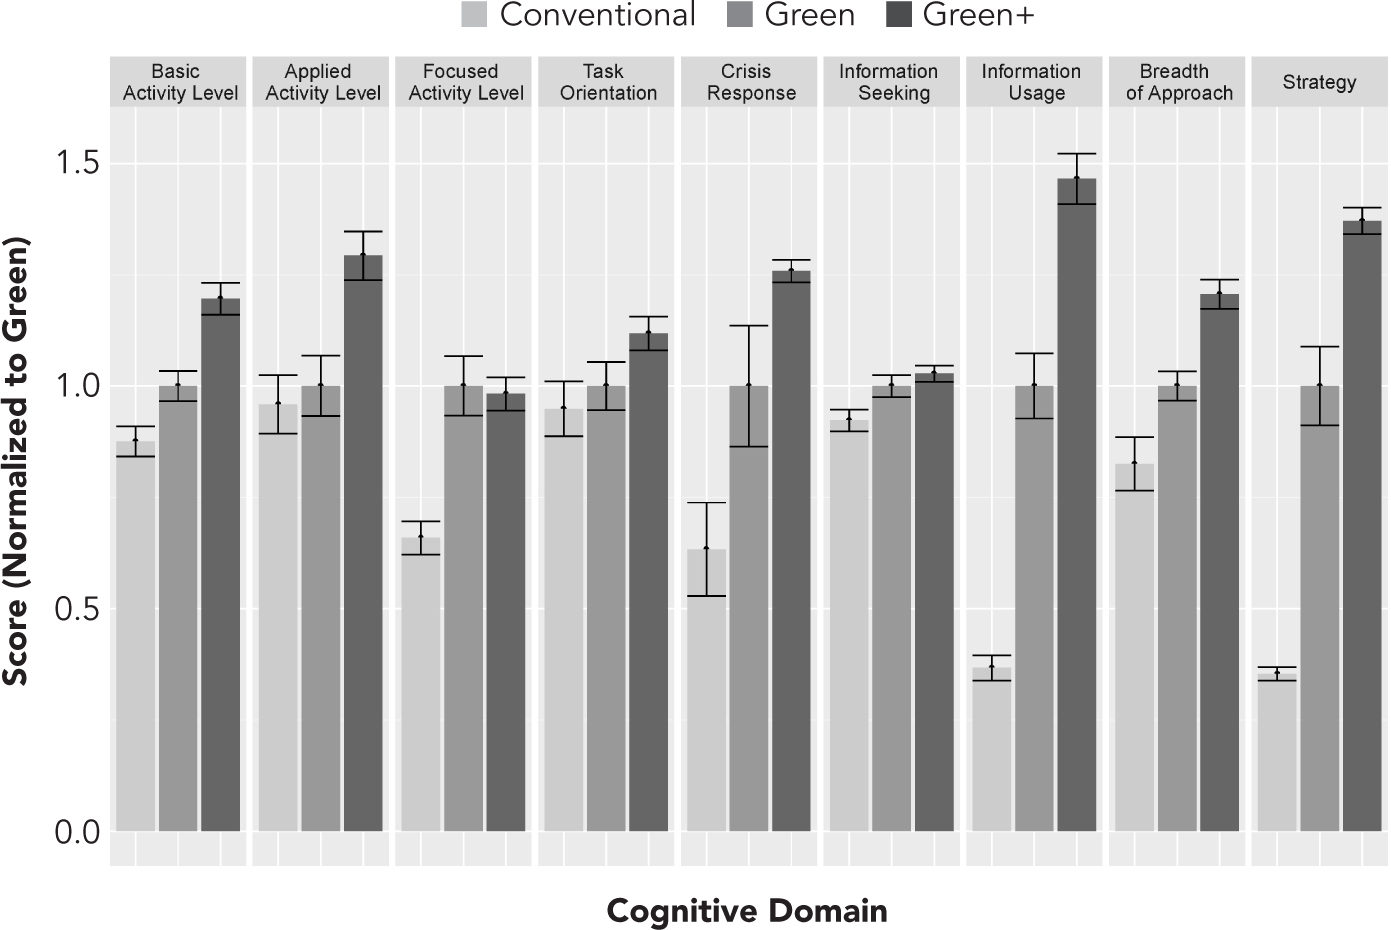
FIGURE 4.1 Cognitive function test scores for nine domains across three building conditions. Reformatted from Allen et al., “Associations of Cognitive Function Scores with Carbon Dioxide,” Environmental Health Perspectives 124, no. 6 (2016): 805–812, figure 1.
These results aren’t really all that surprising. Just like Ben Franklin, we have all experienced a poorly performing indoor environment. Ever get on an airplane in the middle of the day only to fall asleep immediately, even though you’re not tired? That’s because most planes do not have their ventilation system on at the gate. Ever feel sleepy in a stuffy conference room? Many are underventilated. Your mind focuses on the lack of air, the odors, the temperature, and … the clock. When that door finally opens, you can feel the life breathe back into the room.
All we did in our study was quantify the impact of what we have all experienced. Sometimes we think we are really just academics in the field of common sense. Casinos figured this out a long time ago, pumping in extra fresh air and keeping the temperature cool to keep you awake and at the gaming tables and slot machines longer.
The results of the COGfx Study were published in 2015 and immediately grabbed the attention of the commercial real estate press. The Wall Street Journal headline proclaimed, “Scientists Probe Indoor Spaces for Clues to Better Health,” and the New York Times celebrated as “A Greener, More Healthful Place to Work.” Even National Geographic, which traditionally focuses on the outdoor environment, ran a piece called “5 Surprising Ways Buildings Can Improve Our Health.” COGfx also landed on the cover of Newsweek, which went with a scare-tactic title—“Your Office Air Is Killing You”—complete with a picture of the grim reaper at the water cooler. We mention this not to brag about the reach of our research but rather to illustrate just how much the concept of objective measures of a Healthy Building is starting to permeate into the mainstream. These ideas are no longer exclusively confined to academic circles.
All of this attention from the commercial real estate sector inspired Joe to write an article for Harvard Business Review that quickly summarized the results of the study and identified the economic potential of Healthy Buildings (“Stale Office Air Is Making You Less Productive”).3 The goal was to engage and educate business executives on the link between indoor air and cognitive performance. But in truth, the results weren’t all that surprising to us. That’s because over the past 30 years, study after study has shown that the amount of fresh outdoor air brought inside—what’s known as ventilation—is a critical determinant of health. This steady stream of research has demonstrated that enhanced ventilation has been shown to reduce sick building syndrome, cut absenteeism, and even reduce infectious disease transmission.4
Acceptable Is Not Acceptable
What exactly is ventilation, and if the public health benefits are so clear, why are buildings chronically underventilated? The history is worth exploring here because it tells us how we got to this point and what we can do going forward. The invention of air-conditioning by Willis Carrier in 1902 forever altered how, when, and where we can work. The modern mechanical system governs how fresh air is brought into a building, how it is filtered for outdoor pollutants, how it is dehumidified (or humidified), how it is thermally conditioned, and how it is delivered to occupants. Most importantly, it governs not just how outdoor air is brought indoors but also how much outdoor air is brought in.
Some readers may be aware that there are industry-accepted guidelines as to how much outdoor air should be brought into a building. This is determined by a standard-setting body called the American Society of Heating, Refrigerating and Air-Conditioning Engineers (ASHRAE, pronounced “ash-ray”). But even those who know a lot about these standards seldom recognize that they have a critical flaw.
The ASHRAE standard is called “Ventilation for Acceptable Indoor Air Quality.”5 The key word here is “acceptable.” This is not a standard for “healthy” indoor air quality, nor is it a standard for “optimal” air quality. It is a bare-minimum standard, by name and definition. (ASHRAE is quick to acknowledge that it’s a minimum standard.)
Think about this for a minute. We have learned that ventilation is critical for health and productivity, yet nearly every indoor space where you spend your day—from multifamily homes to offices to restaurants and schools—is guided by this minimum standard for ventilation, despite study after study showing the benefits of increasing ventilation above this minimum. This standard of “acceptable” is not acceptable!
The False Choice of “Energy versus Health”
How did we get to this point? Well, it’s been a 100-year odyssey. The “acceptable” ventilation rate has fluctuated up and down over the past few decades, trying to find a balance between energy conservation and comfort—in other words, between tightening up our buildings and increasing the amount of fresh air coming in. ASHRAE itself can’t seem to make up its mind on this point. For the past 30 years it’s been involved in an internal debate about whether it is a “health-based” standard, or whether it’s just about energy (its latest opinion is that yes, it’s health based).
For decades, ASHRAE has published “comfort tables” (or to be more technically accurate, psychrometric charts). The standard offered by these tables was created before it was easy to measure many of the components of air that we can look at today, such as particulates, metals, or gases like CO2. The intent was simply to target set points for temperature and humidity and to help engineers size and specify equipment that could deliver that temperature and humidity on most days of the year, with the exception of a few very hot or very cold days.
For the first hundred years or so of mechanical air-conditioning, this scale was well aligned with what humans perceived on their own: “I’m hot (or cold),” “It’s too humid (or too dry).” But our ability to assess what’s in the air we breathe, and to measure its impact beyond “I’m not shivering” or “I’m not perspiring,” has moved on as sensors and data management have advanced. For the most part, buildings have not moved on with that capability. They should.
We have this 100-year journey of ventilation rates fluctuating up and down, trading off health for energy. Where are we now? ASHRAE has settled on a recommended ventilation rate for commercial buildings of approximately 20 cubic feet per minute per person (cfm / person). In our COGfx Study we tested performance at 20 cfm / person and 40 cfm / person, and we saw significant benefits in cognitive ability across a wide range of functions from doubling the standard rate of ventilation.
Here’s another big problem with the current ASHRAE standard for acceptable indoor air quality. Nearly every building is designed to this minimum, because that is the standard. But it’s not uncommon to find that many buildings are not operating at the minimum standard. So not only is this a standard aiming for a mere acceptable level of indoor air quality, it is only a design standard, not an operating standard. All too often a building may be meeting this minimum acceptable level when the doors open on day 1, but by day 2, no one is verifying performance.
To put some numbers on this, consider the use of CO2 as a proxy for ventilation. (Indoor CO2 levels come largely from human respiration.) If you’re meeting the minimum ASHRAE standard, you should expect CO2 levels in an office to be less than 1,000 parts per million (ppm). It turns out that in many offices, CO2 levels creep above this threshold frequently. In one study of 100 nonproblem buildings in the United States, the 95th percentile CO2 concentration was about 1,500 ppm.6 This means that many buildings were above 1,000 ppm, and 5 percent of buildings were grossly missing the minimum ventilation standard—by a full 50 percent.
Low ventilation rates are not solely a problem in office buildings. It is common to find CO2 levels above 1,500 ppm or higher in schools.7 To put some specifics on this, Mark Mendell and colleagues at Lawrence Berkeley National Laboratory studied 162 classrooms across 28 elementary schools in California and found that the average CO2 concentration was above 1,500 ppm.8 (In one district the average was closer to 2,500 ppm.) California is not an aberration. In Texas, one in five schools tested had peak CO2 concentrations above 3,000 ppm.9 These are just two examples of dozens of studies showing similar findings. Taken together, the full body of scientific evidence paints a problematic picture—up to 90 percent of schools in the United States are not meeting the minimum ventilation standards.
The same low ventilation can be found in your bedroom at night, your car, and most airplanes. Side note on airplanes (another indoor environment that also follows design-based, not performance-based, guidance on ventilation rates from ASHRAE): Joe and colleagues studied airplane cabin air quality as part of an FAA-funded Center of Excellence. Our measurements of CO2 in airplanes show that it can reach as high as 2,500 ppm during boarding (1,500 ppm was typical at cruising altitude).10 This may help explain why you may find yourself falling asleep after boarding, even in the middle of the day. Perhaps more interesting, after seeing the results of the COGfx Study, Joe and his team did a similar study but this time with airplane pilots and flight simulators. In that study, varying levels of CO2 were injected into the cockpit of a flight simulator while active commercial airline pilots were challenged with 21 simulated advanced flight maneuvers, like avoiding a midair collision, aborting a takeoff after an engine fire, or landing the plane with one engine inoperative. The result: pilots were more likely to fail these advanced maneuvers when CO2 concentrations were elevated in the cockpit.11
In short, all day long we find ourselves in environments that fail to meet even minimum acceptable ventilation rates, and the scientific evidence shows that this is impacting our performance.
The Impacts of Higher Ventilation on Your Income Statement
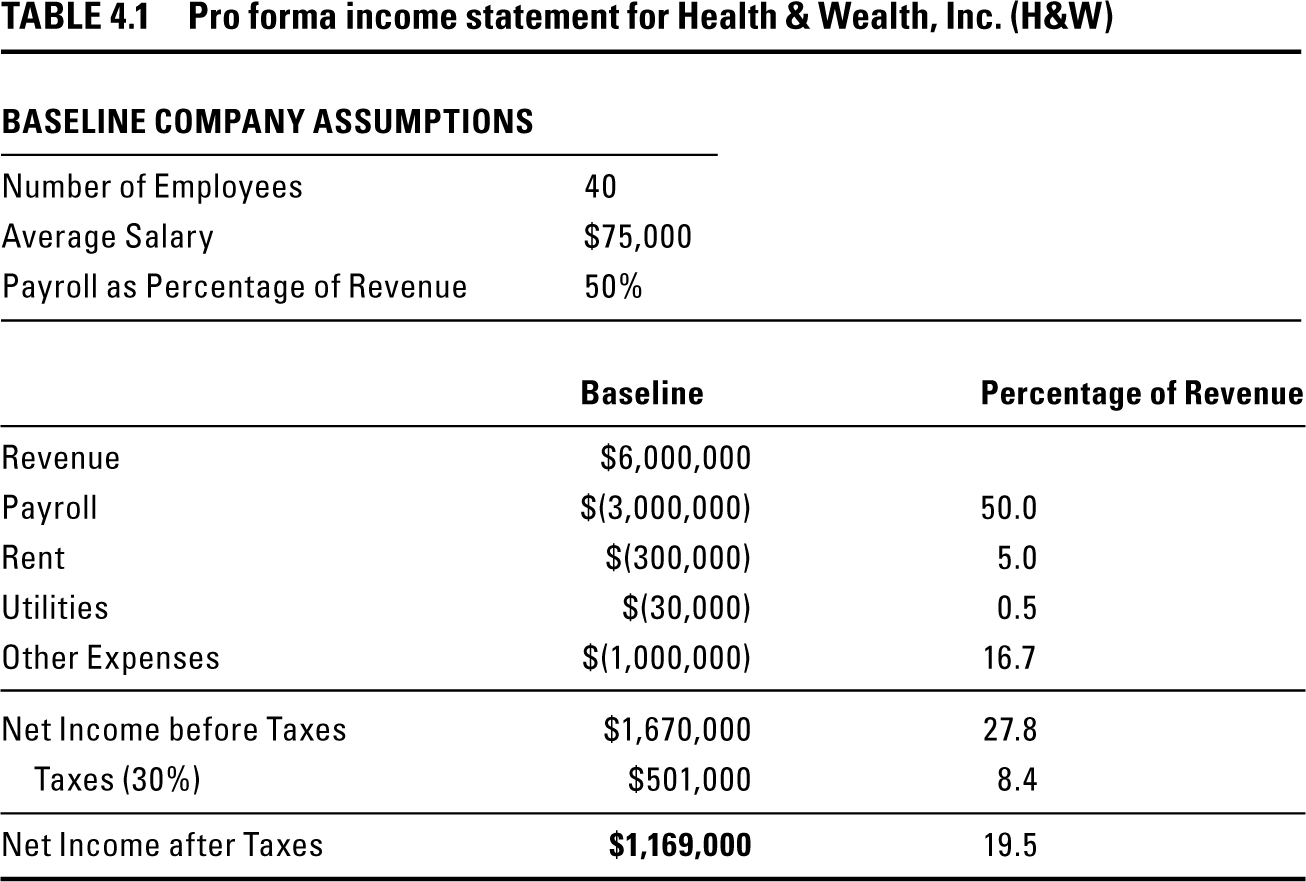
We want to show you what the science on ventilation rates interlaced with measurable cognition results (notably focus, information usage, and strategy) all means for your business. To do that, let’s take a hypothetical 40-person consulting company, Health and Wealth, Inc. (H&W). Here is an illustrative pro forma income statement.
|
TABLE 4.1 Pro forma income statement for Health & Wealth, Inc. (H&W) |
|||
|
BASELINE COMPANY ASSUMPTIONS |
|||
|
Number of Employees |
40 |
||
|
Average Salary |
$75,000 |
||
|
Payroll as Percentage of Revenue |
50% |
||
|
Baseline |
Percentage of Revenue |
|||
|
Revenue |
$6,000,000 |
|||
|
Payroll |
$(3,000,000) |
50.0 |
||
|
Rent |
$(300,000) |
5.0 |
||
|
Utilities |
$(30,000) |
0.5 |
||
|
Other Expenses |
$(1,000,000) |
16.7 |
||
|
Net Income before Taxes |
$1,670,000 |
27.8 |
||
|
Taxes (30%) |
$501,000 |
8.4 |
||
|
Net Income after Taxes |
$1,169,000 |
19.5 |
At H&W, as in many knowledge worker firms, payroll accounts for more than two-thirds of the firm’s total expenses. Returning to the 3-30-300 rule of thumb from Chapter 3, payroll is $3,000,000 per year; rent is $300,000 per year; and energy and utilities, at $30,000 per year, are a tiny item on the income statement at 0.5 percent. (In our example, revenue is modeled at two times payroll, although some service firms enjoy higher ratios.)
In the first era of green buildings, many companies focused most of their attention on energy efficiency. While that is a worthy quest, energy efficiency does not really contribute much to the bottom line of a typical office tenant.
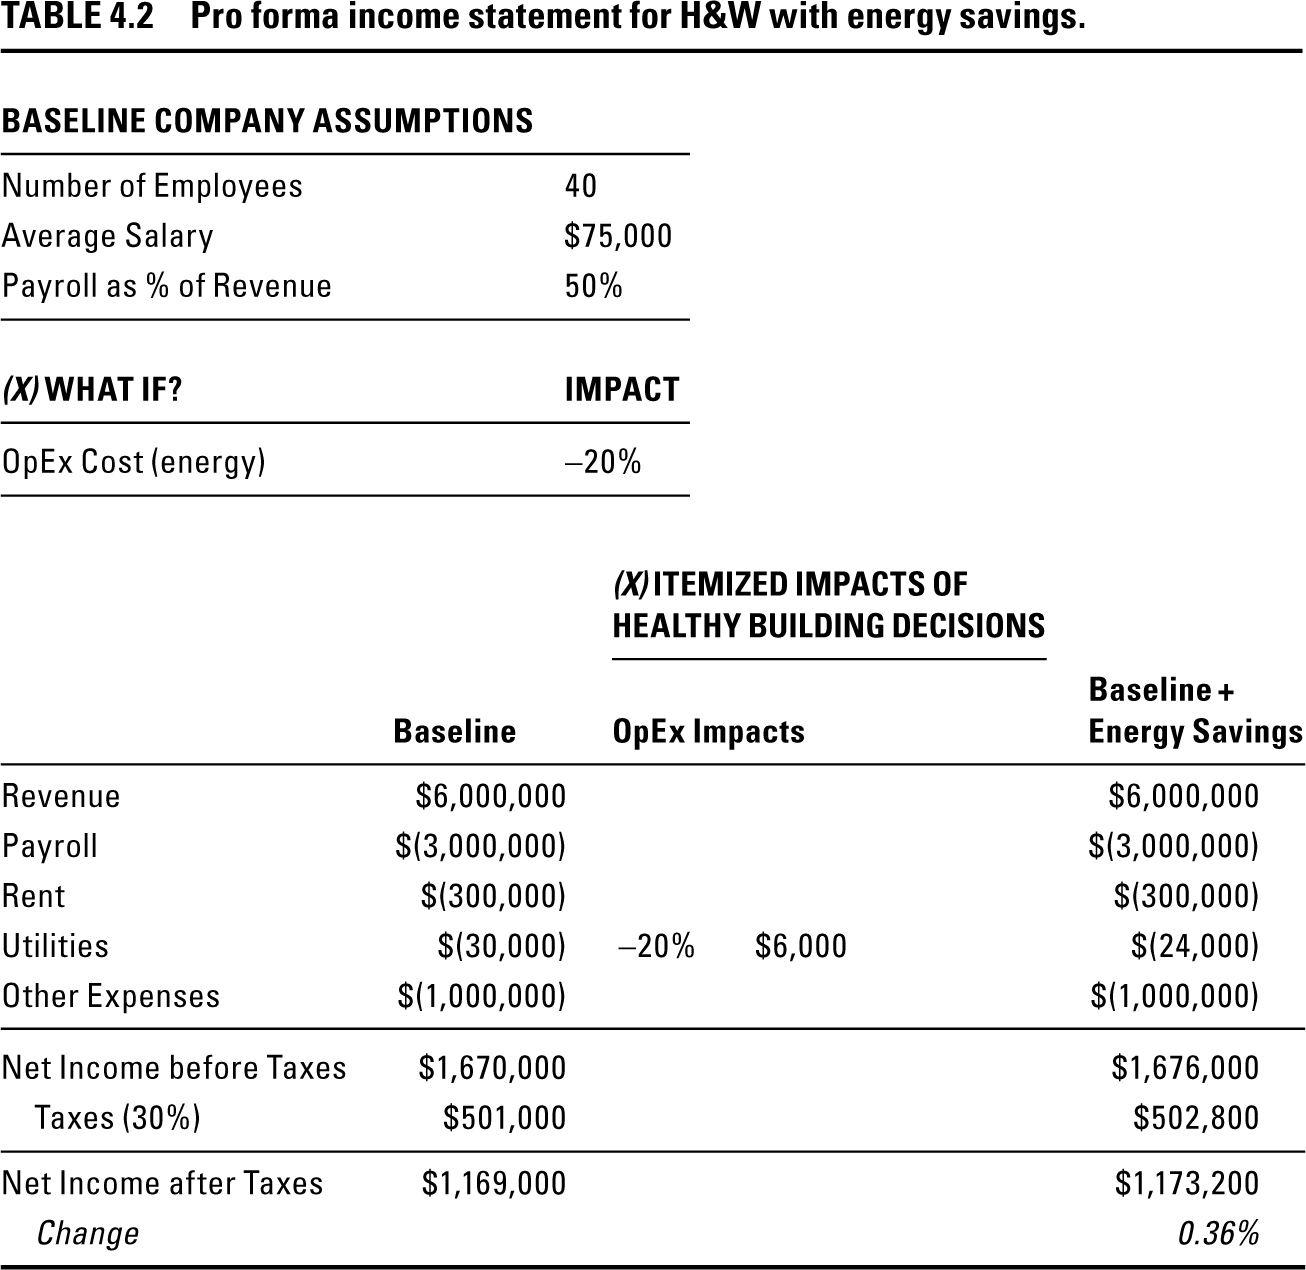
For example, what if the utility cost (mostly energy) at H&W is cut by a quite substantial 20 percent, as in our next example?
This changes the bottom line by less than half of one percent. No wonder many tenants don’t want to go through a lot of effort to seek these relatively minor savings when there are so many other things for office managers to worry about.
Now let’s look at some of the payroll-related items. After all, this is the largest single cost by far.
Starting with the cost side, suppose that these employees were a little healthier thanks to higher ventilation rates. If that’s the case, there should be fewer sick days. But are we making this up? Is there evidence for such an effect?
|
TABLE 4.2 Pro forma income statement for H&W with energy savings. |
|||
|
BASELINE COMPANY ASSUMPTIONS |
|||
|
Number of Employees |
40 |
||
|
Average Salary |
$75,000 |
||
|
Payroll as % of Revenue |
50% |
||
|
(X) WHAT IF? |
IMPACT |
||
|
OpEx Cost (energy) |
−20% |
||
|
(X) ITEMIZED IMPACTS OF HEALTHY BUILDING DECISIONS |
|||||||||
|
Baseline |
OpEx Impacts |
Baseline + Energy Savings |
|||||||
|
Revenue |
$6,000,000 |
$6,000,000 |
|||||||
|
Payroll |
$(3,000,000) |
$(3,000,000) |
|||||||
|
Rent |
$(300,000) |
$(300,000) |
|||||||
|
Utilities |
$(30,000) |
−20% |
$6,000 |
$(24,000) |
|||||
|
Other Expenses |
$(1,000,000) |
$(1,000,000) |
|||||||
|
Net Income before Taxes |
$1,670,000 |
$1,676,000 |
|||||||
|
Taxes (30%) |
$501,000 |
$502,800 |
|||||||
|
Net Income after Taxes |
$1,169,000 |
$1,173,200 |
|||||||
|
Change |
0.36% |
||||||||
It turns out that, yes, there is. This brings us to the work of Don Milton, professor of environmental health at the University of Maryland, who showed that healthier buildings were associated with 1.6 fewer days of absenteeism due to sickness each year.12 What constituted a “healthy building” in that study? You guessed it—higher ventilation rates.
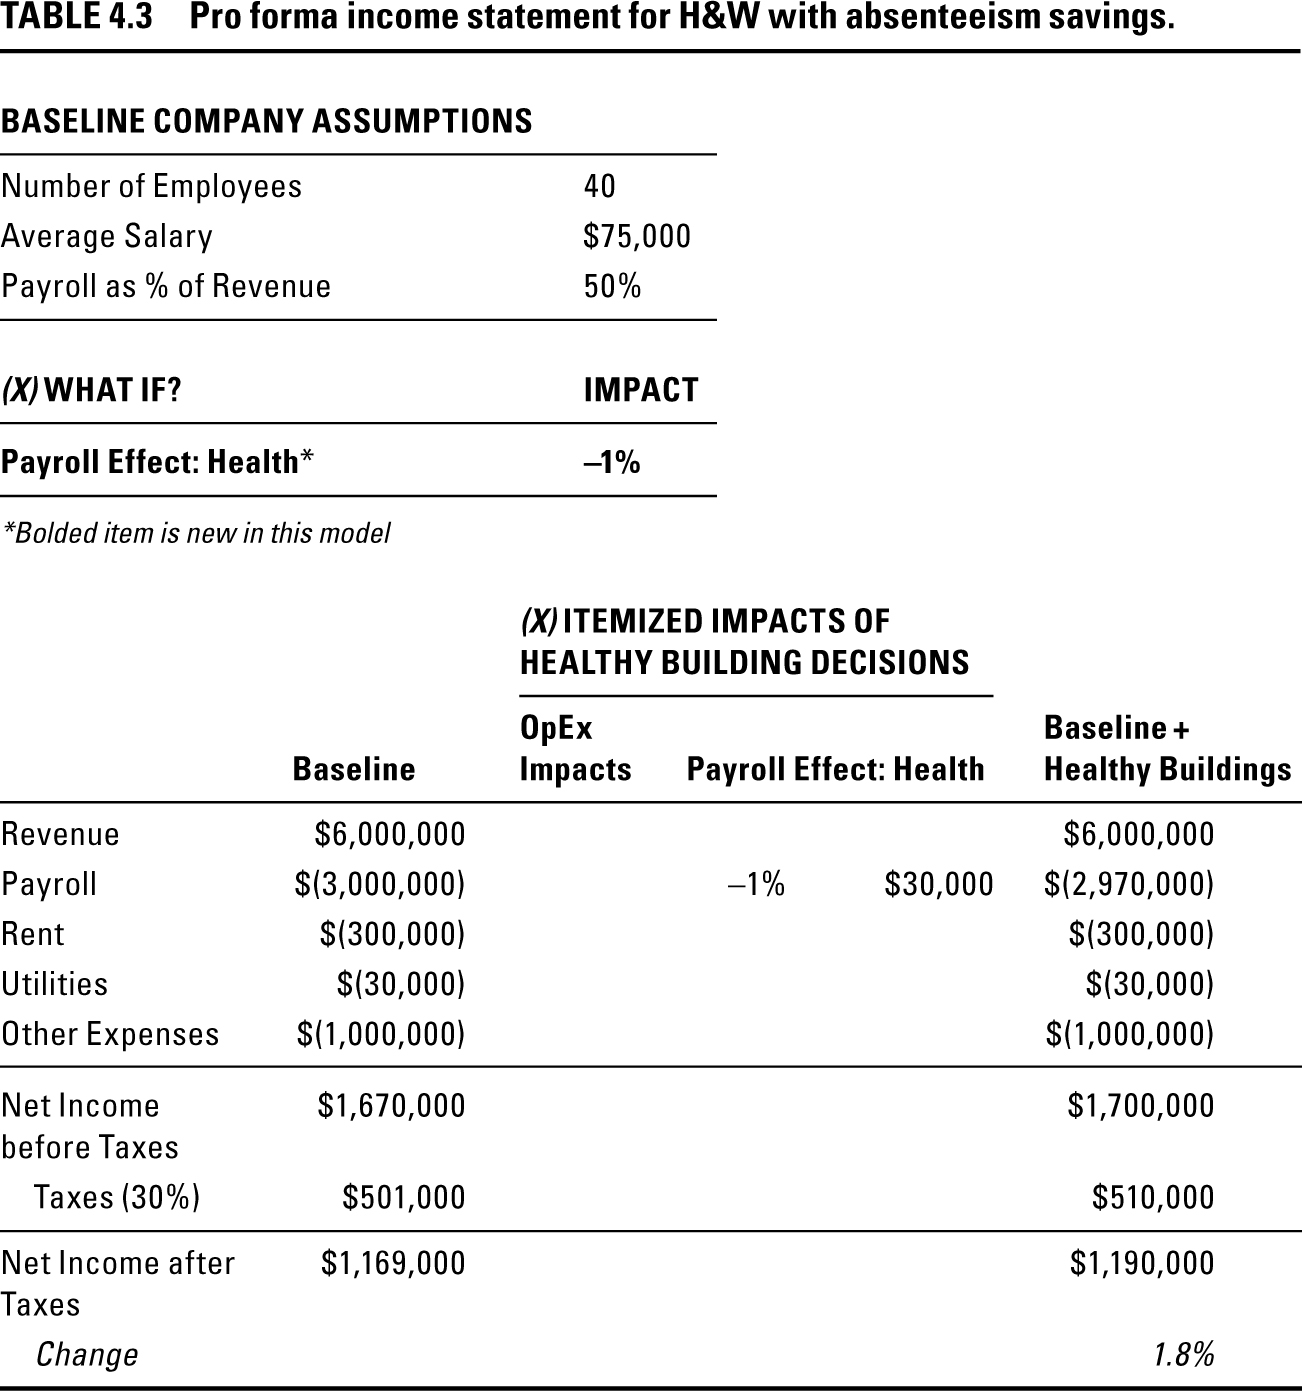
One way to look at this is in the context of about 250 workdays per year (50 weeks × 5 days per week = 250 days). Rounding up, if a worker has 2 fewer sick days, this is just about 1 percent of his or her total workdays for the year. Take a look at the income statement now with the added “Payroll Effect: Health,” which uses this 1 percent figure to help understand what this could mean to our hypothetical company, H&W.
|
TABLE 4.3 Pro forma income statement for H&W with absenteeism savings. |
|||
|
BASELINE COMPANY ASSUMPTIONS |
|||
|
Number of Employees |
40 |
||
|
Average Salary |
$75,000 |
||
|
Payroll as % of Revenue |
50% |
||
|
(X) WHAT IF? |
IMPACT |
||
|
Payroll Effect: Health* |
−1% |
||
|
*Bolded item is new in this model |
|||
|
(X) ITEMIZED IMPACTS OF HEALTHY BUILDING DECISIONS |
||||||||||
|
Baseline |
OpEx Impacts |
Payroll Effect: Health |
Baseline + Healthy Buildings |
|||||||
|
Revenue |
$6,000,000 |
$6,000,000 |
||||||||
|
Payroll |
$(3,000,000) |
−1% |
$30,000 |
$(2,970,000) |
||||||
|
Rent |
$(300,000) |
$(300,000) |
||||||||
|
Utilities |
$(30,000) |
$(30,000) |
||||||||
|
Other Expenses |
$(1,000,000) |
$(1,000,000) |
||||||||
|
Net Income before Taxes |
$1,670,000 |
$1,700,000 |
||||||||
|
Taxes (30%) |
$501,000 |
$510,000 |
||||||||
|
Net Income after Taxes |
$1,169,000 |
$1,190,000 |
||||||||
|
Change |
1.8% |
|||||||||
Even with this conservative estimate, the cost savings from avoided sick days already equals the total utility spend. And since the savings flow through to the bottom line, net income increases by almost 2 percent.
Now suppose that the documented improvements in thinking—notably in measurable cognitive domains like focused activity, information usage, and strategy—led to true revenue increases from more billable hours, more client assignments, and more engagements sold. This would be material for any business. In addition to the impact on cognitive function, others have conducted studies that estimate productivity gains of anywhere from 2 to 10 percent with better indoor air quality.13
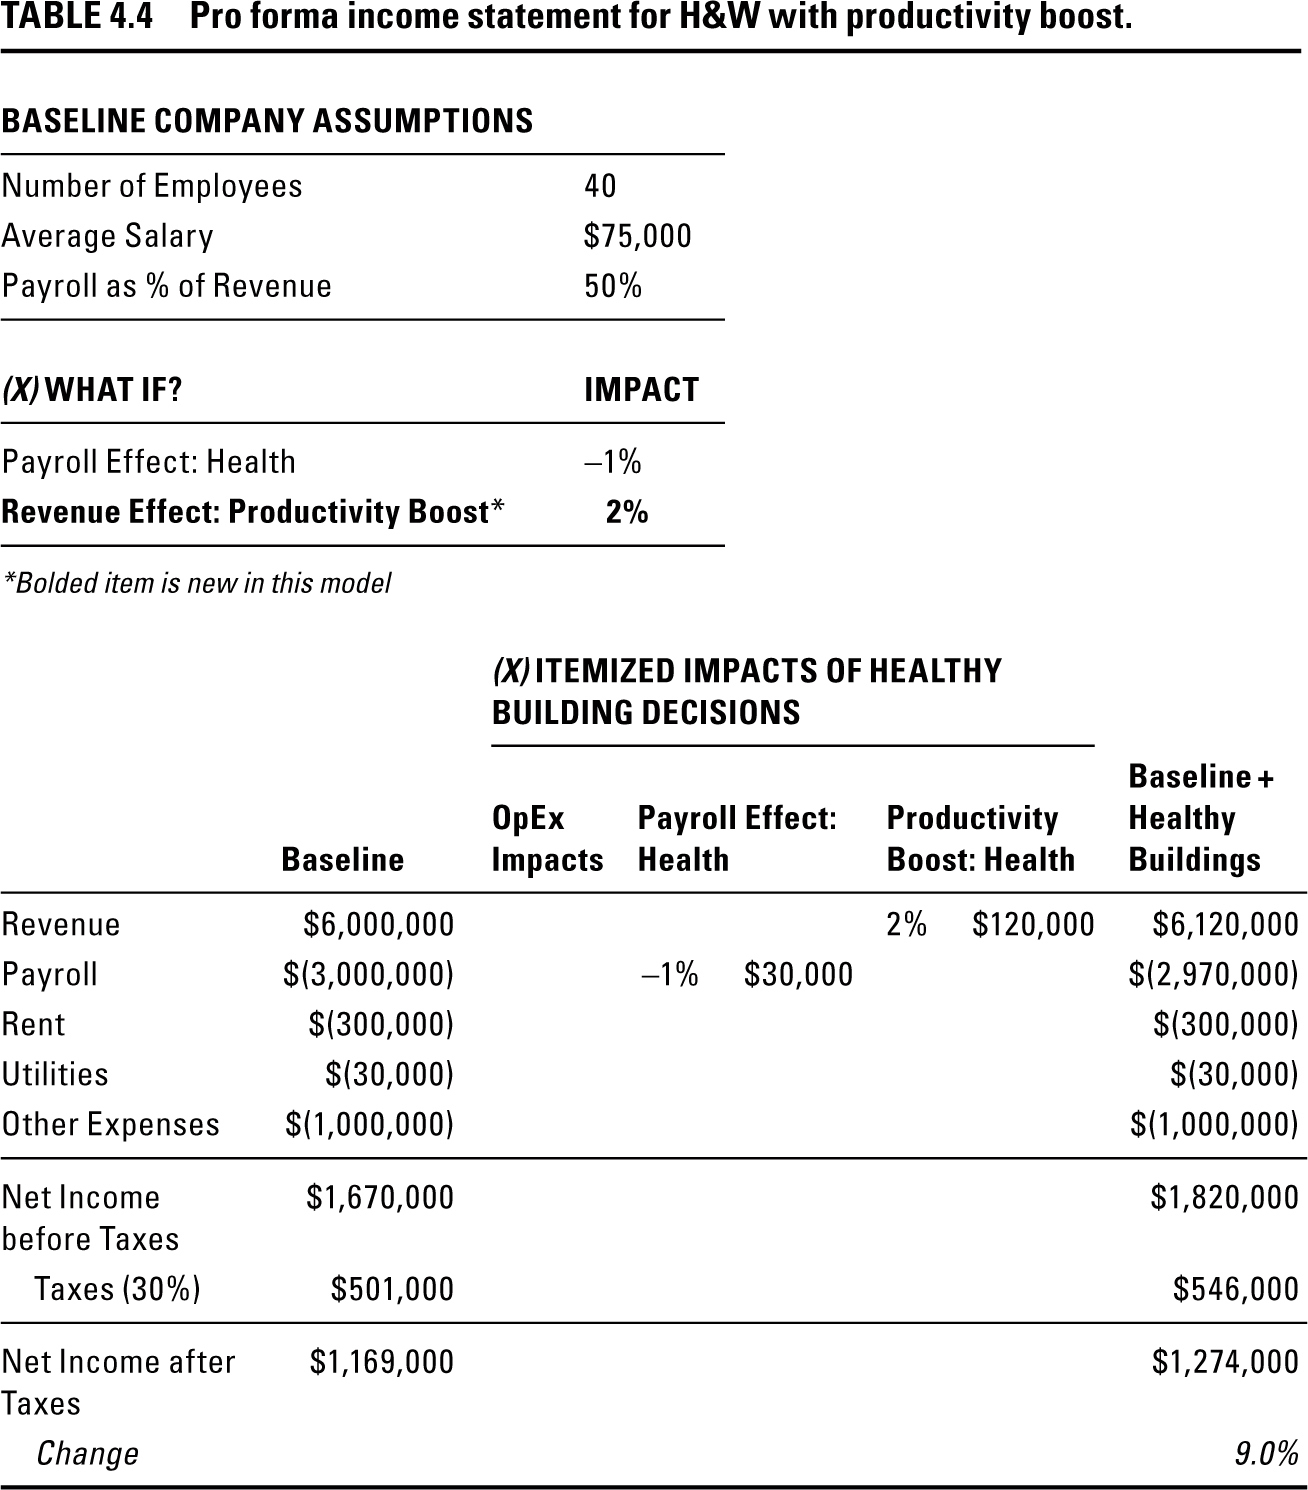
To return to our example, let’s take the low end and assume that just 2 percent of this added impact flows to the top line as a “productivity boost.” Improving this one aspect of a Healthy Building—ventilation—becomes a very substantial business advantage, increasing the bottom line by 9 percent.
|
TABLE 4.4 Pro forma income statement for H&W with productivity boost. |
|||
|
BASELINE COMPANY ASSUMPTIONS |
|||
|
Number of Employees |
40 |
||
|
Average Salary |
$75,000 |
||
|
Payroll as % of Revenue |
50% |
||
|
(X) WHAT IF? |
IMPACT |
||
|
Payroll Effect: Health |
−1% |
||
|
Revenue Effect: Productivity Boost* |
2% |
||
|
*Bolded item is new in this model |
|||
|
(X) ITEMIZED IMPACTS OF HEALTHY BUILDING DECISIONS |
||||||||||||||
|
Baseline |
OpEx Impacts |
Payroll Effect: Health |
Productivity Boost: Health |
Baseline + Healthy Buildings |
||||||||||
|
Revenue |
$6,000,000 |
2% |
$120,000 |
$6,120,000 |
||||||||||
|
Payroll |
$(3,000,000) |
−1% |
$30,000 |
$(2,970,000) |
||||||||||
|
Rent |
$(300,000) |
$(300,000) |
||||||||||||
|
Utilities |
$(30,000) |
$(30,000) |
||||||||||||
|
Other Expenses |
$(1,000,000) |
$(1,000,000) |
||||||||||||
|
Net Income before Taxes |
$1,670,000 |
$1,820,000 |
||||||||||||
|
Taxes (30%) |
$501,000 |
$546,000 |
||||||||||||
|
Net Income after Taxes |
$1,169,000 |
$1,274,000 |
||||||||||||
|
Change |
9.0% |
|||||||||||||
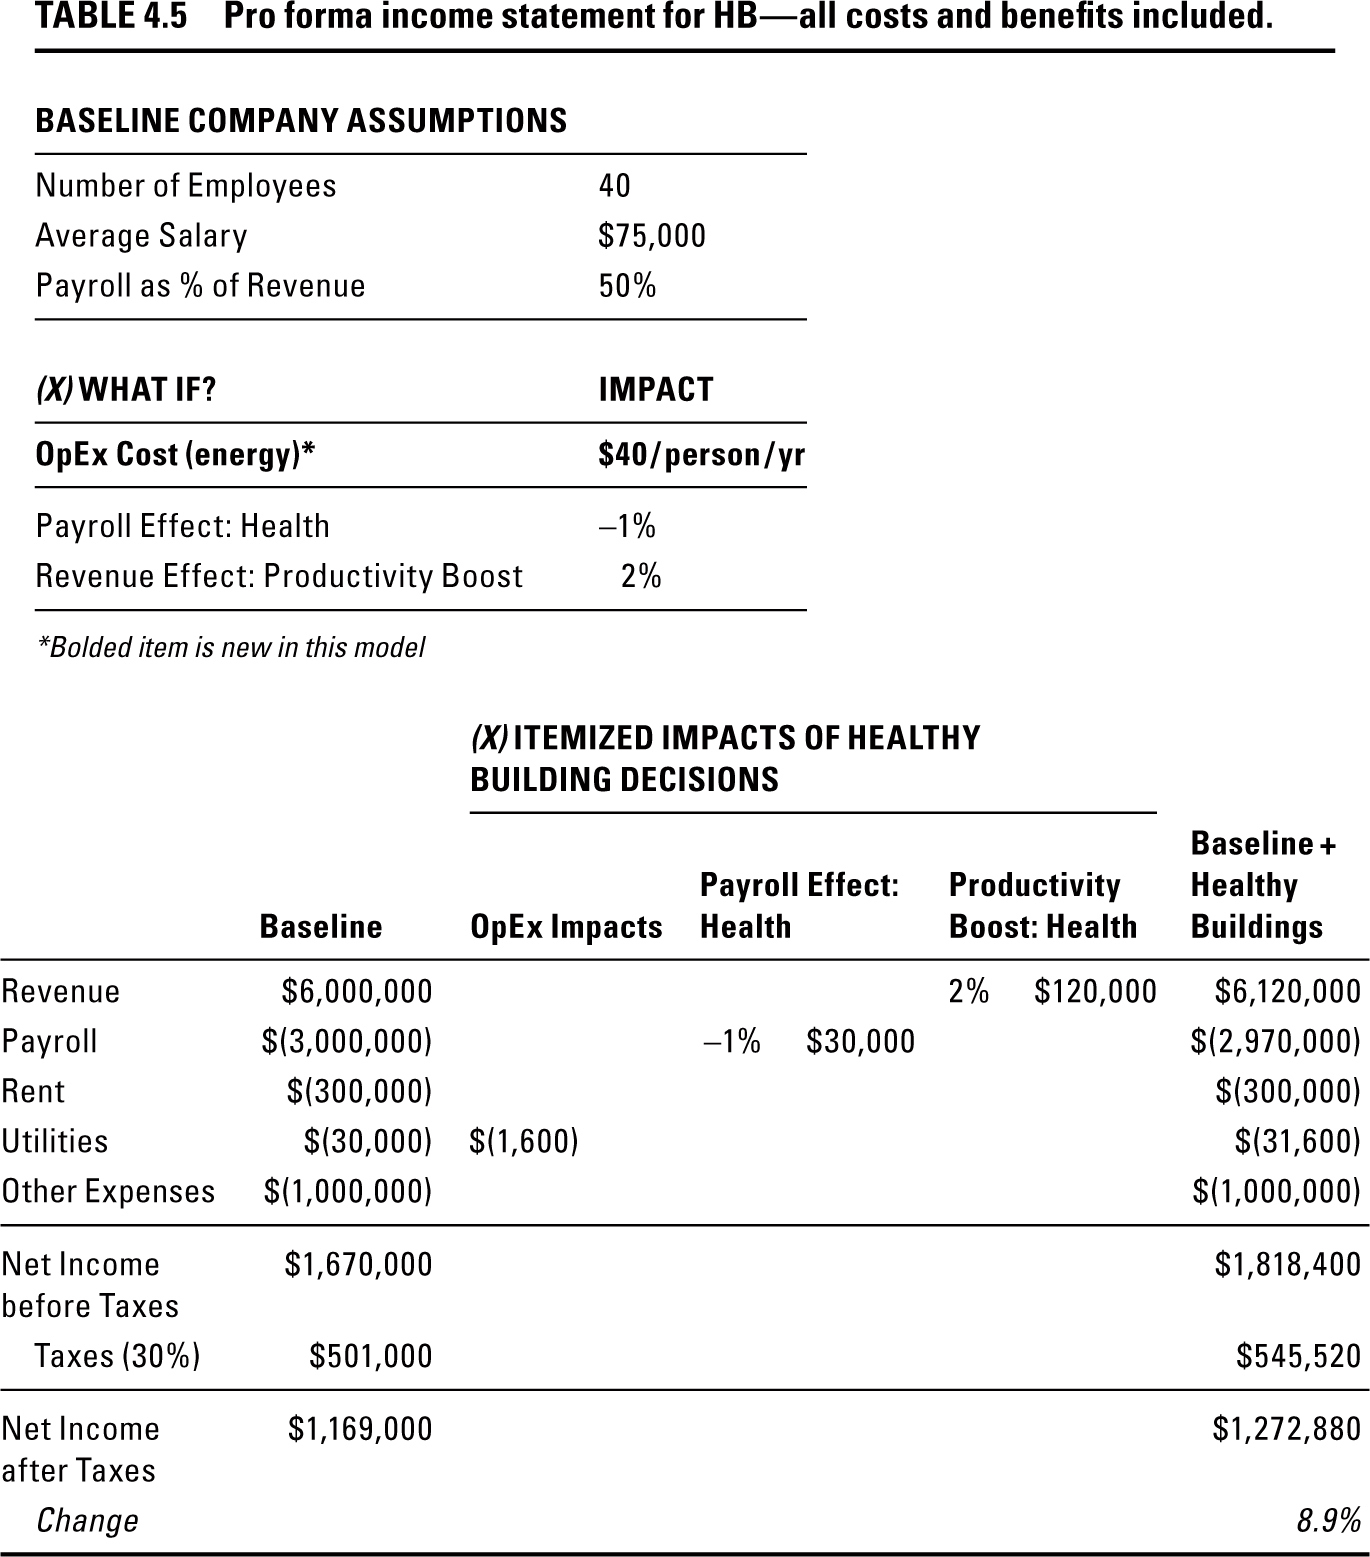
Let’s take this a step further. To ward off any energy conservation critics, a proper analysis would have to project a net increase in energy usage to achieve these gains. But what would a doubling of the ventilation rate cost in terms of energy? Research led by Joe’s Healthy Buildings program modeled the energy costs from increasing the ventilation rate from 20 cfm / person to 40 cfm / person in buildings across the continental United States to cover all climate zones and common building types. The worst-case scenarios, in the hottest or coldest climates, were $40 per person per year. (When a building uses energy-efficient technologies, that cost is usually driven down to single dollars per person per year.)14
|
TABLE 4.5 Pro forma income statement for HB—all costs and benefits included. |
|||
|
BASELINE COMPANY ASSUMPTIONS |
|||
|
Number of Employees |
40 |
||
|
Average Salary |
$75,000 |
||
|
Payroll as % of Revenue |
50% |
||
|
(X) WHAT IF? |
IMPACT |
||
|
OpEx Cost (energy)* |
$40 / person / yr |
||
|
Payroll Effect: Health |
−1% |
||
|
Revenue Effect: Productivity Boost |
2% |
||
|
*Bolded item is new in this model |
|||
|
(X) ITEMIZED IMPACTS OF HEALTHY BUILDING DECISIONS |
||||||||||||||||
|
Baseline |
OpEx Impacts |
Payroll Effect: Health |
Productivity Boost: Health |
Baseline + Healthy Buildings |
||||||||||||
|
Revenue |
$6,000,000 |
2% |
$120,000 |
$6,120,000 |
||||||||||||
|
Payroll |
$(3,000,000) |
−1% |
$30,000 |
$(2,970,000) |
||||||||||||
|
Rent |
$(300,000) |
$(300,000) |
||||||||||||||
|
Utilities |
$(30,000) |
$(1,600) |
$(31,600) |
|||||||||||||
|
Other Expenses |
$(1,000,000) |
$(1,000,000) |
||||||||||||||
|
Net Income before Taxes |
$1,670,000 |
$1,818,400 |
||||||||||||||
|
Taxes (30%) |
$501,000 |
$545,520 |
||||||||||||||
|
Net Income after Taxes |
$1,169,000 |
$1,272,880 |
||||||||||||||
|
Change |
8.9% |
|||||||||||||||
Suppose we assume that no energy efficiency measures were taken and that H&W increased the ventilation rate to 40 cfm / person and incurred that cost of $40 per person per year. This would cost the company $1,600 per year in additional operating expenses (OpEx). The net impact of higher ventilation rates would still be highly positive to the tenant occupier company.
|
TABLE 4.6 Pro forma income statement for H&W with benefits distributed to multiple parties. |
|||
|
BASELINE COMPANY ASSUMPTIONS |
|||
|
Number of Employees |
40 |
||
|
Average Salary |
$75,000 |
||
|
Payroll as % of Revenue |
50% |
||
|
(X) WHAT IF? |
IMPACT |
||
|
OpEx Cost (energy) |
$40 / person / yr |
||
|
Payroll Effect: Health |
−1% |
||
|
Revenue Effect: Productivity Boost |
2% |
||
|
Rent Increase* |
10% |
||
|
*Bolded item is new in this model |
|||
|
(X) ITEMIZED IMPACTS OF HEALTHY BUILDING DECISIONS |
||||||||||||||||
|
Baseline |
Rent / OpEx Impacts |
Payroll Effect: Health |
Productivity Boost: Health |
Baseline + Healthy Buildings |
||||||||||||
|
Revenue |
$6,000,000 |
2% |
$120,000 |
$6,120,000 |
||||||||||||
|
Payroll |
$(3,000,000) |
−1% |
$30,000 |
$(2,970,000) |
||||||||||||
|
Rent |
$(300,000) |
10% |
$(30,000) |
$(330,000) |
||||||||||||
|
Utilities |
$(30,000) |
$(1,600) |
$(31,600) |
|||||||||||||
|
Other Expenses |
$(1,000,000) |
$(1,000,000) |
||||||||||||||
|
Net Income before Taxes |
$1,670,000 |
$1,788,400 |
||||||||||||||
|
Taxes (30%) |
$501,000 |
$536,520 |
||||||||||||||
|
Net Income after Taxes |
$1,169,000 |
$1,251,880 |
||||||||||||||
|
Change |
7.1% |
|||||||||||||||
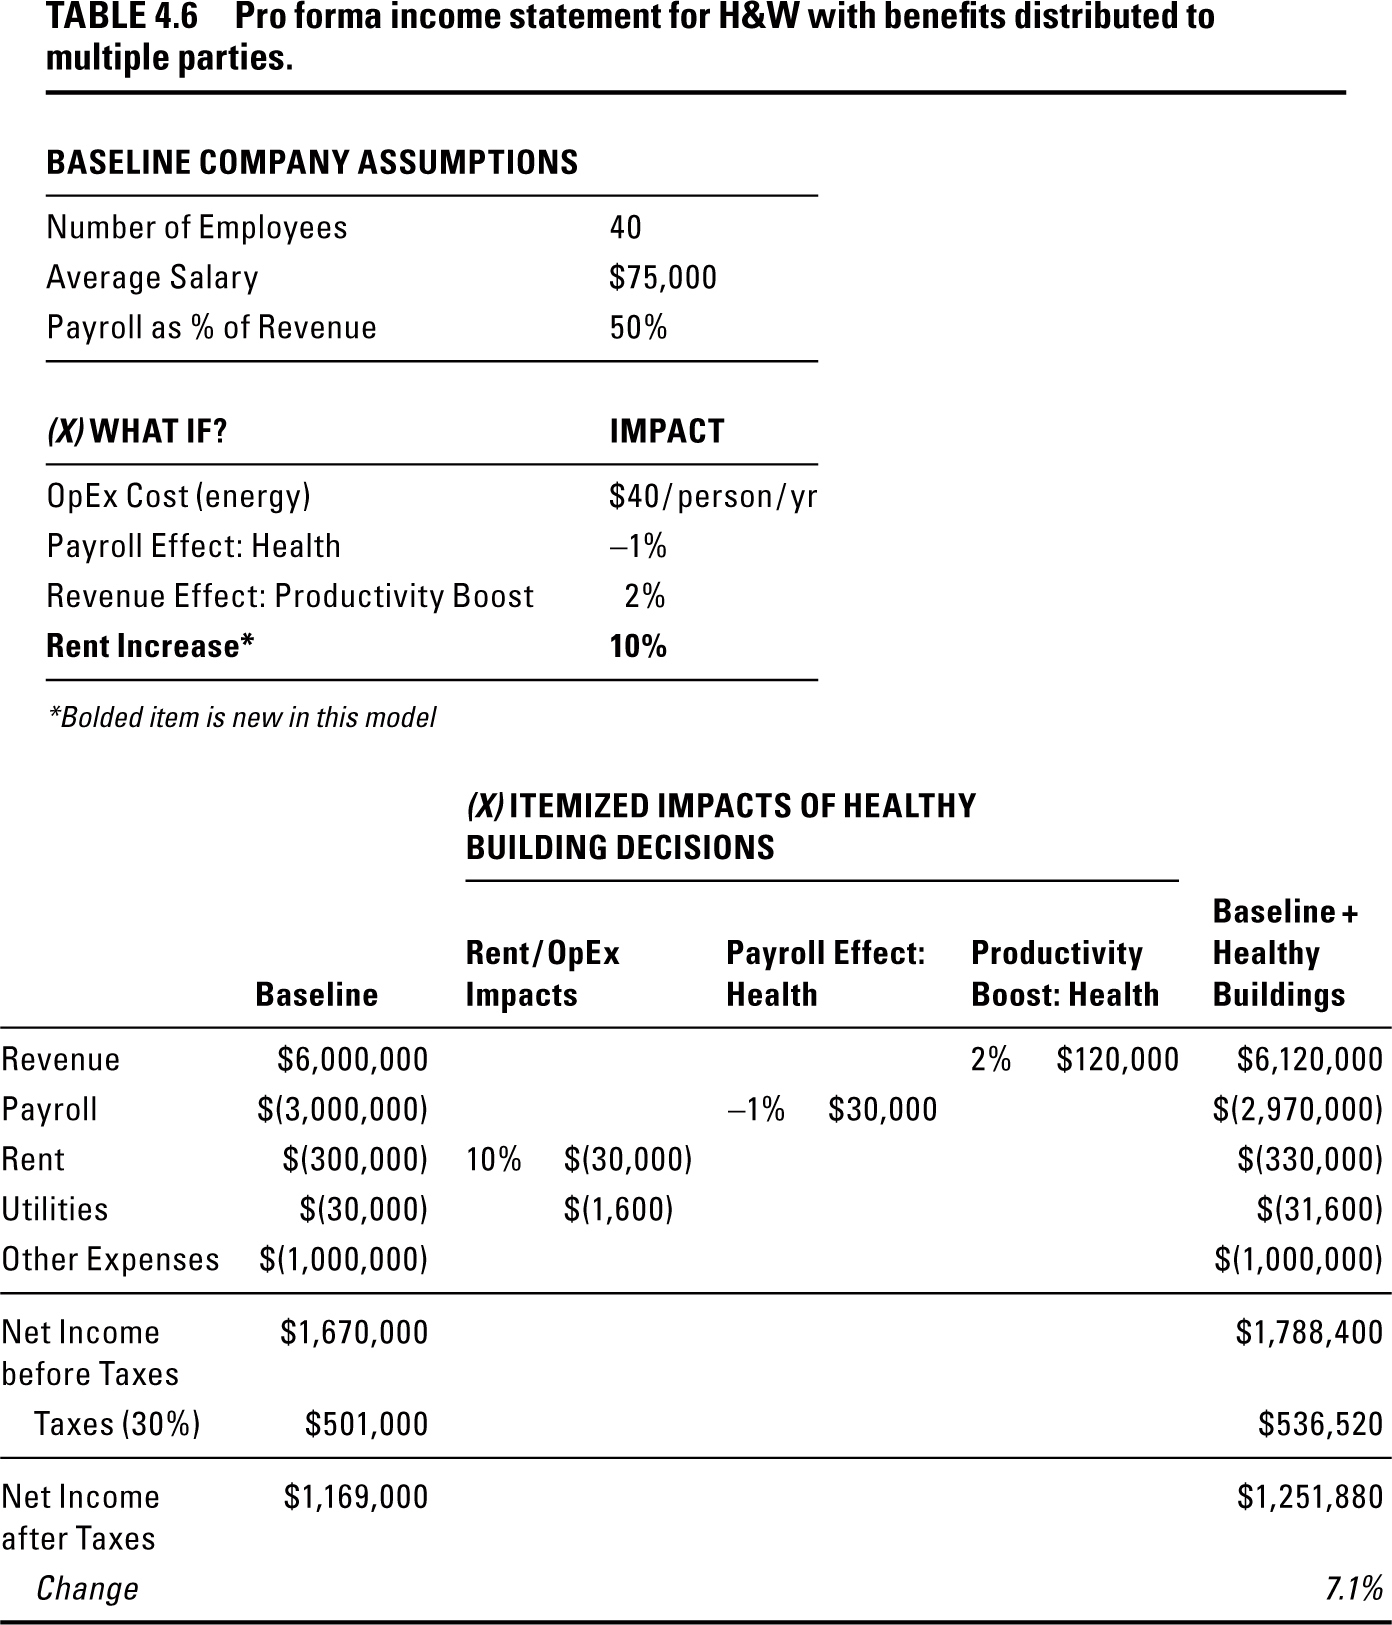
Finally, there is room in this equation for gain sharing. Suppose that the economic gains in this model were shared in part with the landlord. Sharing gains with the landlord can help to align the parties around first cost of construction, who pays for what in the tenant space, and allocation of operating costs.
|
TABLE 4.7 Pro forma income statement for H&W with full productivity and health boosts. |
|||
|
BASELINE COMPANY ASSUMPTIONS |
|||
|
Number of Employees |
40 |
||
|
Average Salary |
$75,000 |
||
|
Payroll as % of Revenue |
50% |
||
|
(X) WHAT IF? |
IMPACT |
||
|
OpEx Cost (energy) |
$40 / person / yr |
||
|
Payroll Effect: Health |
−1% |
||
|
Revenue Effect: Productivity Boost* |
3% |
||
|
Rent increase |
10% |
||
|
*Bolded item is new in this model |
|||
|
(X) ITEMIZED IMPACTS OF HEALTHY BUILDING DECISIONS |
||||||||||||||||
|
Baseline |
Rent / OpEx Impacts |
Payroll Effect: Health |
Productivity Boost: Health |
Baseline + Healthy Buildings |
||||||||||||
|
Revenue |
$6,000,000 |
3% |
$180,000 |
$6,180,000 |
||||||||||||
|
Payroll |
$(3,000,000) |
−1% |
$30,000 |
$(2,970,000) |
||||||||||||
|
Rent |
$(300,000) |
10% |
$(30,000) |
$(330,000) |
||||||||||||
|
Utilities |
$(30,000) |
$(1,600) |
$(31,600) |
|||||||||||||
|
Other Expenses |
$(1,000,000) |
$(1,000,000) |
||||||||||||||
|
Net Income before Taxes |
$1,670,000 |
$1,848,400 |
||||||||||||||
|
Taxes (30%) |
$501,000 |
$554,520 |
||||||||||||||
|
Net Income after Taxes |
$1,169,000 |
$1,293,880 |
||||||||||||||
|
Change |
10.7% |
|||||||||||||||
In this example, the revenue gains from productivity, the cost savings from health, and the net added energy costs could allow the landlord to ask for a 10 percent increase in rent—and still leave room for this company to add more than $75,000 to its bottom line. That’s a lot for a firm whose profit was just over $1.1 million at the start. This illustration allows for gain sharing with the landlord—the kind of win-win alignment that helps to solve the “healthy real estate investing paradox” mentioned in Chapter 1. Of course, some firms might instead want to share the added revenue with employees through a bonus or profit-sharing system. (In Chapter 5 we will dive deeper into the issue of split incentives in real estate and why this negotiated distribution of value is so thorny—and so important.)
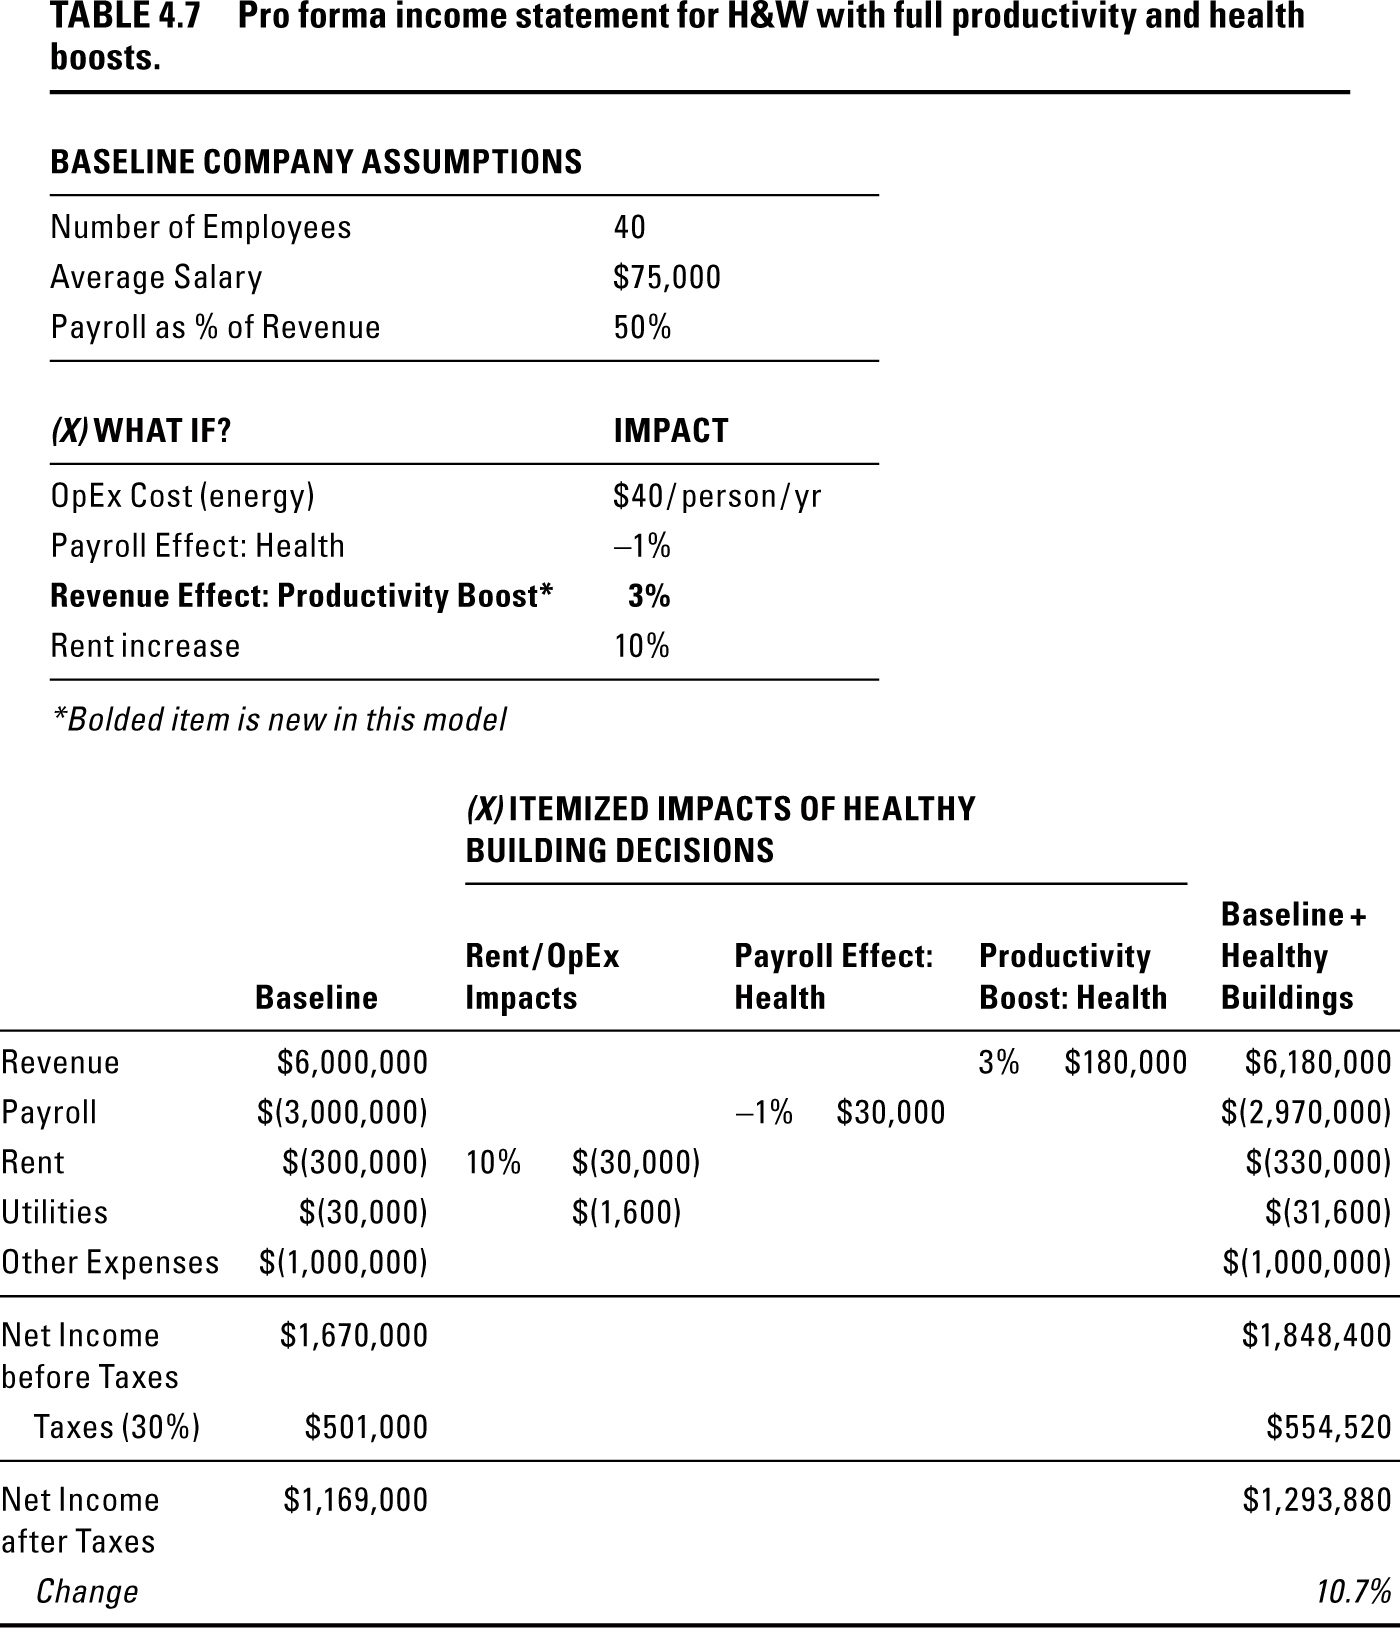
Now, recall that the scientific evidence suggests that higher ventilation is associated with gains ranging from 2 to 10 percent. What if we were to project a more optimistic 3 percent productivity and health realization?
This is a shocking result. Why? Because it shows that bottom-line net income for this brainpower-dependent consulting firm increases more than 10 percent—from $1,169,000 to $1,293,880—even while paying more for energy (mostly ventilation) and paying the landlord more for rent (since the space was designed and engineered for healthy air, the landlord can attract higher-value tenants and charge a premium for the added benefits).
This broad “what if” kind of analysis is common in the real estate industry. Landlords frequently need to decide on other improvements like changing the carpet or replacing the roof or putting marble in the lobby or a daycare center in the common area or electrical vehicle chargers in the garage. These one-time capital investments are almost never directly traceable to a specific increase in rental rates, but tenants quickly get a sense of the expected price range for features like windows, finishes, noise, and more that contribute to the overall appeal of a lease. Landlords and investors go by these calculations in deciding what to put in and what to leave out. We are proposing that the considerations we’ve raised concerning quantification of the benefits of a Healthy Building should become a critical part of landlord and tenant math.
The figures in the pro forma are intuitively logical. But readers may think, “Come on, how will revenue go up by that much?” What if objective measures of health and well-being beyond ventilation could be proved and implemented? In the rest of this book, we’ll argue that they can, even in the rough-and-tumble world of commercial real estate.