Chapter 17. Code Quality and Distribution
In this chapter, we’ll talk about some tools and techniques you can use to ensure that your code is as good as it can be. Specifically, we’ll be talking about how to monitor your app and find ways to improve its performance, how to track down and fix bugs, and how to set up your application to run automatic tests on itself, which will help you make changes to the code without accidentally breaking its features.
After that, we’ll talk about how to use automated tools for ensuring that every piece of the app works every step of the way as you continue to build your project. Finally, we’ll talk about how to deal with the App Store, including code signing requirements and delivering your product to Apple for distribution, as well as how to ensure that only the assets that the user’s device actually needs are downloaded.
Debugging
Sometimes, your code just doesn’t work the way you want it to: either you have a crash, or you have a more subtle behavioral difference. To track down these problems, you can use Xcode’s built-in debugger. A debugger is a program that can interrupt the execution of an app, gather data from its variables, and help you figure out what the app’s doing.
To use the debugger, you add breakpoints. A breakpoint is a point in the program at which the debugger should stop, allowing the developer (that’s you!) to inspect the program’s current state.
When a program is stopped at a breakpoint, you can step through its execution, line by line, observing the data stored in both the local variables and in the properties of the classes change. By carefully observing the behavior of your app, you can track down the causes of problems and fix them.
In addition, you can make the debugger automatically jump in the moment the application crashes, allowing you to figure out the cause of the crash.
To add a breakpoint to your application, simply click inside the gray area at the left of the code. When you do, a small blue arrow will appear, representing the point at which the program will stop (Figure 17-1).

Figure 17-1. A breakpoint
If you run the application and trigger the code that has the breakpoint, your program will pause and Xcode will appear, showing the debug view (Figure 17-2).
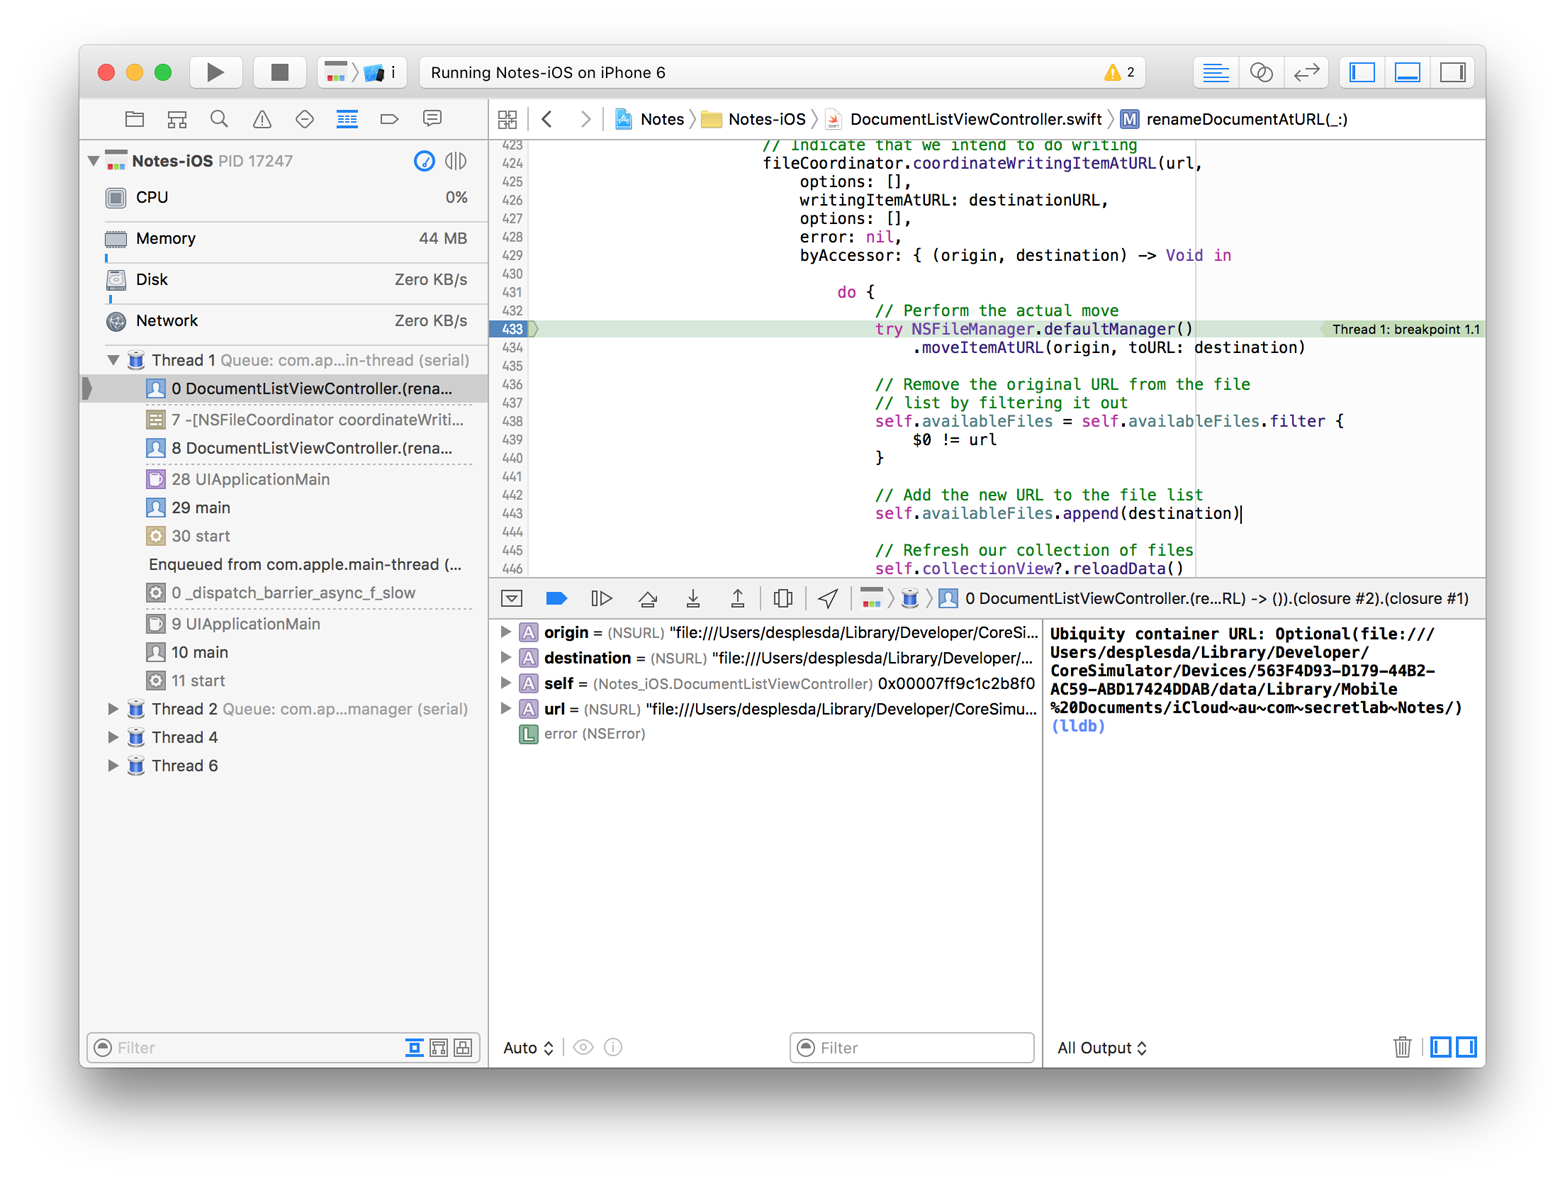
Figure 17-2. The program, stopped in the debugger
When the debugger is active, a number of things appear:
-
The Debug Inspector, at the left of the Xcode window, shows a stack trace, indicating where in the program the execution has stopped, and which methods were called to reach this point.
-
The debug view appears, and is split into two sections:
-
On the left, the list of all local variables is displayed. From here, you can see the current value of all local variables, as well as access the current object’s properties in the
selfvariable. -
On the right, the LLDB console appears. From here, you can type commands for the debugger to interpret. The most useful command is
po, which causes the debugger to print the value of the specified expression.
-
At the top of the debug view, you can find buttons that control the execution of the debugger (see Figure 17-3). The most important are the first six:
-
The first button closes the debug view.
-
The second button enables or disables breakpoints.
-
The third button resumes execution of the program.
-
The fourth button moves to the next line of code.
-
The fifth button steps into the next method call.
-
The sixth button continues until the current method returns, and then stops.

Figure 17-3. The debug view’s controls
The debugger is an essential tool for diagnosing problems in your app. Don’t hesitate to stick a breakpoint in to figure out what your code is actually doing!
Instruments
The Instruments tool tracks the activity of an application. You can monitor just about every single aspect of an application, from high-level metrics like how much data it’s transferring over the network down to low-level information about the OpenGL commands that the app executed in a single frame.
If your app is running slowly, Instruments lets you figure out which part of your application is responsible for taking up the majority of the time; if your app is consuming too much memory, you can work out what’s responsible for allocating it.
There are two ways to use Instruments. First, you can get a high-level summary of the behavior of your app in Xcode (see Figure 17-4); if you need more information, you can launch the separate Instruments app.
To access the high-level summary of how your app is performing, simply run it and go to the debug navigator. Underneath the app’s name, you’ll find four entries—CPU, Memory, Disk, and Network—showing the current performance status of the app: how much of the system’s CPU capacity it’s using, how much total memory, how much data is being read and written to disk, as well as how much network traffic the app is getting. When you select these, you’ll be shown a more detailed picture of the selected aspect.
Tip
If you’re testing on a Mac, or on an iOS device—that is, not the simulator—then you’ll also see energy consumption data. If you’re on a Mac, you’ll also see iCloud usage data.

Figure 17-4. Performance data in Xcode
You’ll notice a button labeled “Profile in Instruments” at the top-right corner of the view. If you click this, Xcode will offer to transfer control of the application to Instruments, allowing you to gather a more detailed view of the application.
Note
You can use Instruments to profile both the simulator and a real device. However, the simulator has different performance characteristics than real devices, and real users don’t use the simulator. Always test the performance of your app on an actual device before shipping to the App Store.
To demonstrate, let’s profile the Notes application to identify performance hotspots when viewing image attachments.
-
Launch the Notes application and select the CPU element in the debug inspector.
-
Click the “Profile in Instruments” button.
-
Xcode will ask if you want to transfer the current session to Instruments, or stop the current session and launch a new one in Instruments (Figure 17-5). Either option is useful for our purposes.

Figure 17-5. Transferring the application
-
Instruments will launch, showing the CPU Usage tool (Figure 17-6).

Figure 17-6. Instruments, using the CPU Usage tool
As you use the application, the CPU usage will be logged. We’ll now perform some tests to determine which methods are taking up most of the time.
-
Open a document. Once the document is open, go to Instruments and press the Pause button.
-
Look at the Call Tree pane, which takes up the majority of the bottom section of the window. This window shows the amount of CPU time taken up by each thread; additionally, you can dive into each thread to find out which methods took up the most CPU time.
Tip
The less time spent on the CPU, the better your performance.
When you’re tuning the performance of your application, there’s not much sense in wading through the huge collection of methods that you didn’t write. To that end, we can filter this view to show only the code that you have control over.
-
Find the Display Settings button, at the top of the panel in the bottom right of the screen. Click it, and you’ll see a collection of options to control how the data is displayed.
-
Turn off everything except Hide System Libraries. When you do this, the Call List will be reduced to just your methods. Additionally, they’ll be ordered based on how much each time each method took (see Figure 17-7).
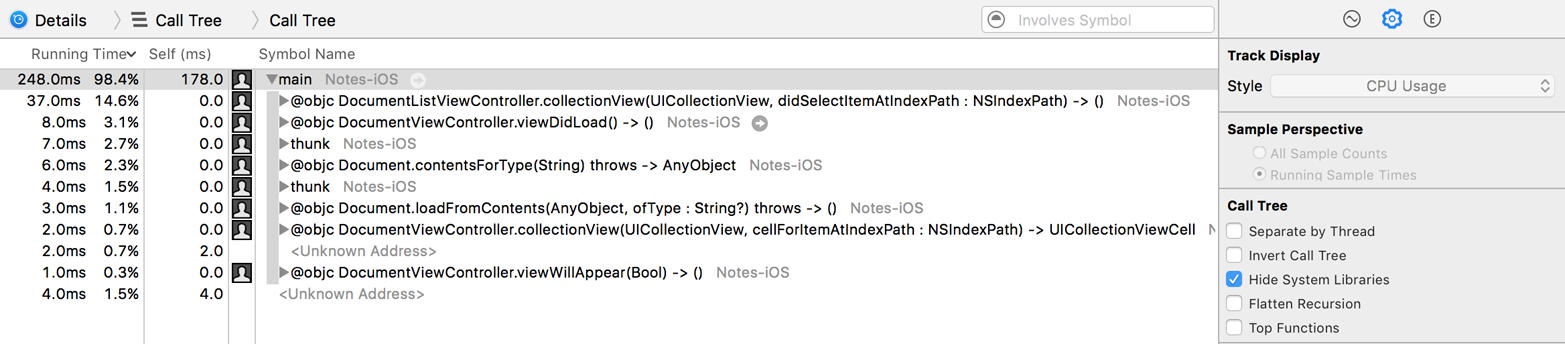
Figure 17-7. Instruments, after the display has been filtered
The content of the detail area, which is the lower half of the screen, depends on which instrument you’re working with. For the CPU Usage instrument, the columns in the Detail Area’s Call Tree view are:
- Running Time
-
The total amount of time taken by the current row, including any of the methods that it calls.
- Self (ms)
-
The total amount of time taken by the current now, not including any of the methods it calls.
- Symbol Name
-
The name of the method in question.
You’ll notice that
mainis taking up the majority of the time. This makes sense, becausemainis the function that kicks off the entirety of the application. If you open up the list of methods, you’ll see the methods thatmaincalls; each one can in turn be opened.Given that our goal is to improve the performance of opening a document, we want to find the most time-consuming method, and optimize that.
-
Expand the topmost method in the list. Continue doing this until there’s nothing else left to expand.
Tip
Hold the Option key and click on the arrow, and all rows will be expanded.
You’ll notice that the method that takes the majority of the time when opening the document is labeled “type metadata accessor for AVSpeechSynthesizer” (see Figure 17-8). This sounds kind of arcane, so let’s back up one level and see if we can figure out what’s going on.

Figure 17-8. The performance bottleneck in the code
-
Double-click on the method above “type metadata accessor for AVSpeechSynthesizer”:
DocumentViewController.init. You’ll be taken to a view of the source code, highlighting the line that took the most time to execute: the line that creates theAVSpeechSynthesizer(Figure 17-9).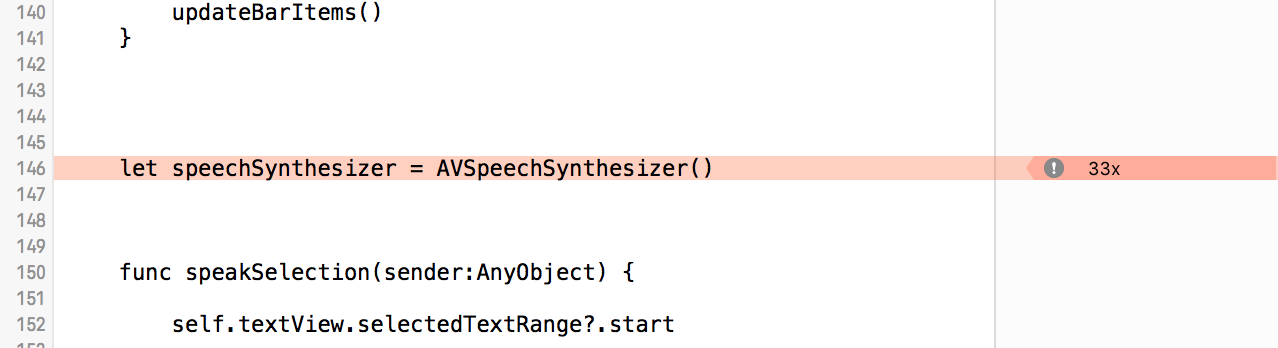
Figure 17-9. The offending line of code
What’s happening here is that
AVSpeechSynthesizerdoes quite a bit of loading in order to prepare itself for use. It needs to access several hundred megabytes of speech samples and prepare the language model used for converting text to spoken audio.When the
DocumentViewControlleris created, it immediately creates theAVSpeechSynthesizer. However, it doesn’t technically need to do it right away. We could instead create theAVSpeechSynthesizerthe moment the user asks for text to be spoken.The best way to do this is to use a lazy stored property for the
AVSpeechSynthesizer. A lazy property works just like any other property, except it doesn’t actually initialize its value until the very first time it’s accessed. If we change thespeechSynthesizerproperty to be a lazy property, we’ll reduce the amount of time needed to load theDocumentViewController. -
Open DocumentViewController.swift and replace the following line of code:
letspeechSynthesizer=AVSpeechSynthesizer()with the following code:
lazyvarspeechSynthesizer=AVSpeechSynthesizer()
You’re done. Repeat the steps you took earlier: relaunch the app, transfer it to Instruments, and open a document. The time taken to load a document should be reduced!
This process of measuring the work done by the app, determining the point that needs changing, and optimizing it can be applied many times, and in different ways. In this section, we’ve only looked at reducing the time spent on the CPU; however, you can use the same principles to reduce the amount of memory consumed, data written to and read from disk, and data transferred over the network.
Testing
While simple apps are easy to test, complex apps get very difficult to properly test. It’s simple enough to add some code and then check that it works; but the more code you add, the more you increase the chance that a change in one part of the code will break something elsewhere. In order to make sure that all of the app works, you need to test all of the app. However, this has many problems:
-
It’s tedious and boring, which means you’ll be less likely to do it thoroughly.
-
Because it’s repetitious, you’ll end up testing a feature in the same way every time, and you may not be paying close attention.
-
Some problems appear only if you use the app in a certain way. The more specific the use case, the less you’ll test it.
To address these problems, modern software development heavily relies on automated testing. Automated testing solves these problems immediately, by running the same tests in the same way every time, and by checking every step of the way; additionally, automated testing frees up your mental workload a lot.
There are two types of automated tests in Xcode: unit tests and user interface tests.
Unit Testing
Unit tests are small, isolated, independent tests that run to verify the behavior of a specific part of your code. Unit tests are perfect for ensuring that the output of a method you’ve written is what you expect. For example, the code that we wrote all the way back in “JSON Attachments” to load a location from JSON is very straightforward to test: given some valid JSON containing values for lat and lon, we expect to be able to create a CLLocationCoordinates; additionally, and just as importantly, if we give it invalid JSON or JSON that doesn’t contain those values, we should expect to fail to get a coordinate.
Unit tests are placed inside a unit test bundle. You can choose to either include unit tests when you create the project, or you can add one to an existing project by opening the File menu and choosing New→Target, then opening the Tests section and choosing Unit Tests (see Figure 17-10).
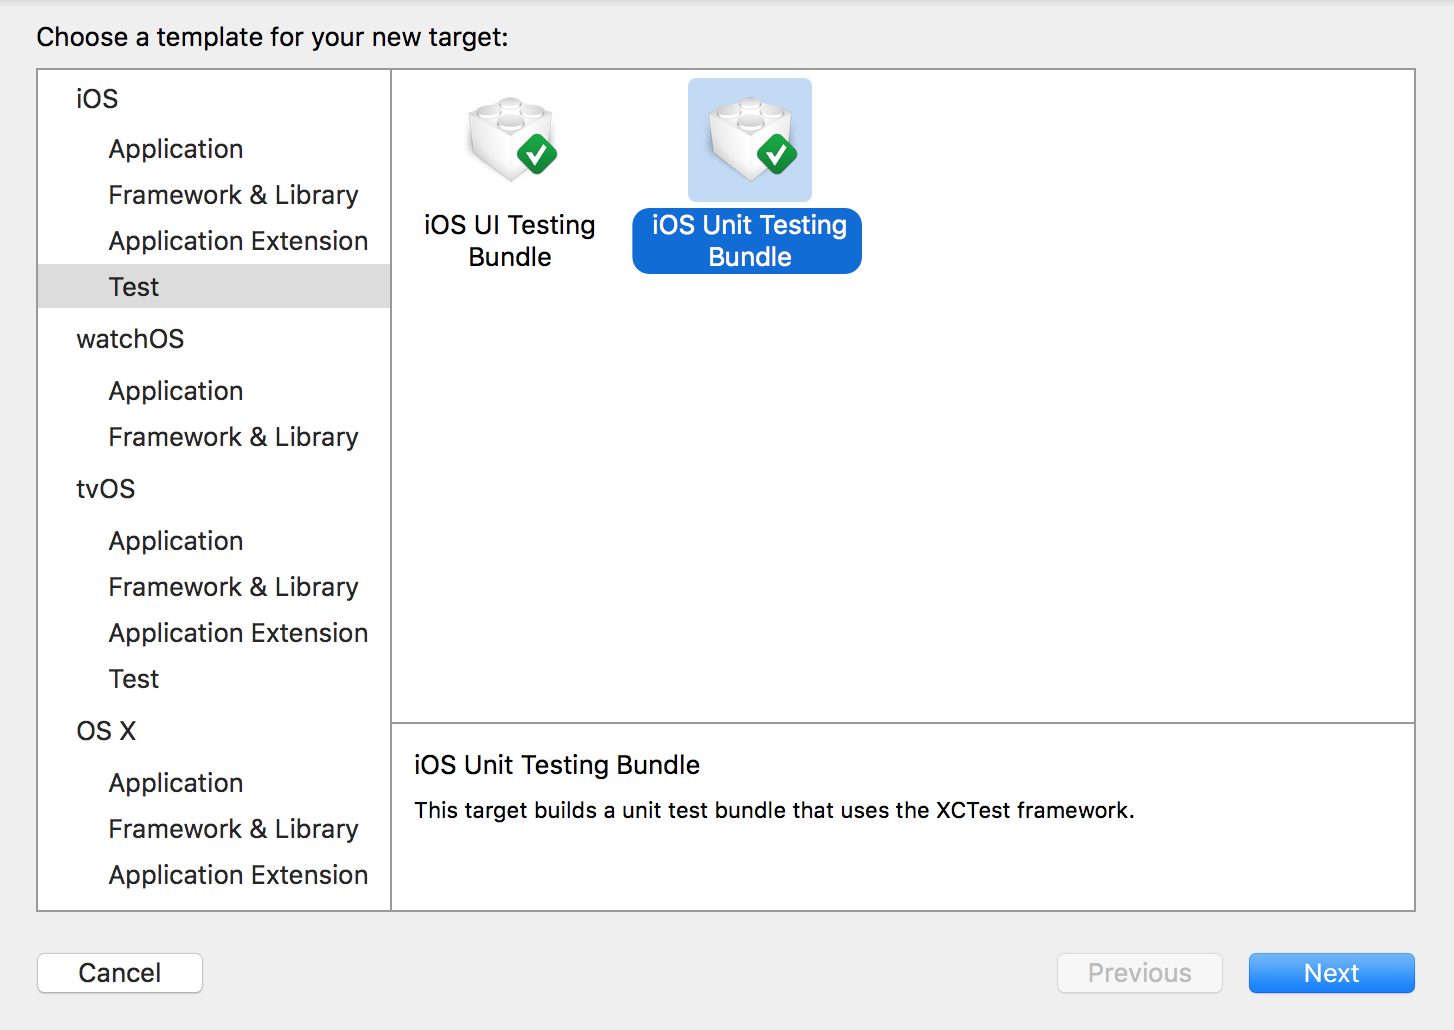
Figure 17-10. Adding a Unit Test bundle to a project
Test bundles contain one or more test cases; each test case is actually a subclass of XCTestCase, which itself contains the individual unit tests. A test case looks like this:
functestDocumentTypeDetection(){// Create an NSFileWrapper using some empty dataletdata=NSData()letdocument=NSFileWrapper(regularFileWithContents:data)// Give it a namedocument.preferredFilename="Hello.jpg"// It should now think that it's an imageXCTAssertTrue(document.conformsToType(kUTTypeImage))}
The tests inside XCTestCase class are its methods. When Xcode runs the tests, which we’ll show in a moment, it first locates all subclasses of XCTestCase, and then finds all methods of each subclass that begin with the word test. Each test is then run: first, the test case’s setUp method is run, then the test itself, followed by the test case’s tearDown method.
You’ll notice the use of the XCTAssertTrue functions. This method is one of many XCTAssert functions, all of which test a certain condition; if it fails, the entire test fails, and Xcode moves on to the next test. You can find the entire list of XCTAssert functions in the Xcode testing documentation.
To run the unit test for your current target, press ⌘U, or click the icon at the left of the top line of a specific test, as shown in Figure 17-11.

Figure 17-11. Running a specific test
Xcode will launch your app, perform the test(s), and report back on which tests, if any, failed.
UI Testing
To get a complete picture of how your app works, unit tests on their own aren’t enough. Testing a single isolated chunk of your code, while extremely useful, isn’t enough to give you confidence that the app itself, with all of its interacting components, is being tested. For example, it’s simply not feasible to write a concise unit test for “create a document, edit it, and save it.”
Instead, you can use UI tests to verify that the app is behaving the way you want it to as it’s used. A UI test is a recording of how the user interacts with the user interface; however, these recordings are done in a very clever way. While a UI test is being recorded, Xcode notes every interaction that you perform, and adds a line of code that reproduces that step.
The result is code that looks like this (we’ve added comments to describe what’s going on):
functestCreatingSavingAndClosingDocument(){// Get the appletapp=XCUIApplication()// Choose File->NewletmenuBarsQuery=XCUIApplication().menuBarsmenuBarsQuery.menuBarItems["File"].click()menuBarsQuery.menuItems["New"].click()// Get the new 'Untitled' windowletuntitledWindow=app.windows["Untitled"]// Get the main text viewlettextView=untitledWindow.childrenMatchingType(.ScrollView).elementBoundByIndex(0).childrenMatchingType(.TextView).element// Type some texttextView.typeText("This is a useful document that I'm testing.")// Save it by pressing Command-StextView.typeKey("s",modifierFlags:.Command)// The save sheet has appeared; type "Test" in it and press ReturnuntitledWindow.sheets["save"].childrenMatchingType(.TextField).elementBoundByIndex(0).typeText("Test\r")// Close the documentapp.windows["Test"].typeKey("w",modifierFlags:.Command)}
UI tests are run the same way as your unit tests. When they’re run, the system will take control over your computer and perform the exact steps as laid down in the test. This ensures that your app is tested in the exact same way, every time.
Tip
You can also record your interactions with an app directly into a UI test. This is extremely useful, since it means that you don’t have to learn the API involved—you can just use the app as you would normally, and Xcode will note what you did. For more information, see Writing Tests in the Xcode documentation.
Using Objective-C and Swift in the Same Project
If you’re making a new project from scratch, you’ll likely have the opportunity to write all of your code in Swift. However, if you have an existing project written in Objective-C, and want to write code in Swift, you need a way to bridge the two. The same thing applies in reverse, for when you have a project written in Swift and need to add some Objective-C code.
Using Swift Objects in Objective-C
To make objects written in Swift available in Objective-C, you need to add the @objc tag in front of them. For example, if you have a class written in Swift called Cat, you write the class as normal and prepend @objc to its name:
@objcclassCat:NSObject{varname:String=""funcspeak()->String{return"Meow"}}
Note
Classes that are defined in Swift are available to Objective-C only if they’re a subclass of NSObject (or any of NSObject’s subclasses).
In your Objective-C code, you import an Xcode-generated header file that makes all of your @objc-tagged Swift code available to Objective-C:
#import"MyAppName-Swift.h"
Once it’s imported, you can use the class as if it had originally been written in Objective-C:
Cat*myCat=[[Catalloc]init];myCat.name="Fluffy";[myCatspeak];
Using Objective-C Objects in Swift
To use classes and other code written in Objective-C in your Swift code, you fill out a bridging header. When you add an Objective-C file to a project containing Swift files, or vice versa, Xcode will offer to create and add a bridging header to your project.
Inside this header, you add #import statements for all of the Objective-C files you want to export to Swift. Then, inside your Swift code, you can use the Objective-C classes as if they had been originally written in Swift.
Note
This method is actually how your code accesses the majority of the Cocoa and Cocoa Touch APIs, which are mostly written in Objective-C.
For example, consider a class written in Objective-C, like so:
@interfaceElevator-(void)moveUp;-(void)moveDown;@propertyNSString*modelName;@end
All you need to do is import the class’s header file into the bridging header that Xcode generates for you:
#import"Elevator.h"
Once that’s done, you can use the class in Swift as if it were originally written in Swift:
lettheElevator=Elevator()theElevator.moveUp()theElevator.moveDown()theElevator.modelName="The Great Glass Elevator"
Note
Interoperation between Swift and Objective-C is a large and complex topic, and there’s much more that you should know if you plan on making the two work together. Apple has written an entire book on the topic, Using Swift with Cocoa and Objective-C, which is available for free both online and on the iBooks Store.
The App Store
Once you’ve written your app, it’s time to get it out to the world. To do this, you need to submit it to the App Store.
The App Store is the only way that Apple permits third-party iOS apps to be distributed to the public. To submit to the App Store, you need the following things:
-
An app, ready to go out to the public
-
A distribution certificate, signed by Apple
-
The text and images for the app’s page on the App Store
iOS devices run only signed code. This means that, in order to run your app on an actual device, and to submit to the App Store, you need to get a certificate from Apple. Getting a certificate is free if you just want to make apps that run on your own devices; if you want to submit to the App Store, you need to join the Apple Developer Program, which is $99 USD per year.
Note
Because the App Store submission process mostly takes place on websites, it’s difficult to write a book that stays up to date with it. We therefore strongly encourage you to read Apple’s App Distribution Guide, which discusses both the technical requirements as well as the information you need to provide for the App Store.
When you submit an application to the App Store, it is first checked by automated systems and then by a human. The automated systems perform checks that are easily computer-run, such as making sure that the app has all of the necessary icons for the platform that it runs on. Once the automated checks have passed, the app goes into a queue while it waits for a human being to look at it. This is what Apple refers to as app review. App review isn’t a scary process, and they’re not there to judge you on the quality of your app; instead, the review checks to see if your app violates any of the App Store Review Guidelines. These reviews are generally common sense and exist to help Apple maintain the overall quality of the App Store.
After Apple has approved your application, you’ll receive an automated email indicating whether the app has passed review or has been rejected. If your app is rejected, don’t worry! Almost all app rejections are due to a simple thing that’s easily changed; the most common one that we’ve heard has been forgetting to test an app with flight mode turned on, which cuts off access to all Internet services, including iCloud. Simply fix the issue and resubmit your app.
If your app has been approved, you just need to press the button in iTunes Connect to release it. A few hours later, your app will be in the App Store!
App Thinning
While it’s important to design your app to work on as many devices as possible, the fact remains that when an app is downloaded onto a specific type of device, it will never make use of the resources that are necessary for it to work on other devices. For example, an app that runs on both the iPad and the iPhone needs an icon for both, and you need to include it in your app when you deliver it to the App Store. However, when you download it onto your iPhone, there’s no point in downloading the iPad version of the icon.
To deal with this issue, Xcode has support for app thinning. App thinning involves marking certain files with information about what kinds of devices will use the different resources included in the app. For example, if you select an image set in an asset catalog, you can specify which types of devices the image will appear in (such as iPhone only, iPad only, and so on); however, you can also be extremely specific with the conditions in which the asset will be included (see Figure 17-12). These include specifying the minimum amount of memory that must be available for the image to be downloaded, or the minimum graphics hardware capability.
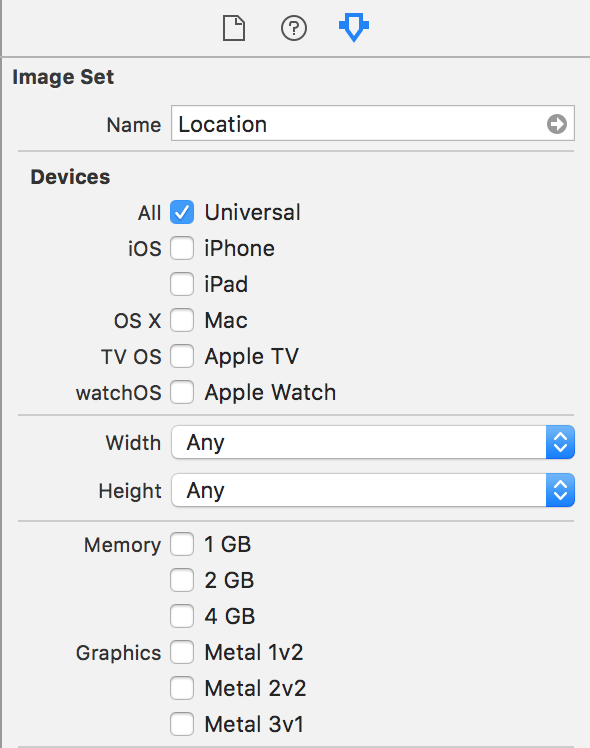
Figure 17-12. App thinning options for an image set in an asset catalog
Testing iOS Apps with TestFlight
TestFlight is a service operated by Apple that allows you to send copies of your app to people for testing. TestFlight allows you to submit testing builds to up to 25 people who are members of your Developer Program account. You can also send the app to up to 1,000 additional people for testing, once the app is given a preliminary review by Apple.
To use TestFlight, you configure the application in iTunes Connect by providing information like the app’s name, icon, and description. You also create a list of users who should receive the application. You then upload a build of the app through Xcode, and Apple emails them a link to download and test it.
Note
We’re not covering TestFlight in detail in this book, as the user interface and steps for distributing via TestFlight change frequently.
For more information on how to use TestFlight, see the iTunes Connect documentation.
Conclusion
If you’ve read this far, congratulations. You’ve built three complete, complex apps from start to finish for a variety of platforms, and you’re ready to build even bigger.
We hope that you’ve enjoyed your journey through this book. If you’ve made something, we’d love to hear about it! Send us an email at learningswift@secretlab.com.au.