THE NORMAL DISTRIBUTION

Discovered by Abraham de Moivre more than 200 years ago, the normal distribution is perhaps the most important probability distribution in the whole of statistics.

WHAT IS IT?

Image

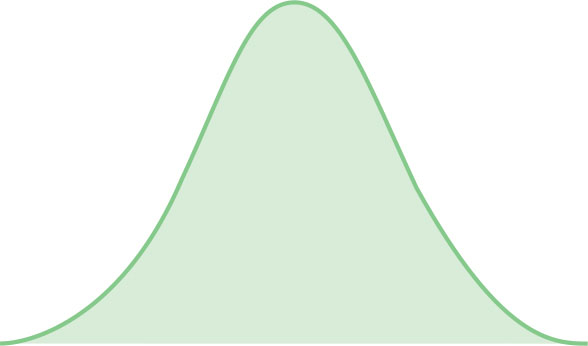
Take a randomly selected bunch of people and measure their heights. Now plot the number of people with each possible height on a histogram and you’ll end up with a graph that looks like the normal distribution. The normal distribution is also known informally as the “bell curve,” due to its shape.
Image

WHAT DOES IT MEAN?

Like other probability distributions, the curve indicates the probabilities of particular random values occurring—in this case, heights of people, but the distribution can apply in many different situations.

The peak of the distribution corresponds to the average, or “mean” value, often denoted as μ.

The spread of the distribution is captured by its “standard deviation,” σ, calculated such that 68 percent of the data recorded falls within 1 standard deviation; 95 percent within 2; and 99.7 percent within 3.

Image

DID YOU KNOW?

The shape of the curve is given by the equation

Image

This was discovered by Carl Friedrich Gauss, hence the alternative term, “Gaussian” distribution.

CENTRAL LIMIT THEOREM

Image

If you add together many random variables, the central limit theorem says that their sum will be normally distributed.

So, if you roll a die 1,000 times then, regardless of the distribution of each roll, the sum of all 1,000 rolls will obey a normal distribution.