Drawing reasonable conclusions from scientific data
Correlating scientific evidence from multiple sources
To do well on the GED Science test, you need to be able to read and understand science-related content presented in various media — including text, maps, images, charts, and tables — and you must be able to write short essays in response to science-related prompts. In this chapter, we provide guidance on reading and writing in a science context along with plenty of practice to hone your skills.
This chapter contains a few short-answer items that test a different set of skills than do the regular questions. We include these questions to give you practice responding to this type of question and develop a means of self-evaluating your response. If you can do that effectively, you’ll have an advantage on the Science test.
Understanding Scientific Presentations
On the GED Science test, you’re presented with scientific information in the form of text, maps, images, charts, and tables, and possibly a combination of two or three different formats. Your job is to make sense of the information in various formats so you can answer questions about that information and draw conclusions from it. To answer any science question on the test, I recommend the following process:
Read the passage, if a passage is presented, and/or skim the data that’s presented as a map, image, chart, or table, so you have a general idea of what the data is.
Read the question and any answer choices, so you have a clear idea of what you need to do with the information you’re given.
Some questions may be fill-in-the-blank or some other format, so you may not have answer choices.
Find the specific information in the passage, map, image, chart, or table that answers the question.
For some questions, you may be required to perform mathematical operations, such as calculating an average. If a formula is required, the question gives you the formula you need.
Answer the question.
Most questions are multiple-choice, in which case, you identify the choice that’s supported best by information in the passage, map, image, chart, or table. Some questions may be fill-in-the-blank or drag-and-drop.
When answering multiple-choice questions, if you don’t know the answer, make an intelligent guess. Eliminate obviously wrong answers and then choose from the remaining answers to improve your chances of guessing the correct answer. You’re not penalized for wrong answers; you receive a 0 (zero) for a wrong answer, which is what you’d receive for no answer.
In this section, you encounter scientific information presented in a variety of formats, so you’ll be familiar with the different formats when you take the test. You may have an easier time understanding information presented in certain formats than in others.
Grasping textual presentations
Much of the scientific information presented on the test comes in the form of reading passages — one or more paragraphs of text. The challenge with these passages is to be able to read and understand the passage and sift through it to find the specific information you need to answer the questions that follow the passage.
Some wetlands, such as salt marshes, are among the most productive natural ecosystems in the world. Only rain forests and coral reefs come close to matching their productivity. They produce huge amounts of plant leaves and stems that serve as the basis of the food web. When the plants die, they decompose in the water and form detritus. Detritus and the algae that often grow on plants are the principal foods for shrimp, crabs, clams, and small fish, which, in turn, are food for larger commercial and recreational fish species such as bluefish and striped bass.
1.The following diagram represents a typical energy pyramid.
In the energy pyramid, detritus and algae that grow on plants are at which level in the food pyramid?
(A) tertiary consumers
(B) secondary consumers
(C) primary consumers
(D) producers
2. In the energy pyramid, producers convert
(A) nuclear energy into thermal energy
(B) radiant energy into chemical energy
(C) mechanical energy into electrical energy
(D) thermal energy into radiant energy
Check your answers:
Detritus and the algae that grow on plants are referred to as the primary foods for smaller animals that larger animals feed on, so the correct answer is Choice (D), producers.
Producers are plants that convert radiant energy from the sun into chemical energy in the form of plants, which are comprised of the chemicals carbon, hydrogen, and oxygen, which provide energy to the consumers in the food chain. Choice (B) is the correct answer.
Determining the meaning of scientific symbols, terms, and phrases
The GED Science test expects you to be able to “determine the meaning of symbols, terms, and phrases as they are used in scientific presentations.” This means you need to know the language of science, and the only way to know the language of science is to read a lot of science content and look up words, phrases, and any funky symbols you encounter.
The chapters in Part II of this book bring you up to speed on many of the words, phrases, symbols, and concepts you need to know to understand the reading passages and questions. Knowing the basics about energy flow in an ecosystem; the water cycle; the relationship among work, motion, and force; the various states of a chemical element; solar system fundamentals; and so on provides you with the framework to understand scientific symbols, terms, and phrases in context.
Questions such as these require a knowledge of science terminology to answer correctly.
1.How does an endothermic chemical reaction differ from an exothermic reaction?
(A) An exothermic reaction absorbs heat, whereas an endothermic reaction releases heat.
(B) An exothermic reaction requires a great deal of energy to trigger while an endothermic reaction does not.
(C) An endothermic reaction absorbs heat, whereas an exothermic reaction releases heat.
(D) Endothermic reactions proceed much more quickly.
2. The movement of water from an area of high concentration to an area of low concentration is called
(A) osmosis
(B) phagocytosis
(C) respiration
(D) homeostasis
Check your answers:
An exothermic reaction gives off heat (ex is Latin for “out of”); an endothermic reaction absorbs heat. Choice (C) is the correct answer. See Chapter 9 for more about chemistry.
The movement of water from an area of high concentration to an area of low concentration is called osmosis, Choice (A). To find out more about various cell processes, head to Chapter 8.
Comprehending non-textual presentations
Non-textual presentations are those that present information in the form of maps, graphs, images, and tables. They may not be entirely void of text, but any text they contain is minimal. Here are a few questions based on non-textual science presentations.
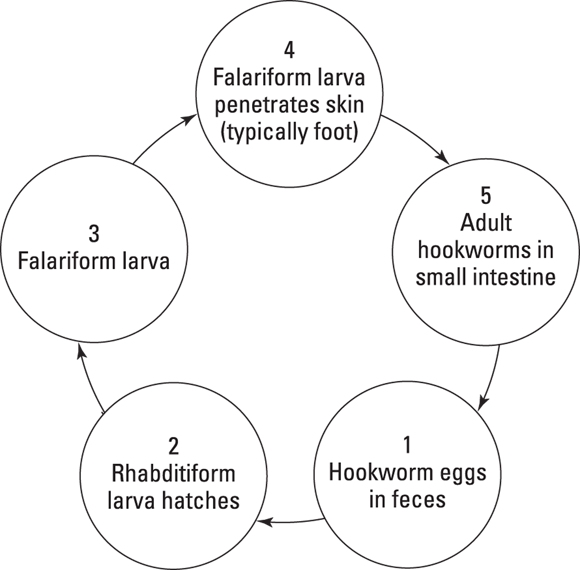
1. This illustration from the Centers for Disease Control and Prevention shows how hookworm infections occur.
What are the two most effective ways to prevent the spread of hookworm (choose two answers)?
(A) wear tight-fitting clothes
(B) wear shoes when walking outside
(C) provide sanitary treatment of human wastes
(D) wash fruit and vegetables thoroughly before eating
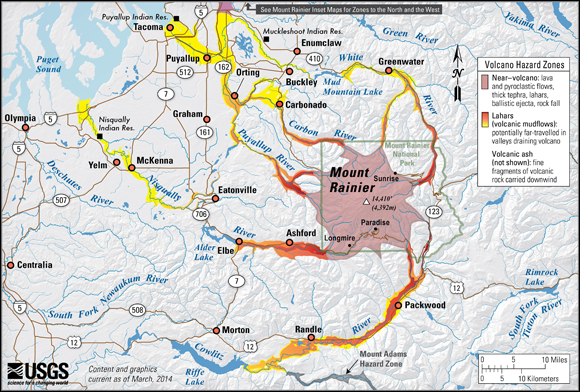
2. This image from the U.S. Geological Survey shows the potential impact area for ground-based hazards during a volcanic event on Mount Rainier, Washington.
Photo courtesy of USGS
What are the two most dangerous areas to be in the event of a volcanic eruption (choose two answers)?
(A) within 10 miles of the center of Mount Rainier
(B) near any lakes in the vicinity
(C) near valleys in the vicinity
(D) on hills surrounding Mount Rainier
3. This chart shows how the boiling point of water changes at higher elevations.
Which of the following cooking instructions would you need to follow when preparing meals at 6,000 meters elevation?
(A) Heat water for a longer period of time to reach its boiling point.
(B) Set the stove top to a higher setting when boiling the water.
(C) Subtract one minute of cooking time for each 1,000 meters of elevation.
(D) Add one minute of cooking time for each 1,000 meters of elevation.
4. According to Newton’s second law of motion, Force = mass × acceleration, as illustrated in the following table.
Net Force (N)
Mass (kg)
Acceleration (m/s2)
8
2
4
8
4
2
8
8
1
Which of the following statements best describes the pattern shown in the table?
(A) Increasing force increases acceleration when mass remains constant.
(B) Decreasing acceleration decreases force when mass remains constant.
(C) Decreasing mass increases acceleration when the force remains constant.
(D) Increasing mass increases acceleration when force remains constant.
Check your answers:
The illustration shows that hookworm eggs are passed in human feces and enter the body through the skin, so wearing shoes when walking outside and using proper sanitation are the two best ways, according to the image, to prevent hookworm from spreading. Answer Choices (B) and (C) are correct. The other options may help as well, but they’re not supported by the image.
The shaded portion representing the area near Mount Rainier is approximately 20 miles across according to the scale in the lower-right corner of the illustration, so within 10 miles from the center is the most dangerous area. The valleys where major rivers flow from Mount Rainier are also shaded as high-risk areas because of mudflows. Answer Choices (A) and (C) are correct.
Because water has a lower boiling point at higher elevations, you would need to cook your food for a longer period of time at a higher elevation, Choice (D). Choice (A) is wrong; water would boil faster at a higher elevation because its boiling point is lower. Choice (B) is wrong because setting the stove top to a higher setting will make the water boil sooner, but it doesn’t make it any hotter. Choice (C) is wrong because decreasing the cooking time is the opposite of what you need to do.
The table shows that when mass is decreased and force remains constant, acceleration is increased, as stated in Choice (C). Choice (A) is true, but the table doesn’t show mass remaining constant. Choice (B) is also true, but again, the table doesn’t show mass remaining constant. Choice (D) is wrong because increasing mass would decrease acceleration if force remained constant.
Demonstrating Your Ability to Reason from Data
If you correctly answered the questions in the previous section, you’ve already demonstrated your ability to reason from data. Nearly every question on the Science test challenges this ability by presenting data and then asking you to draw a conclusion from that data or apply it to a different situation. For example, if you know that the boiling point of water increases at higher pressures, how does that affect cooking time when you’re cooking food in a pressure cooker? (Answer: The food would cook in less time.) You really need to use your noodle to answer the questions; it’s not just a matter of reading a passage and picking out facts.
In this section, we explain in greater detail what’s required to be able to reason from data. We break this skill down into three sub-abilities: the ability to draw a conclusion based on evidence, the ability to predict an outcome based on evidence, and the ability to cite evidence from a written source to support a conclusion or prediction.
Drawing a conclusion from data or evidence
You may often think that drawing conclusions from scientific data is something done only in science classes, but it’s actually more common and important in the real world, where such conclusions can affect health, safety, economic conditions, and the very survival of the planet.
To draw conclusions from evidence, look closely at the data or evidence presented and consider carefully how the evidence was obtained; for example, how an experiment or study was conducted. The data and other evidence along with the question and answer choices lead you to the conclusion.
A poorly designed experiment or study can raise more questions than answers. For example, scientists may hypothesize that global warming is caused primarily by burning fossil fuels, but they draw that conclusion only after evaluating other possible factors, such as farming practices, deforestation, solar variability, and greenhouse gases other than carbon dioxide, such as methane. (See Chapter 6 for more about experimental design.)
Here are a few questions that challenge your ability to arrive at evidence-based conclusions.
1.Oceanographers recently discovered a fish, called an opah or moonfish, that maintains a constant body temperature. Why does this fish challenge the system for distinguishing classifying vertebrates (animals with a backbone or spinal column)?
(A) Fish are classified as coldblooded invertebrates.
(B) Fish are generally classified as coldblooded vertebrates.
(C) Vertebrates cannot maintain a constant body temperature.
(D) Invertebrates cannot maintain a constant body temperature.
2.Photosynthesis is a process in which plants use energy from the sun to convert carbon dioxide and water into energy-rich carbohydrates and release oxygen as a “waste” product. Plants are considered primary producers. Through respiration, primary consumers eat and digest the plants, converting carbohydrates and oxygen into carbon dioxide, water, and energy.
Herbivores (animals that eat plants) obtain energy directly from
(A) the sun
(B) breathing
(C) carbohydrates
(D) water
3. This graph illustrates the effect of different concentrations of engine coolant on the freezing point of water.
What is the optimum ratio of coolant to water?
(A) 50:50
(B) 100:0
(C) 60:40
(D) 40:60
4. According to the Centers for Disease Control (CDC), “ … cellphones and cordless phones use radiofrequency radiation (RF) to send signals. RF is different from other types of radiation (like X-rays) that we know can be harmful. We don’t know for sure if RF radiation from cellphones can cause health problems years later. The International Agency for Research on Cancer (IARC) has classified RF radiation as a ‘possible human carcinogen.’ (A carcinogen is an agent that causes cancer.)”
Based on this information from the CDC, you can conclude that
(A) Cellphones are safe to use.
(B) Cellphones cause cancer.
(C) Cellphones emit X-rays.
(D) Cellphones emit radiofrequency radiation.
Check your answers:
To answer this question correctly, you need some information not supplied by the question — the fact that fish are classified as coldblooded vertebrates and that coldblooded animals can’t maintain a body temperature (they’re the temperature of their environment). So the opah challenges the classification system because fish are generally classified as coldblooded vertebrates, Choice (B). (Just for the record, other fish, including tuna and sharks, can raise their body temperature temporarily, but they can’t maintain a constant body temperature.)
Through the process of respiration, herbivores break down carbohydrates to release energy, so Choice (C) is correct. If you picked Choice (A), you’re partially right, because the energy originally comes from the sun, but plants convert the radiant energy from the sun into chemical energy stored in carbohydrates, and the question asks where herbivores “obtain energy directly from.” If you picked Choice (B), you’re thinking of a different meaning of “respiration,” and Choice (D) is just plain wrong — water doesn’t provide energy for animals; it has 0 calories.
The graph shows that the freezing point of water/coolant mixture is lowest with 60 percent coolant and 40 percent water, so Choice (C) is correct.
Based on the information provided, the only conclusion you can draw is that cellphones emit RF radiation, Choice (D). None of the other answer choices is supported in the passage.
Predicting an outcome based on data or evidence
The greatest benefits of scientific studies can often be attributed to the fact that their conclusions enable people to predict outcomes. (You probably wish science could help you predict your outcome on the test!) You witness science in action every day you check the weather forecast. By observing barometric pressure, humidity, temperature, the movement of high- and low-pressure systems, and other factors, meteorologists can make reasonable predictions about future weather conditions.
In a similar way, the Science test presents you with scientific information and asks you to predict outcomes based on that information. Here are a couple sample questions to help you practice answering such questions:
1.This graph shows the effect that adding salt to water has on water’s melting and boiling points. One teaspoon of salt is 6 grams, and 1 kilogram of water is approximately 1 quart.
John adds 3 teaspoons of salt (NaCl) to a 6-quart pot of water to boil it at 105° Celsius instead of at the 100° Celsius he is accustomed to, because he read online that adding salt to water increases its boiling point. One teaspoon holds about 6 grams of salt. Did he add enough salt? Yes or No:
2. A certain plant species can have curly or flat leaves. The allele (gene form) for curly leaves is dominant, and the one for flat leaves is recessive. Two plants of the species are crossed, both with curly leaves. The Punnett square for the breeding looks like this, with “C” representing the allele for curly leaves and “c” representing the allele for flat leaves:
What percentage of the offspring is likely to have flat leaves?
(A) 0%
(B) 25%
(C) 50%
(D) 75%
Check your answers:
No. According to the chart, John would need to add more than 250 grams of salt to the water to raise its boiling point 5° Celsius. That’s more than 41 teaspoons of salt! You may have to do a little math in your head to answer this question.
Only 25% of the offspring would be expected to have flat leaves. Because “C” represents the dominant gene, both “CC” and “Cc” offspring would have curly leaves. Only “cc” offspring would have flat leaves.
Answering a scientific question by using sampling techniques
Sampling is a scientific method that enables researchers to draw reasonable conclusions using a relatively small subset of data. For example, researchers may test several different brands of batteries in different devices to determine which battery lasts longest and which devices drain batteries the fastest. On the Science test, you may encounter one or more questions that present sampling data and ask you to draw conclusions from that data. Here are a couple of relatively easy questions to practice on.
Use the data from this table to answer the questions that follow.
Snake Species
Environment
Rat
Milk
Green
King
Fox
Blue Racer
Tree
12
1
22
0
0
3
Forest floor
3
8
3
1
5
7
Farm/meadow
17
23
2
10
15
12
Marsh
2
1
0
25
30
3
1. The snake you are most likely to find in a barn is the
(A) rat snake
(B) milk snake
(C) green snake
(D) king snake
2. Destruction of wetlands would cause the biggest reduction in which of the following populations?
(A) green snake and milk snake
(B) green snake and rat snake
(C) king snake and milk snake
(D) fox snake and king snake
Check your answers:
The milk snake, Choice (B), is most prevalent on farms, where barns are common. (Snake trivia: The milk snake gets its name from a folk tale claiming that the milk snake sucks the milk of nursing mothers and cows. Not true.)
Both the fox snake and king snake are found primarily in marsh habitats (wetlands), so Choice (D) is correct.
Citing evidence from a written source to support a finding or conclusion
You’re most likely to be asked to cite evidence from a written source to support a finding or conclusion when you encounter a short answer or extended response question on the Science test. To write an effective response, you need to use evidence from the reading passage to support any claims you make. You may include direct quotes from the passage or describe the evidence in your own words. (Remember, these short answer questions are timed as part of the test, not separately. It is up to you to manage your time appropriately.)
Read the following passage from NASA, an excerpt from “Dark Energy, Dark Matter,” and write a short response to the prompt as directed. Write your answer on a separate piece of paper. This question should take you about 10 minutes to complete.
In the early 1990s, one thing was fairly certain about the expansion of the Universe. It might have enough energy density to stop its expansion and recollapse, it might have so little energy density that it would never stop expanding, but gravity was certain to slow the expansion as time went on. Granted, the slowing had not been observed, but, theoretically, the Universe had to slow. The Universe is full of matter and the attractive force of gravity pulls all matter together. Then came 1998 and the Hubble Space Telescope (HST) observations of very distant supernovae that showed that, a long time ago, the Universe was actually expanding more slowly than it is today. So the expansion of the Universe has not been slowing due to gravity, as everyone thought, it has been accelerating. No one expected this, no one knew how to explain it. But something was causing it.
Eventually, theorists came up with three sorts of explanations. Maybe it was a result of a long-discarded version of Einstein’s theory of gravity, one that contained what was called a cosmological constant. Maybe there was some strange kind of energy-fluid that filled space. Maybe there is something wrong with Einstein’s theory of gravity, and a new theory could include some kind of field that creates this cosmic acceleration. Theorists still don’t know what the correct explanation is, but they have given the solution a name. It is called dark energy.
What Is Dark Energy?
More is unknown than is known. We know how much dark energy there is because we know how it affects the Universe’s expansion. Other than that, it is a complete mystery. But it is an important mystery. It turns out that roughly 68% of the Universe is dark energy. Dark matter makes up about 27%. The rest — everything on Earth, everything ever observed with all of our instruments, all normal matter — adds up to less than 5% of the Universe. Come to think of it, maybe it shouldn’t be called “normal” matter at all, since it is such a small fraction of the Universe.
One explanation for dark energy is that it is a property of space. Albert Einstein was the first person to realize that empty space is not nothing. Space has amazing properties, many of which are just beginning to be understood. The first property that Einstein discovered is that it is possible for more space to come into existence. Then one version of Einstein’s gravity theory, the version that contains a cosmological constant, makes a second prediction: “empty space” can possess its own energy. Because this energy is a property of space itself, it would not be diluted as space expands. As more space comes into existence, more of this energy-of-space would appear. As a result, this form of energy would cause the Universe to expand faster and faster. Unfortunately, no one understands why the cosmological constant should even be there, much less why it would have exactly the right value to cause the observed acceleration of the Universe.
What is dark energy and what enables it to accelerate the expansion of the universe?
You have to evaluate your response yourself, but in this case, what’s most important is your use of evidence from the reading passage to support whatever claims you made. The Science short-answer questions receive a score between 0 and 3 points. To earn 3 points, you need to provide a clear and detailed answer, along with supporting evidence from the passage. You must ensure you actually answer the question and use facts and data from the passage to support your answer. The answer can be one or two paragraphs, ranging from 50 to 300 words. The answer must be clear and to the point, and your statements justified by the content and your interpretation of that content. Writing style, grammar, and spelling are not part of the evaluation.
If you did that, give yourself a 3. If you simply made claims without citing evidence from the passage, you may want to try writing your response again.
Reconciling Multiple Findings, Conclusions, or Theories
Scientists often must draw conclusions from two or more findings, conclusions, or theories to identify the cause of a certain phenomenon and answer questions. On the test, you may be called on to step into the shoes of a scientist and reconcile results from two or more studies with other data, or you may be asked questions related to incidents in which scientists reconciled other theories or hypotheses.
To answer such questions successfully, examine the data and the question carefully for clues. The information you’re given points the way to the correct answer. The following reading passage and questions challenge your ability to evaluate how scientists use existing knowledge from two sources to formulate questions and arrive at a conclusion.
Questions 1-2 refer to the following passage, “What connects fish and maple trees?” from the National Science Foundation.
If we are what we eat, some lake fish, it turns out, are made of maple leaves. These fallen leaves play an integral role in the food webs of lakes.
It has long been thought that aquatic plants form the base of a lake’s food web. The energy they contain supports life, from invertebrates to the largest sport fish. Now, a study funded by the National Science Foundation’s (NSF) Biological Sciences Directorate shows that aquatic plants are receiving a little help from trees along the shoreline.
Scientists Michael Pace and Jonathan Cole of the Institute for Ecosystem Studies in Millbrook, New York, found that a significant part of the aquatic food chain is supported by organic matter (“food”) that originates on shore.
A building block of life, organic carbon is essential to aquatic food webs. In lakes, aquatic plants produce this carbon by harnessing the sun’s energy through photosynthesis. Some of the carbon supports the growth of fish and invertebrate populations.
In Lakes Peter and Paul at the University of Notre Dame Research Center, scientists conducted tests to determine whether lake plant production was enough to support resident aquatic life.
The short answer: It’s not. Test results show that aquatic plants don’t produce nearly enough food to support lake animals. Therefore, to survive and thrive, the lake animals are dependent on inputs from the surrounding shores.
Leaves and other organic matter that enter lakes, it turns out, are ultimately incorporated into aquatic animals. That maple leaves may eventually become perch, and that the vegetation around a lake can have profound impacts on the animal life within that lake, blurs the boundaries between aquatic and land-based ecosystems.
As naturalist John Muir once wrote, tug on one strand of nature, and you’ll find it connects to all others.
1. Which of the following conclusions can be drawn from the evidence presented?
(A) Aquatic plants do not produce enough organic matter to support resident aquatic life, so fish must eat tree leaves.
(B) Fish cannot obtain sufficient amounts of food from aquatic plants, so they need to eat aquatic invertebrates to survive.
(C) Aquatic plants do not produce sufficient carbon to support resident aquatic life, so the carbon must be coming from plants along the shoreline.
(D) Shoreline vegetation supplies sufficient energy to support resident aquatic life without the addition of aquatic plant production.
2. Which of the following is a fact about food chains that caused researchers to question whether aquatic plant production was sufficient to support resident aquatic life?
(A) All energy in a food chain comes from the sun.
(B) In lakes, aquatic plants produce all the food required to support resident aquatic life.
(C) All aquatic animals obtain their energy directly from plants.
(D) In food chains, secondary consumers eat primary consumers.
Check your answers:
By studying the amount of aquatic plants and animals, researchers concluded that the animal population was greater than the aquatic plant life could support, so additional plant life would need to be added, and the only place it could possibly come from is around the shoreline, Choice (C).
In arriving at their conclusion, scientists needed to reconcile knowledge about food chains and the photosynthetic process. Through photosynthesis, plants convert radiant energy from the sun into chemical energy that animals can eat. A population is limited by the amount of energy plants can harvest from the sun. So the fact about food chains that the researchers used to arrive at their conclusion is that all energy in a food chain comes from the sun, Choice (A).
 This chapter contains a few short-answer items that test a different set of skills than do the regular questions. We include these questions to give you practice responding to this type of question and develop a means of self-evaluating your response. If you can do that effectively, you’ll have an advantage on the Science test.
 When answering multiple-choice questions, if you don’t know the answer, make an intelligent guess. Eliminate obviously wrong answers and then choose from the remaining answers to improve your chances of guessing the correct answer. You’re not penalized for wrong answers; you receive a 0 (zero) for a wrong answer, which is what you’d receive for no answer.
 The following diagram represents a typical energy pyramid.