No one likes doing the same problem over and over again—that’s why mathematicians invented algebra. Algebra takes the basic principles of math and makes them more general, so we can solve a problem once and then use that solution to solve a group of similar problems.
In arithmetic, you’ve dealt with numbers and their arithmetical operations (such as ![]() ). In algebra, we use symbols called variables (which are usually letters, such as
). In algebra, we use symbols called variables (which are usually letters, such as ![]() ) to represent numbers and sometimes processes.
) to represent numbers and sometimes processes.
For example, we might use the letter ![]() to represent some number we don’t know yet, which we might need to figure out in the course of a problem. Or we might use two letters, like
to represent some number we don’t know yet, which we might need to figure out in the course of a problem. Or we might use two letters, like ![]() and
and ![]() , to show a relationship between two numbers without needing to know what the actual numbers are. The same letters can represent a wide range of possible numbers, and the same letter may represent completely different numbers when used in two different problems.
, to show a relationship between two numbers without needing to know what the actual numbers are. The same letters can represent a wide range of possible numbers, and the same letter may represent completely different numbers when used in two different problems.
Using variables offers advantages over solving each problem “from scratch.” With variables, we can:
Example 1
Write an algebraic expression for the perimeter and area of the rectangle below.
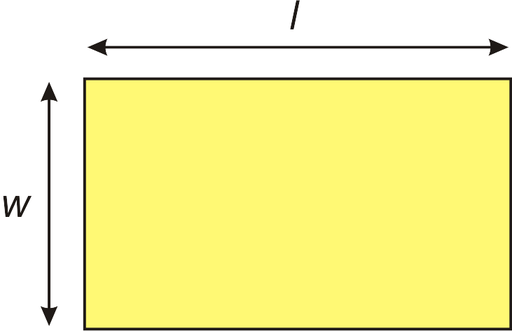
To find the perimeter, we add the lengths of all 4 sides. We can still do this even if we don’t know the side lengths in numbers, because we can use variables like ![]() and
and ![]() to represent the unknown length and width. If we start at the top left and work clockwise, and if we use the letter
to represent the unknown length and width. If we start at the top left and work clockwise, and if we use the letter ![]() to represent the perimeter, then we can say:
to represent the perimeter, then we can say:
![]()
We are adding ![]() ’s and
’s and ![]() 's, so we can say that:
's, so we can say that:
![]()
It's customary in algebra to omit multiplication symbols whenever possible. For example, ![]() means the same thing as
means the same thing as ![]() or
or ![]() . We can therefore also write:
. We can therefore also write:
![]()
Area is length multiplied by width. In algebraic terms we get:
![]()
Note: ![]() by itself is an example of a variable expression;
by itself is an example of a variable expression; ![]() is an example of an equation. The main difference between expressions and equations is the presence of an equals sign (=).
is an example of an equation. The main difference between expressions and equations is the presence of an equals sign (=).
In the above example, we found the simplest possible ways to express the perimeter and area of a rectangle when we don’t yet know what its length and width actually are. Now, when we encounter a rectangle whose dimensions we do know, we can simply substitute (or plug in) those values in the above equations. In this chapter, we will encounter many expressions that we can evaluate by plugging in values for the variables involved.
When we are given an algebraic expression, one of the most common things we might have to do with it is evaluate it for some given value of the variable. The following example illustrates this process.
Example 2
Let ![]() . Find the value of
. Find the value of ![]() .
.
To find the solution, we substitute 12 for ![]() in the given expression. Every time we see
in the given expression. Every time we see ![]() , we replace it with 12.
, we replace it with 12.
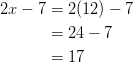
Note: At this stage of the problem, we place the substituted value in parentheses. We do this to make the written-out problem easier to follow, and to avoid mistakes. (If we didn’t use parentheses and also forgot to add a multiplication sign, we would end up turning ![]() into 212 instead of 2 times 12!)
into 212 instead of 2 times 12!)
Example 3
Let ![]() Find the value of
Find the value of ![]() .
.
Solution
Many expressions have more than one variable in them. For example, the formula for the perimeter of a rectangle in the introduction has two variables: length ![]() and width
and width ![]() . In these cases, be careful to substitute the appropriate value in the appropriate place.
. In these cases, be careful to substitute the appropriate value in the appropriate place.
Example 5
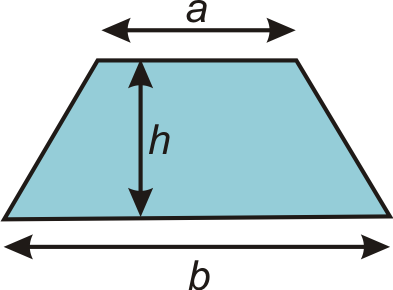
The area of a trapezoid is given by the equation ![]() . Find the area of a trapezoid with bases
. Find the area of a trapezoid with bases ![]() and
and ![]() and height
and height ![]() .
.
To find the solution to this problem, we simply take the values given for the variables ![]() and
and ![]() , and plug them in to the expression for
, and plug them in to the expression for ![]() :
:
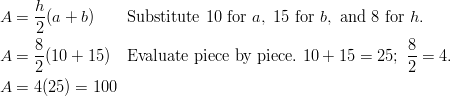
Solution: The area of the trapezoid is 100 square centimeters.
Many formulas and equations in mathematics contain exponents. Exponents are used as a short-hand notation for repeated multiplication. For example:
![]()
The exponent stands for how many times the number is used as a factor (multiplied). When we deal with integers, it is usually easiest to simplify the expression. We simplify:
![]()
However, we need exponents when we work with variables, because it is much easier to write ![]() than
than ![]() .
.
To evaluate expressions with exponents, substitute the values you are given for each variable and simplify. It is especially important in this case to substitute using parentheses in order to make sure that the simplification is done correctly.
For a more detailed review of exponents and their properties, check out the video at http://www.mathvids.com/lesson/mathhelp/863-exponents---basics.
Example 5
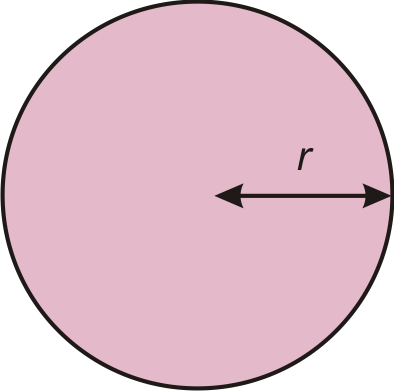
The area of a circle is given by the formula ![]() . Find the area of a circle with radius
. Find the area of a circle with radius ![]() .
.
Substitute values into the equation.
![]()
The area is approximately 907.92 square inches.
Example 6
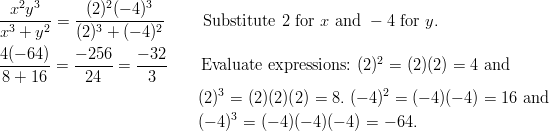
Find the value of ![]() , for
, for ![]() and
and ![]() .
.
Substitute the values of ![]() and
and ![]() in the following.
in the following.
Example 7
The height ![]() of a ball in flight is given by the formula
of a ball in flight is given by the formula ![]() , where the height is given in feet and the time
, where the height is given in feet and the time ![]() is given in seconds. Find the height of the ball at time
is given in seconds. Find the height of the ball at time ![]() .
.
Solution
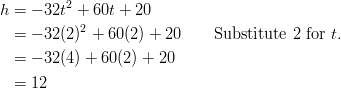
The height of the ball is 12 feet.
Look at and evaluate the following expression:
![]()
How many different ways can we interpret this problem, and how many different answers could someone possibly find for it?
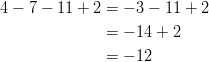
The simplest way to evaluate the expression is simply to start at the left and work your way across:

This is the answer you would get if you entered the expression into an ordinary calculator. But if you entered the expression into a scientific calculator or a graphing calculator you would probably get 29 as the answer.
In mathematics, the order in which we perform the various operations (such as adding, multiplying, etc.) is important. In the expression above, the operation of multiplication takes precedence over addition, so we evaluate it first. Let’s re-write the expression, but put the multiplication in brackets to show that it is to be evaluated first.
![]()
First evaluate the brackets: ![]() . Our expression becomes:
. Our expression becomes:
![]()
When we have only addition and subtraction, we start at the left and work across:

Algebra students often use the word “PEMDAS” to help remember the order in which we evaluate the mathematical expressions: Parentheses, Exponents, Multiplication, Division, Addition and Subtraction.
 or
or
The first step in the order of operations is called parentheses, but we include all grouping symbols in this step—not just parentheses ![]() , but also square brackets
, but also square brackets ![[ \ ]](ck12_1_files/20111017225906636464.png) and curly braces { }.
and curly braces { }.
Example 1
Evaluate the following:
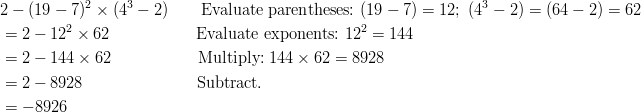
a) ![]()
b) ![]()
c) ![]()
Each of these expressions has the same numbers and the same mathematical operations, in the same order. The placement of the various grouping symbols means, however, that we must evaluate everything in a different order each time. Let's look at how we evaluate each of these examples.
a) This expression doesn't have parentheses, exponents, multiplication, or division. PEMDAS states that we treat addition and subtraction as they appear, starting at the left and working right (it’s NOT addition then subtraction).
b) This expression has parentheses, so we first evaluate ![]() . Remember that when we subtract a negative it is equivalent to adding a positive:
. Remember that when we subtract a negative it is equivalent to adding a positive:
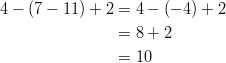
c) An expression can contain any number of sets of parentheses. Sometimes expressions will have sets of parentheses inside other sets of parentheses. When faced with nested parentheses, start at the innermost parentheses and work outward.
Brackets may also be used to group expressions which already contain parentheses. This expression has both brackets and parentheses. We start with the innermost group: ![]() . Then we complete the operation in the brackets.
. Then we complete the operation in the brackets.
![4 - [7 - (11 + 2)] &= 4 - [7 - (13)]\ &= 4 - [-6]\ &= 10](ck12_math_images_dir/7fabbcbb3bd0e32dd604d4a84615357d.png)
Example 2
Evaluate the following:
a) ![]()
b) ![]()
c) ![]()
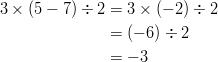
a) There are no grouping symbols. PEMDAS dictates that we multiply and divide first, working from left to right: ![]() and
and ![]() . (NOTE: It’s not multiplication then division.) Next we subtract:
. (NOTE: It’s not multiplication then division.) Next we subtract:
![]()
b) First, we evaluate the expression inside the parentheses: ![]() . Then work from left to right:
. Then work from left to right:
c) First, we evaluate the expressions inside parentheses: ![]() and
and ![]() . Then work from left to right:
. Then work from left to right:
![]()
Note that adding parentheses didn’t change the expression in part c, but did make it easier to read. Parentheses can be used to change the order of operations in an expression, but they can also be used simply to make it easier to understand.
We can also use the order of operations to simplify an expression that has variables in it, after we substitute specific values for those variables.
Example 3
Use the order of operations to evaluate the following:
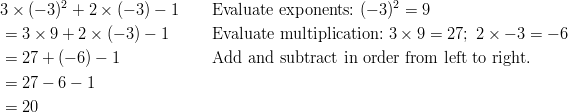
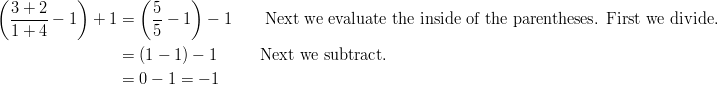
a) ![]() when
when ![]()
b) ![]() when
when ![]()
c) ![]() when
when ![]() and
and ![]()
a) The first step is to substitute the value for ![]() into the expression. We can put it in parentheses to clarify the resulting expression.
into the expression. We can put it in parentheses to clarify the resulting expression.
![]()
(Note: ![]() is the same as
is the same as ![]() .)
.)
Follow PEMDAS - first parentheses. Inside parentheses follow PEMDAS again.
![]()
b) The first step is to substitute the value for ![]() into the expression.
into the expression.
![]()
Follow PEMDAS: we cannot simplify the expressions in parentheses, so exponents come next.
c) The first step is to substitute the values for ![]() and
and ![]() into the expression.
into the expression.
![]()
Follow PEMDAS:
In parts (b) and (c) we left the parentheses around the negative numbers to clarify the problem. They did not affect the order of operations, but they did help avoid confusion when we were multiplying negative numbers.
Part (c) in the last example shows another interesting point. When we have an expression inside the parentheses, we use PEMDAS to determine the order in which we evaluate the contents.
Fraction bars count as grouping symbols for PEMDAS, so we evaluate them in the first step of solving an expression. All numerators and all denominators can be treated as if they have invisible parentheses around them. When real parentheses are also present, remember that the innermost grouping symbols come first. If, for example, parentheses appear on a numerator, they would take precedence over the fraction bar. If the parentheses appear outside of the fraction, then the fraction bar takes precedence.
Example 4
Use the order of operations to evaluate the following expressions:
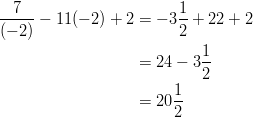
a) ![]() when
when ![]()
b) ![]() when
when ![]() and
and ![]()
c) ![]() when
when ![]() and
and ![]()
a) We substitute the value for ![]() into the expression.
into the expression.
![]()
Although this expression has no parentheses, the fraction bar is also a grouping symbol—it has the same effect as a set of parentheses. We can write in the “invisible parentheses” for clarity:
![]()
Using PEMDAS, we first evaluate the numerator:
![]()
We can convert ![]() to a mixed number:
to a mixed number:
![]()
Then evaluate the expression:
![]()
b) We substitute the values for ![]() and
and ![]() into the expression:
into the expression:
![]()
This expression has nested parentheses (remember the effect of the fraction bar). The innermost grouping symbol is provided by the fraction bar. We evaluate the numerator ![]() and denominator
and denominator ![]() first.
first.
c) We substitute the values for ![]() and
and ![]() into the expression:
into the expression:
![]()
This complicated expression has several layers of nested parentheses. One method for ensuring that we start with the innermost parentheses is to use more than one type of parentheses. Working from the outside, we can leave the outermost brackets as parentheses ![]() . Next will be the “invisible brackets” from the fraction bar; we will write these as
. Next will be the “invisible brackets” from the fraction bar; we will write these as ![[ \ ]](ck12_1_files/20111017225906654734.png) . The third level of nested parentheses will be the { }. We will leave negative numbers in round brackets.
. The third level of nested parentheses will be the { }. We will leave negative numbers in round brackets.
![& 2 \times \left ( \frac {[11 + \left \{3 - 2(-2)\right \}] } { \left [ \left \{1 + 2\right \}^2 \right ] } - 1 \right ) \qquad \text{Start with the innermost grouping sign:} \ \left \{ \right \}. \ & \qquad \qquad \qquad \qquad \qquad \qquad \qquad \ \ \left \{1 + 2\right \} = 3; \ \left \{3 - 2(-2)\right \} = 3 + 4 = 7\ & = 2 \left ( \frac{ [11 + 7] } { [3^2] } - 1 \right ) \qquad \qquad \qquad \text{Next, evaluate the square brackets.}\ & = 2 \left ( \frac { 18 } { 9 } - 1 \right ) \qquad \qquad \qquad \qquad \ \text{Next, evaluate the round brackets. Start with division.}\ & =2(2 - 1) \qquad \qquad \qquad \qquad \quad \ \ \text{Finally, do the addition and subtraction.}\ & =2(1) = 2](ck12_math_images_dir/35e4b2c43185cca0cef9b2d9bb39fa22.png)
A graphing calculator is a very useful tool in evaluating algebraic expressions. Like a scientific calculator, a graphing calculator follows PEMDAS. In this section we will explain two ways of evaluating expressions with the graphing calculator.
Example 5
Evaluate ![]() when
when ![]() .
.
Method 1: Substitute for the variable first. Then evaluate the numerical expression with the calculator.
Substitute the value ![]() into the expression.
into the expression.
![]()
Input this in the calculator just as it is and press [ENTER]. (Note: use ![]() to enter exponents)
to enter exponents)
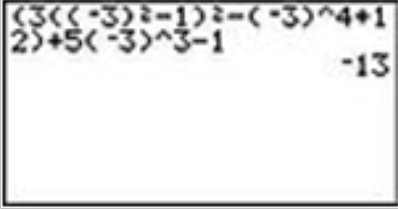
The answer is -13.
Method 2: Input the original expression in the calculator first and then evaluate.
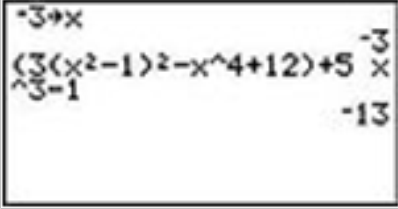
First, store the value ![]() in the calculator. Type -3 [STO]
in the calculator. Type -3 [STO] ![]() (The letter
(The letter ![]() can be entered using the
can be entered using the ![]() [VAR] button or [ALPHA] + [STO]). Then type the original expression in the calculator and press [ENTER].
[VAR] button or [ALPHA] + [STO]). Then type the original expression in the calculator and press [ENTER].
The answer is -13.
The second method is better because you can easily evaluate the same expression for any value you want. For example, let’s evaluate the same expression using the values ![]() and
and ![]() .
.
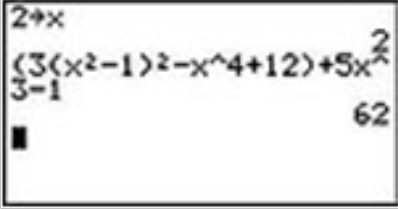
For ![]() , store the value of
, store the value of ![]() in the calculator:
in the calculator: ![]() [STO]
[STO] ![]() . Press [2nd] [ENTER] twice to get the previous expression you typed in on the screen without having to enter it again. Press [ENTER] to evaluate the expression.
. Press [2nd] [ENTER] twice to get the previous expression you typed in on the screen without having to enter it again. Press [ENTER] to evaluate the expression.
The answer is 62.
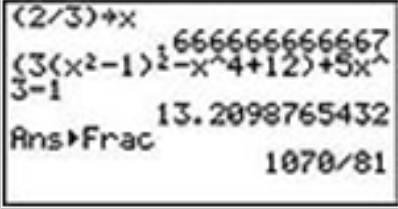
For ![]() , store the value of
, store the value of ![]() in the calculator:
in the calculator: ![]() [STO]
[STO] ![]() . Press [2nd] [ENTER] twice to get the expression on the screen without having to enter it again. Press [ENTER] to evaluate.
. Press [2nd] [ENTER] twice to get the expression on the screen without having to enter it again. Press [ENTER] to evaluate.
The answer is 13.21, or ![]() in fraction form.
in fraction form.
Note: On graphing calculators there is a difference between the minus sign and the negative sign. When we stored the value negative three, we needed to use the negative sign which is to the left of the [ENTER] button on the calculator. On the other hand, to perform the subtraction operation in the expression we used the minus sign. The minus sign is right above the plus sign on the right.
You can also use a graphing calculator to evaluate expressions with more than one variable.
Example 7
Evaluate the expression ![]() for
for ![]() .
.
Solution

Store the values of ![]() and
and ![]() : -2 [STO]
: -2 [STO] ![]() , 1 [STO]
, 1 [STO] ![]() . (The letters
. (The letters ![]() and
and ![]() can be entered using [ALPHA] + [KEY].) Input the expression in the calculator. When an expression includes a fraction, be sure to use parentheses:
can be entered using [ALPHA] + [KEY].) Input the expression in the calculator. When an expression includes a fraction, be sure to use parentheses: ![]() .
.
Press [ENTER] to obtain the answer ![]() or
or ![]() .
.
For more practice, you can play an algebra game involving order of operations online at http://www.funbrain.com/algebra/index.html.
In mathematics, and especially in algebra, we look for patterns in the numbers we see. The tools of algebra help us describe these patterns with words and with equations (formulas or functions). An equation is a mathematical recipe that gives the value of one variable in terms of another.
For example, if a theme park charges $12 admission, then the number of people who enter the park every day and the amount of money taken in by the ticket office are related mathematically, and we can write a rule to find the amount of money taken in by the ticket office.
In words, we might say “The amount of money taken in is equal to twelve times the number of people who enter the park.”
We could also make a table. The following table relates the number of people who visit the park and the total money taken in by the ticket office.
![]()
Clearly, we would need a big table to cope with a busy day in the middle of a school vacation!
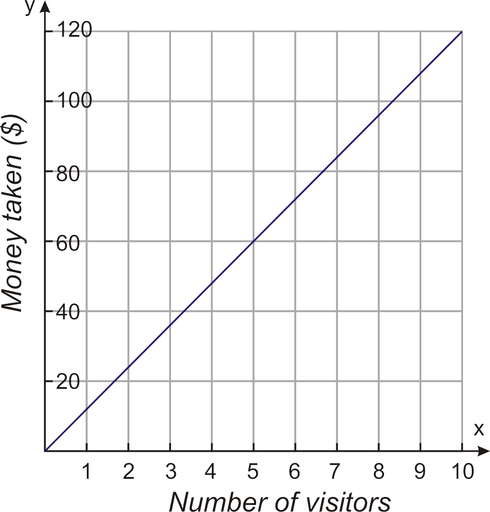
A third way we might relate the two quantities (visitors and money) is with a graph. If we plot the money taken in on the vertical axis and the number of visitors on the horizontal axis, then we would have a graph that looks like the one shown below. Note that this graph shows a smooth line that includes non-whole number values of ![]() (e.g.
(e.g. ![]() ). In real life this would not make sense, because fractions of people can’t visit a park. This is an issue of domain and range, something we will talk about later.
). In real life this would not make sense, because fractions of people can’t visit a park. This is an issue of domain and range, something we will talk about later.
The method we will examine in detail in this lesson is closer to the first way we chose to describe the relationship. In words we said that “The amount of money taken in is twelve times the number of people who enter the park.” In mathematical terms we can describe this sort of relationship with variables. A variable is a letter used to represent an unknown quantity. We can see the beginning of a mathematical formula in the words:
The amount of money taken in is twelve times the number of people who enter the park.
This can be translated to:
![]()
We can now see which quantities can be assigned to letters. First we must state which letters (or variables) relate to which quantities. We call this defining the variables:
Let ![]() the number of people who enter the theme park.
the number of people who enter the theme park.
Let ![]() the total amount of money taken in at the ticket office.
the total amount of money taken in at the ticket office.
We now have a fourth way to describe the relationship: with an algebraic equation.
![]()
Writing a mathematical equation using variables is very convenient. You can perform all of the operations necessary to solve this problem without having to write out the known and unknown quantities over and over again. At the end of the problem, you just need to remember which quantities ![]() and
and ![]() represent.
represent.
An equation is a term used to describe a collection of numbers and variables related through mathematical operators. An algebraic equation will contain letters that represent real quantities. For example, if we wanted to use the algebraic equation in the example above to find the money taken in for a certain number of visitors, we would substitute that number for ![]() and then solve the resulting equation for
and then solve the resulting equation for ![]() .
.
Example 1
A theme park charges $12 entry to visitors. Find the money taken in if 1296 people visit the park.
Let’s break the solution to this problem down into steps. This will be a useful strategy for all the problems in this lesson.
Step 1: Extract the important information.
![]()
Step 2: Translate into a mathematical equation. To do this, we pick variables to stand for the numbers.
![]()
![]()
Step 3: Substitute in any known values for the variables.

Step 4: Solve the equation.
![]()
The amount of money taken in is $15552.
Step 5: Check the result.
If $15552 is taken at the ticket office and tickets are $12, then we can divide the total amount of money collected by the price per individual ticket.
![]()
1296 is indeed the number of people who entered the park. The answer checks out.
Example 2
The following table shows the relationship between two quantities. First, write an equation that describes the relationship. Then, find out the value of ![]() when
when ![]() is 750.
is 750.
![]()
Step 1: Extract the important information.
We can see from the table that every time ![]() increases by 10,
increases by 10, ![]() increases by 20. However,
increases by 20. However, ![]() is not simply twice the value of
is not simply twice the value of ![]() . We can see that when
. We can see that when ![]() , and this gives a clue as to what rule the pattern follows. The rule linking
, and this gives a clue as to what rule the pattern follows. The rule linking ![]() and
and ![]() is:
is:
“To find ![]() , double the value of
, double the value of ![]() and add 20.”
and add 20.”
Step 2: Translate into a mathematical equation:
Table 1.1
| Text | Translates to | Mathematical Expression |
|
“To find |
|
|
|
“double the value of |
|
|
| “add 20” |
|
+ 20 |
Our equation is ![]()
Step 3: Solve the equation.
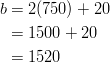
The original problem asks for the value of ![]() when
when ![]() is 750. When
is 750. When ![]() is 750,
is 750, ![]() becomes
becomes ![]() . Following the order of operations, we get:
. Following the order of operations, we get:
Step 4: Check the result.
In some cases you can check the result by plugging it back into the original equation. Other times you must simply double-check your math. In either case, checking your answer is always a good idea. In this case, we can plug our answer for ![]() into the equation, along with the value for
into the equation, along with the value for ![]() , and see what comes out.
, and see what comes out. ![]() is TRUE because both sides of the equation are equal. A true statement means that the answer checks out.
is TRUE because both sides of the equation are equal. A true statement means that the answer checks out.
In the last example we developed a rule, written in words, as a way to develop an algebraic equation. We will develop this further in the next few examples.
Example 3
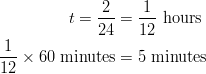
The following table shows the values of two related quantities. Write an equation that describes the relationship mathematically.
Table 1.2
|
|
|
| -2 | 10 |
| 0 | 0 |
| 2 | -10 |
| 4 | -20 |
| 6 | -30 |
Step 1: Extract the important information.
We can see from the table that ![]() is five times bigger than
is five times bigger than ![]() . The value for
. The value for ![]() is negative when
is negative when ![]() is positive, and it is positive when
is positive, and it is positive when ![]() is negative. Here is the rule that links
is negative. Here is the rule that links ![]() and
and ![]() :
:
“![]() is the negative of five times the value of
is the negative of five times the value of ![]() ”
”
Step 2: Translate this statement into a mathematical equation.
Table 1.3
| Text | Translates to | Mathematical Expression |
|
“ |
|
|
|
“negative 5 times the value of |
|
|
Our equation is ![]() .
.
Step 3: There is nothing in this problem to solve for. We can move to Step 4.
Step 4: Check the result.
In this case, the way we would check our answer is to use the equation to generate our own ![]() pairs. If they match the values in the table, then we know our equation is correct. We will plug in -2, 0, 2, 4, and 6 for
pairs. If they match the values in the table, then we know our equation is correct. We will plug in -2, 0, 2, 4, and 6 for ![]() and solve for
and solve for ![]() :
:
Table 1.4
|
|
|
| -2 |
|
| 0 |
|
| 2 |
|
| 4 |
|
| 6 |
|
The ![]() values in this table match the ones in the earlier table. The answer checks out.
values in this table match the ones in the earlier table. The answer checks out.
Example 4
Zarina has a $100 gift card, and she has been spending money on the card in small regular amounts. She checks the balance on the card weekly and records it in the following table.
Table 1.5
| Week Number | Balance ($) |
| 1 | 100 |
| 2 | 78 |
| 3 | 56 |
| 4 | 34 |
Write an equation for the money remaining on the card in any given week.
Step 1: Extract the important information.
The balance remaining on the card is not just a constant multiple of the week number; 100 is 100 times 1, but 78 is not 100 times 2. But there is still a pattern: the balance decreases by 22 whenever the week number increases by 1. This suggests that the balance is somehow related to the amount “-22 times the week number.”
In fact, the balance equals “-22 times the week number, plus something.” To determine what that something is, we can look at the values in one row on the table—for example, the first row, where we have a balance of $100 for week number 1.
Step 2: Translate into a mathematical equation.
First, we define our variables. Let ![]() stand for the week number and
stand for the week number and ![]() for the balance.
for the balance.
Then we can translate our verbal expression as follows:
Table 1.6
| Text | Translates to | Mathematical Expression |
| Balance equals -22 times the week number, plus something. |
|
|
To find out what that ? represents, we can plug in the values from that first row of the table, where ![]() and
and ![]() . This gives us
. This gives us ![]() .
.
So what number gives 100 when you add -22 to it? The answer is 122, so that is the number the ? stands for. Now our final equation is:
![]()
Step 3: All we were asked to find was the expression. We weren't asked to solve it, so we can move to Step 4.
Step 4: Check the result.
To check that this equation is correct, we see if it really reproduces the data in the table. To do that we plug in values for ![]() :
:
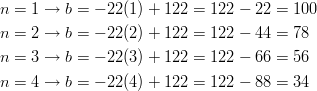
The equation perfectly reproduces the data in the table. The answer checks out.
Let’s solve the following real-world problem by using the given information to write a mathematical equation that can be solved for a solution.
Example 5
A group of students are in a room. After 25 students leave, it is found that ![]() of the original group is left in the room. How many students were in the room at the start?
of the original group is left in the room. How many students were in the room at the start?
Step 1: Extract the important information
We know that 25 students leave the room.
We know that ![]() of the original number of students are left in the room.
of the original number of students are left in the room.
We need to find how many students were in the room at the start.
Step 2: Translate into a mathematical equation. Initially we have an unknown number of students in the room. We can refer to this as the original number.
Let’s define the variable ![]() the original number of students in the room. After 25 students leave the room, the number of students in the room is
the original number of students in the room. After 25 students leave the room, the number of students in the room is ![]() . We also know that the number of students left is
. We also know that the number of students left is ![]() of
of ![]() . So we have two expressions for the number of students left, and those two expressions are equal because they represent the same number. That means our equation is:
. So we have two expressions for the number of students left, and those two expressions are equal because they represent the same number. That means our equation is:
![]()
Step 3: Solve the equation.
Add 25 to both sides.
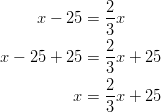
Subtract ![]() from both sides.
from both sides.
Multiply both sides by 3.

Remember that ![]() represents the original number of students in the room. So, there were 75 students in the room to start with.
represents the original number of students in the room. So, there were 75 students in the room to start with.
Step 4: Check the answer:
If we start with 75 students in the room and 25 of them leave, then there are ![]() students left in the room.
students left in the room.
![]() of the original number is
of the original number is ![]() .
.
This means that the number of students who are left over equals ![]() of the original number. The answer checks out.
of the original number. The answer checks out.
The method of defining variables and writing a mathematical equation is the method you will use the most in an algebra course. This method is often used together with other techniques such as making a table of values, creating a graph, drawing a diagram and looking for a pattern.
Table 1.7
| Day | Profit |
| 1 | 20 |
| 2 | 40 |
| 3 | 60 |
| 4 | 80 |
| 5 | 100 |
In algebra, an equation is a mathematical expression that contains an equals sign. It tells us that two expressions represent the same number. For example, ![]() is an equation. An inequality is a mathematical expression that contains inequality signs. For example,
is an equation. An inequality is a mathematical expression that contains inequality signs. For example, ![]() is an inequality. Inequalities are used to tell us that an expression is either larger or smaller than another expression. Equations and inequalities can contain both variables and constants.
is an inequality. Inequalities are used to tell us that an expression is either larger or smaller than another expression. Equations and inequalities can contain both variables and constants.
Variables are usually given a letter and they are used to represent unknown values. These quantities can change because they depend on other numbers in the problem.
Constants are quantities that remain unchanged. Ordinary numbers like ![]() and
and ![]() are constants.
are constants.
Equations and inequalities are used as a shorthand notation for situations that involve numerical data. They are very useful because most problems require several steps to arrive at a solution, and it becomes tedious to repeatedly write out the situation in words.
Here are some examples of equations:
![]()
To write an inequality, we use the following symbols:
> greater than
![]() greater than or equal to
greater than or equal to
< less than
![]() less than or equal to
less than or equal to
![]() not equal to
not equal to
Here are some examples of inequalities:
![]()
The most important skill in algebra is the ability to translate a word problem into the correct equation or inequality so you can find the solution easily. The first two steps are defining the variables and translating the word problem into a mathematical equation.
Defining the variables means that we assign letters to any unknown quantities in the problem.
Translating means that we change the word expression into a mathematical expression containing variables and mathematical operations with an equal sign or an inequality sign.
Example 1
Define the variables and translate the following expressions into equations.
a) A number plus 12 is 20.
b) 9 less than twice a number is 33.
c) $20 was one quarter of the money spent on the pizza.
Solution
a) Define
Let ![]() the number we are seeking.
the number we are seeking.
Translate
A number plus 12 is 20.
![]()
b) Define
Let ![]() the number we are seeking.
the number we are seeking.
Translate
9 less than twice a number is 33.
This means that twice the number, minus 9, is 33.
![]()
c) Define
Let ![]() the money spent on the pizza.
the money spent on the pizza.
Translate
$20 was one quarter of the money spent on the pizza.
![]()
Often word problems need to be reworded before you can write an equation.
Example 2
Find the solution to the following problems.
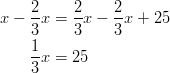
a) Shyam worked for two hours and packed 24 boxes. How much time did he spend on packing one box?
b) After a 20% discount, a book costs $12. How much was the book before the discount?
Solution
a) Define
Let ![]() time it takes to pack one box.
time it takes to pack one box.
Translate
Shyam worked for two hours and packed 24 boxes. This means that two hours is 24 times the time it takes to pack one box.
![]()
Solve
Answer
Shyam takes 5 minutes to pack a box.
b) Define
Let ![]() the price of the book before the discount.
the price of the book before the discount.
Translate
After a 20% discount, the book costs $12. This means that the price minus 20% of the price is $12.
![]()
Solve
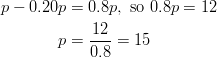
Answer
The price of the book before the discount was $15.
Check
If the original price was $15, then the book was discounted by 20% of $15, or $3. ![]() . The answer checks out.
. The answer checks out.
Example 3
Define the variables and translate the following expressions into inequalities.
a) The sum of 5 and a number is less than or equal to 2.
b) The distance from San Diego to Los Angeles is less than 150 miles.
c) Diego needs to earn more than an 82 on his test to receive a ![]() in his algebra class.
in his algebra class.
d) A child needs to be 42 inches or more to go on the roller coaster.
Solution
a) Define
Let ![]() the unknown number.
the unknown number.
Translate
![]()
b) Define
Let ![]() the distance from San Diego to Los Angeles in miles.
the distance from San Diego to Los Angeles in miles.
Translate
![]()
c) Define
Let ![]() Diego’s test grade.
Diego’s test grade.
Translate
![]()
d) Define
Let ![]() the height of child in inches.
the height of child in inches.
Translate:
![]()
You will often need to check solutions to equations in order to check your work. In a math class, checking that you arrived at the correct solution is very good practice. We check the solution to an equation by replacing the variable in an equation with the value of the solution. A solution should result in a true statement when plugged into the equation.
Example 4
Check that the given number is a solution to the corresponding equation.
a) ![]()
b) ![]()
c) ![]()
Solution
Replace the variable in each equation with the given value.
a) 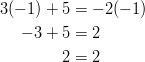
This is a true statement. This means that ![]() is a solution to
is a solution to ![]() .
.
b) 
This is not a true statement. This means that ![]() is not a solution to
is not a solution to ![]() .
.
c) 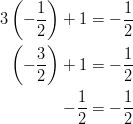
This is a true statement. This means that ![]() is a solution to
is a solution to ![]() .
.
To check the solution to an inequality, we replace the variable in the inequality with the value of the solution. A solution to an inequality produces a true statement when substituted into the inequality.
Example 5
Check that the given number is a solution to the corresponding inequality.
a) ![]()
b) ![]()
c) ![]()
Solution
Replace the variable in each inequality with the given value.
a) ![]()
This statement is true. This means that ![]() is a solution to the inequality
is a solution to the inequality ![]() .
.
Note that ![]() is not the only solution to this inequality. If we divide both sides of the inequality by 20, we can write it as
is not the only solution to this inequality. If we divide both sides of the inequality by 20, we can write it as ![]() . This means that any number less than or equal to 12.5 is also a solution to the inequality.
. This means that any number less than or equal to 12.5 is also a solution to the inequality.
b) 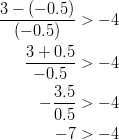
This statement is false. This means that ![]() is not a solution to the inequality
is not a solution to the inequality ![]() .
.
c) 
This statement is true. It is true because this inequality includes an equals sign; since 8 is equal to itself, it is also “greater than or equal to” itself. This means that ![]() is a solution to the inequality
is a solution to the inequality ![]() .
.
Let’s use what we have learned about defining variables, writing equations and writing inequalities to solve some real-world problems.
Example 6
Tomatoes cost $0.50 each and avocados cost $2.00 each. Anne buys six more tomatoes than avocados. Her total bill is $8. How many tomatoes and how many avocados did Anne buy?
Solution
Define
Let ![]() the number of avocados Anne buys.
the number of avocados Anne buys.
Translate
Anne buys six more tomatoes than avocados. This means that ![]() the number of tomatoes.
the number of tomatoes.
Tomatoes cost $0.50 each and avocados cost $2.00 each. Her total bill is $8. This means that .50 times the number of tomatoes plus 2 times the number of avocados equals 8.
Remember that ![]() the number of avocados, so Anne buys two avocados. The number of tomatoes is
the number of avocados, so Anne buys two avocados. The number of tomatoes is ![]() .
.
Answer
Anne bought 2 avocados and 8 tomatoes.
Check
If Anne bought two avocados and eight tomatoes, the total cost is: ![]() . The answer checks out.
. The answer checks out.
Example 7
To organize a picnic Peter needs at least two times as many hamburgers as hot dogs. He has 24 hot dogs. What is the possible number of hamburgers Peter has?
Solution
Define
Let ![]() number of hamburgers
number of hamburgers
Translate
Peter needs at least two times as many hamburgers as hot dogs. He has 24 hot dogs.
This means that twice the number of hot dogs is less than or equal to the number of hamburgers.
![]()
Answer
Peter needs at least 48 hamburgers.
Check
48 hamburgers is twice the number of hot dogs. So more than 48 hamburgers is more than twice the number of hot dogs. The answer checks out.
For more practice solving inequalities, check out http://www.aaastudy.com/equ725x7.htm.
A function is a rule for relating two or more variables. For example, the price you pay for phone service may depend on the number of minutes you talk on the phone. We would say that the cost of phone service is a function of the number of minutes you talk. Consider the following situation.
Josh goes to an amusement park where he pays $2 per ride.
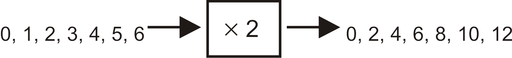
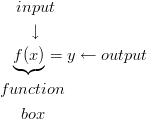
There is a relationship between the number of rides Josh goes on and the total amount he spends that day: To figure out the amount he spends, we multiply the number of rides by two. This rule is an example of a function. Functions usually—but not always—are rules based on mathematical operations. You can think of a function as a box or a machine that contains a mathematical operation.
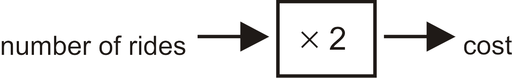
Whatever number we feed into the function box is changed by the given operation, and a new number comes out the other side of the box. When we input different values for the number of rides Josh goes on, we get different values for the amount of money he spends.
The input is called the independent variable because its value can be any number. The output is called the dependent variable because its value depends on the input value.
Functions usually contain more than one mathematical operation. Here is a situation that is slightly more complicated than the example above.
Jason goes to an amusement park where he pays $8 admission and $2 per ride.
The following function represents the total amount Jason pays. The rule for this function is "multiply the number of rides by 2 and add 8."
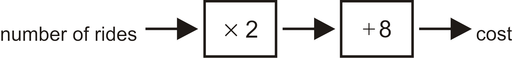
When we input different values for the number of rides, we arrive at different outputs (costs).

These flow diagrams are useful in visualizing what a function is. However, they are cumbersome to use in practice. In algebra, we use the following short-hand notation instead:
First, we define the variables:
![]() the number of rides Jason goes on
the number of rides Jason goes on
![]() the total amount of money Jason spends at the amusement park.
the total amount of money Jason spends at the amusement park.
So, ![]() represents the input and
represents the input and ![]() represents the output. The notation
represents the output. The notation ![]() represents the function or the mathematical operations we use on the input to get the output. In the last example, the cost is 2 times the number of rides plus 8. This can be written as a function:
represents the function or the mathematical operations we use on the input to get the output. In the last example, the cost is 2 times the number of rides plus 8. This can be written as a function:
![]()
In algebra, the notations ![]() and
and ![]() are typically used interchangeably. Technically, though,
are typically used interchangeably. Technically, though, ![]() represents the function itself and
represents the function itself and ![]() represents the output of the function.
represents the output of the function.
In the last example, we saw that we can input the number of rides into the function to give us the total cost for going to the amusement park. The set of all values that we can use for the input is called the domain of the function, and the set of all values that the output could turn out to be is called the range of the function. In many situations the domain and range of a function are both simply the set of all real numbers, but this isn’t always the case. Let's look at our amusement park example.
Example 1
Find the domain and range of the function that describes the situation:
Jason goes to an amusement park where he pays $8 admission and $2 per ride.
Solution
Here is the function that describes this situation:
![]()
In this function, ![]() is the number of rides and
is the number of rides and ![]() is the total cost. To find the domain of the function, we need to determine which numbers make sense to use as the input
is the total cost. To find the domain of the function, we need to determine which numbers make sense to use as the input ![]() .
.
Answer For this function, the domain is the set of all non-negative integers.
To find the range of the function we must determine what the values of ![]() will be when we apply the function to the input values. The domain is the set of all non-negative integers: {0, 1, 2, 3, 4, 5, 6, ...}. Next we plug these values into the function for
will be when we apply the function to the input values. The domain is the set of all non-negative integers: {0, 1, 2, 3, 4, 5, 6, ...}. Next we plug these values into the function for ![]() . If we plug in 0, we get 8; if we plug in 1, we get 10; if we plug in 2, we get 12, and so on, counting by 2s each time. Possible values of
. If we plug in 0, we get 8; if we plug in 1, we get 10; if we plug in 2, we get 12, and so on, counting by 2s each time. Possible values of ![]() are therefore 8, 10, 12, 14, 16, 18, 20... or in other words all even integers greater than or equal to 8.
are therefore 8, 10, 12, 14, 16, 18, 20... or in other words all even integers greater than or equal to 8.
Answer The range of this function is the set of all even integers greater than or equal to 8.
Example 2
Find the domain and range of the following functions.
a) A ball is dropped from a height and it bounces up to 75% of its original height.
b) ![]()
Solution
a) Let’s define the variables:
![]() original height
original height
![]() bounce height
bounce height
A function that describes the situation is ![]() .
. ![]() can represent any real value greater than zero, since you can drop a ball from any height greater than zero. A little thought tells us that
can represent any real value greater than zero, since you can drop a ball from any height greater than zero. A little thought tells us that ![]() can also represent any real value greater than zero.
can also represent any real value greater than zero.
Answer
The domain is the set of all real numbers greater than zero. The range is also the set of all real numbers greater than zero.
b) Since there is no word problem attached to this equation, we can assume that we can use any real number as a value of ![]() . When we square a real number, we always get a non-negative answer, so
. When we square a real number, we always get a non-negative answer, so ![]() can be any non-negative real number.
can be any non-negative real number.
Answer
The domain of this function is all real numbers. The range of this function is all non-negative real numbers.
In the functions we’ve looked at so far, ![]() is called the independent variable because it can be any of the values from the domain, and
is called the independent variable because it can be any of the values from the domain, and ![]() is called the dependent variable because its value depends on
is called the dependent variable because its value depends on ![]() . However, any letters or symbols can be used to represent the dependent and independent variables. Here are three different examples:
. However, any letters or symbols can be used to represent the dependent and independent variables. Here are three different examples:
These expressions all represent the same function: a function where the dependent variable is three times the independent variable. Only the symbols are different. In practice, we usually pick symbols for the dependent and independent variables based on what they represent in the real world—like ![]() for time,
for time, ![]() for distance,
for distance, ![]() for velocity, and so on. But when the variables don’t represent anything in the real world—or even sometimes when they do—we traditionally use
for velocity, and so on. But when the variables don’t represent anything in the real world—or even sometimes when they do—we traditionally use ![]() for the dependent variable and
for the dependent variable and ![]() for the independent variable.
for the independent variable.
For another look at the domain of a function, see the following video, where the narrator solves a sample problem from the California Standards Test about finding the domain of an unusual function: http://www.youtube.com/watch?v=NRB6s77nx2gI.
A table is a very useful way of arranging the data represented by a function. We can match the input and output values and arrange them as a table. For example, the values from Example 1 above can be arranged in a table as follows:
![]()
A table lets us organize our data in a compact manner. It also provides an easy reference for looking up data, and it gives us a set of coordinate points that we can plot to create a graph of the function.
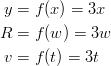
Example 3
Make a table of values for the function ![]() . Use the following numbers for input values: -1, -0.5, -0.2, -0.1, -0.01, 0.01, 0.1, 0.2, 0.5, 1.
. Use the following numbers for input values: -1, -0.5, -0.2, -0.1, -0.01, 0.01, 0.1, 0.2, 0.5, 1.
Solution
Make a table of values by filling the first row with the input values and the next row with the output values calculated using the given function.
When you’re given a function, you won’t usually be told what input values to use; you’ll need to decide for yourself what values to pick based on what kind of function you’re dealing with. We will discuss how to pick input values throughout this book.
In many situations, we collect data by conducting a survey or an experiment, and then organize the data in a table of values. Most often, we want to find the function rule or formula that fits the set of values in the table, so we can use the rule to predict what could happen for values that are not in the table.
Example 4
Write a function rule for the following table:
![]()
Solution
You pay $24 for 2 CDs, $48 for 4 CDs, $120 for 10 CDs. That means that each CD costs $12.
We can write a function rule:
Cost ![]() (number of CDs) or
(number of CDs) or ![]()
Example 5
Write a function rule for the following table:
![]()
Solution
You can see that a negative number turns into the same number, only positive, while a non-negative number stays the same. This means that the function being used here is the absolute value function: ![]() .
.
Coming up with a function based on a set of values really is as tricky as it looks. There’s no rule that will tell you the function every time, so you just have to think of all the types of functions you know and guess which one might be a good fit, and then check if your guess is right. In this book, though, we’ll stick to writing functions for linear relationships, which are the simplest type of function.
Let’s look at a few real-world situations that can be represented by a function.
Example 5
Maya has an internet service that currently has a monthly access fee of $11.95 and a connection fee of $0.50 per hour. Represent her monthly cost as a function of connection time.
Solution
Define
Let ![]() the number of hours Maya spends on the internet in one month
the number of hours Maya spends on the internet in one month
Let ![]() Maya’s monthly cost
Maya’s monthly cost
Translate
The cost has two parts: the one-time fee of $11.95 and the per-hour charge of $0.50. So the total cost is the flat fee ![]() the charge per hour
the charge per hour  the number of hours.
Answer
The function is ![]() .
.
Example 6
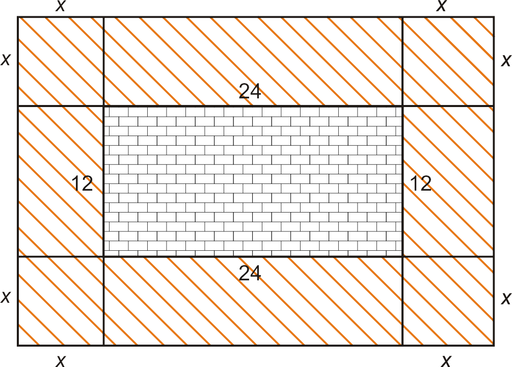
Alfredo wants a deck build around his pool. The dimensions of the pool are ![]() and the decking costs $3 per square foot. Write the cost of the deck as a function of the width of the deck.
and the decking costs $3 per square foot. Write the cost of the deck as a function of the width of the deck.
Solution
Define
Let ![]() width of the deck
width of the deck
Let ![]() cost of the deck
cost of the deck
Make a sketch and label it
Translate
You can look at the decking as being formed by several rectangles and squares. We can find the areas of all the separate pieces and add them together:
![]()
To find the total cost, we then multiply the area by the cost per square foot ($3).
Answer
![]()
Example 7
A cell phone company sells two million phones in their first year of business. The number of phones they sell doubles each year. Write a function that gives the number of phones that are sold per year as a function of how old the company is.
Solution
Define
Let ![]() age of company in years
age of company in years
Let ![]() number of phones that are sold per year
number of phones that are sold per year
Make a table
![]()
Write a function rule
The number of phones sold per year doubles every year, so the first year the company sells 2 million phones, the next year it sells ![]() million, the next year it sells
million, the next year it sells ![]() million, and so on. You might remember that when we multiply a number by itself several times we can use exponential notation:
million, and so on. You might remember that when we multiply a number by itself several times we can use exponential notation: ![]() and so on. In this problem, the exponent just happens to match the company’s age in years, which makes our function easy to describe.
and so on. In this problem, the exponent just happens to match the company’s age in years, which makes our function easy to describe.
Answer
![]()
table:
![]()
table:
![]()
table:
![]()
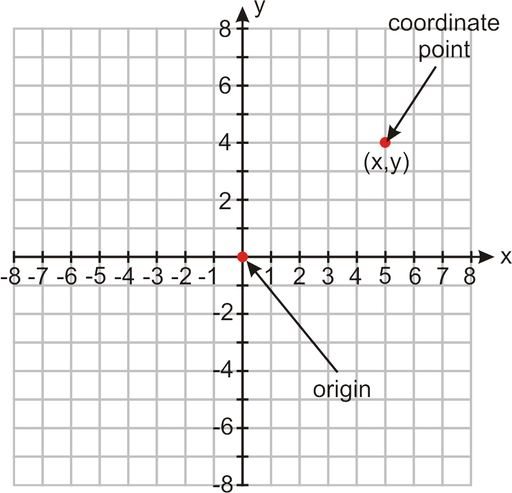
We represent functions graphically by plotting points on a coordinate plane (also sometimes called the Cartesian plane). The coordinate plane is a grid formed by a horizontal number line and a vertical number line that cross at a point called the origin. The origin has this name because it is the “starting” location; every other point on the grid is described in terms of how far it is from the origin.
The horizontal number line is called the ![]() axis and the vertical line is called the
axis and the vertical line is called the ![]() axis. We can represent each value of a function as a point on the plane by representing the
axis. We can represent each value of a function as a point on the plane by representing the ![]() value as a distance along the
value as a distance along the ![]() axis and the
axis and the ![]() value as a distance along the
value as a distance along the ![]() axis. For example, if the
axis. For example, if the ![]() value of a function is 2 when the
value of a function is 2 when the ![]() value is 4, we can represent this pair of values with a point that is 4 units to the right of the origin (that is, 4 units along the
value is 4, we can represent this pair of values with a point that is 4 units to the right of the origin (that is, 4 units along the ![]() axis) and 2 units up (2 units in the
axis) and 2 units up (2 units in the ![]() direction).
direction).
We write the location of this point as (4, 2).
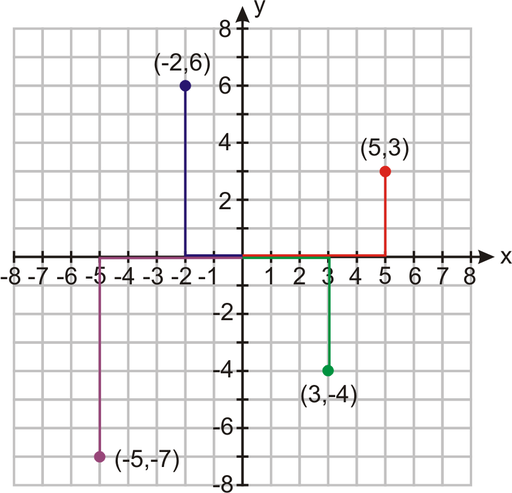
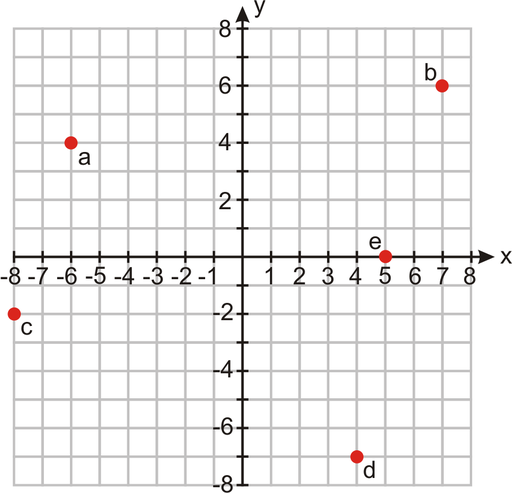
Example 1
Plot the following coordinate points on the Cartesian plane.
a) (5, 3)
b) (-2, 6)
c) (3, -4)
d) (-5, -7)
Solution
Here are all the coordinate points on the same plot.
Notice that we move to the right for a positive ![]() value and to the left for a negative one, just as we would on a single number line. Similarly, we move up for a positive
value and to the left for a negative one, just as we would on a single number line. Similarly, we move up for a positive ![]() value and down for a negative one.
value and down for a negative one.
The ![]() and
and ![]() axes divide the coordinate plane into four quadrants. The quadrants are numbered counter-clockwise starting from the upper right, so the plotted point for (a) is in the first quadrant, (b) is in the second quadrant, (c) is in the fourth quadrant, and (d) is in the third quadrant.
axes divide the coordinate plane into four quadrants. The quadrants are numbered counter-clockwise starting from the upper right, so the plotted point for (a) is in the first quadrant, (b) is in the second quadrant, (c) is in the fourth quadrant, and (d) is in the third quadrant.
If we know a rule or have a table of values that describes a function, we can draw a graph of the function. A table of values gives us coordinate points that we can plot on the Cartesian plane.
Example 2
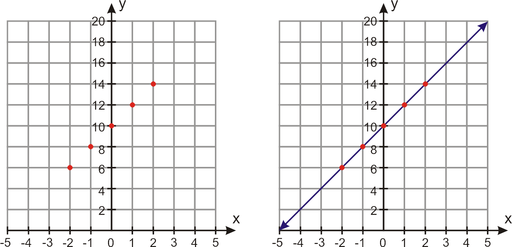
Graph the function that has the following table of values.
![]()
Solution
The table gives us five sets of coordinate points: (-2, 6), (-1, 8), (0, 10), (1, 12), and (2, 14).
To graph the function, we plot all the coordinate points. Since we are not told the domain of the function or given a real-world context, we can just assume that the domain is the set of all real numbers. To show that the function holds for all values in the domain, we connect the points with a smooth line (which, we understand, continues infinitely in both directions).
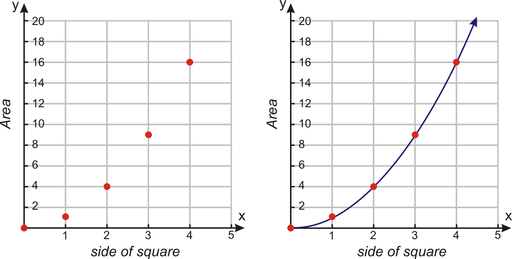
Example 3
Graph the function that has the following table of values.
![]()
The table gives us five sets of coordinate points: (0, 0), (1, 1), (2, 4), (3, 9), and (4, 16).
To graph the function, we plot all the coordinate points. Since we are not told the domain of the function, we can assume that the domain is the set of all non-negative real numbers. To show that the function holds for all values in the domain, we connect the points with a smooth curve. The curve does not make sense for negative values of the independent variable, so it stops at ![]() , but it continues infinitely in the positive direction.
, but it continues infinitely in the positive direction.
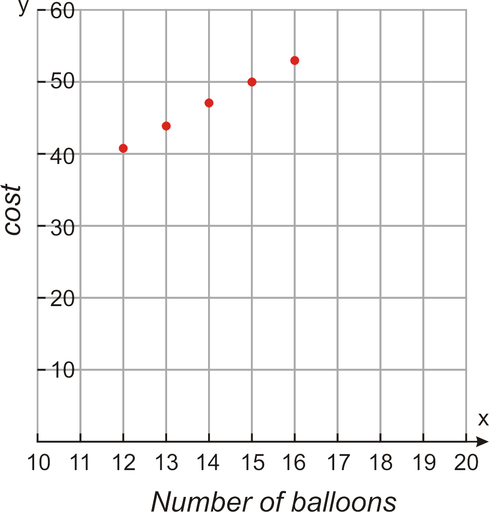
Example 4
Graph the function that has the following table of values.
![]()
This function represents the total cost of the balloons delivered to your house. Each balloon is $3 and the store delivers if you buy a dozen balloons or more. The delivery charge is a $5 flat fee.
Solution
The table gives us five sets of coordinate points: (12, 41), (13, 44), (14, 47), (15, 50), and (16, 53).
To graph the function, we plot all the coordinate points. Since the ![]() values represent the number of balloons for 12 balloons or more, the domain of this function is all integers greater than or equal to 12. In this problem, the points are not connected by a line or curve because it doesn’tmake sense to have non-integer values of balloons.
values represent the number of balloons for 12 balloons or more, the domain of this function is all integers greater than or equal to 12. In this problem, the points are not connected by a line or curve because it doesn’tmake sense to have non-integer values of balloons.
In order to draw a graph of a function given the function rule, we must first make a table of values to give us a set of points to plot. Choosing good values for the table is a skill you’l develop throughout this course. When you pick values, here are some of the things you should keep in mind.
Example 5
Graph the following function: ![]()
Solution
Make a table of values. Pick a variety of negative and positive values for ![]() . Use the function rule to find the value of
. Use the function rule to find the value of ![]() for each value of
for each value of ![]() . Then, graph each of the coordinate points.
. Then, graph each of the coordinate points.
Table 1.8
|
|
|
| -4 |
|
| -3 |
|
| -2 |
|
| -1 |
|
| 0 |
|
| 1 |
|
| 2 |
|
| 3 |
|
| 4 |
|
| 5 |
|
| 6 |
|
| 7 |
|
| 8 |
|

It is wise to work with a lot of values when you begin graphing. As you learn about different types of functions, you will start to only need a few points in the table of values to create an accurate graph.
Example 6
Graph the following function: ![]()
Solution
Make a table of values. We know ![]() can’t be negative because we can't take the square root of a negative number. The domain is all positive real numbers, so we pick a variety of positive integer values for
can’t be negative because we can't take the square root of a negative number. The domain is all positive real numbers, so we pick a variety of positive integer values for ![]() . Use the function rule to find the value of
. Use the function rule to find the value of ![]() for each value of
for each value of ![]() .
.
Table 1.9
|
|
|
| 0 |
|
| 1 |
|
| 2 |
|
| 3 |
|
| 4 |
|
| 5 |
|
| 6 |
|
| 7 |
|
| 8 |
|
| 9 |
|
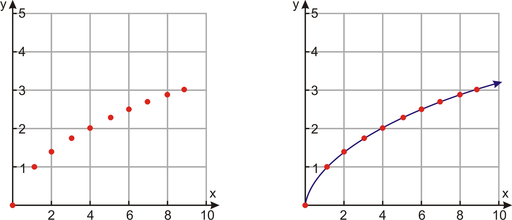
Note that the range is all positive real numbers.
Example 7
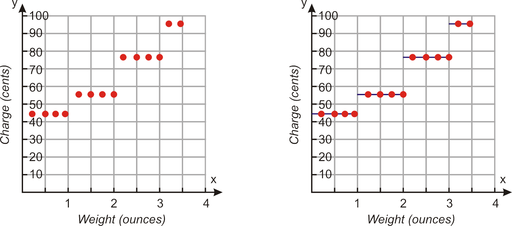
The post office charges 41 cents to send a letter that is one ounce or less and an extra 17 cents for each additional ounce or fraction of an ounce. This rate applies to letters up to 3.5 ounces.
Solution
Make a table of values. We can’t use negative numbers for ![]() because it doesn’t make sense to have negative weight. We pick a variety of positive values for
because it doesn’t make sense to have negative weight. We pick a variety of positive values for ![]() , making sure to include some decimal values because prices can be decimals too. Then we use the function rule to find the value of
, making sure to include some decimal values because prices can be decimals too. Then we use the function rule to find the value of ![]() for each value of
for each value of ![]() .
.
![]()
Sometimes you’ll need to find the equation or rule of a function by looking at the graph of the function. Points that are on the graph can give you values of dependent and independent variables that are related to each other by the function rule. However, you must make sure that the rule works for all the points on the curve. In this course you will learn to recognize different kinds of functions and discover the rules for all of them. For now we’ll look at some simple examples and find patterns that will help us figure out how the dependent and independent variables are related.
Example 8
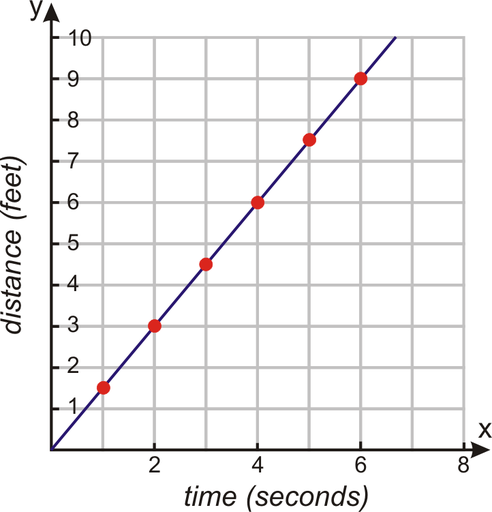
The graph to the right shows the distance that an ant covers over time. Find the function rule that shows how distance and time are related to each other.
Solution
Let’s make a table of values of several coordinate points to see if we can spot how they are related to each other.
![]()
We can see that for every second the distance increases by 1.5 feet. We can write the function rule as
![]()
The equation of the function is ![]() .
.
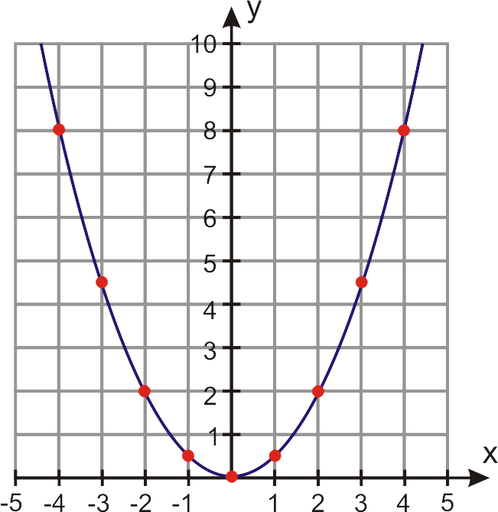
Example 9
Find the function rule that describes the function shown in the graph.
Solution
Again, we can make a table of values of several coordinate points to identify how they are related to each other.
![]()
Notice that the values of ![]() are half of perfect squares: 8 is half of 16 (which is 4 squared), 4.5 is half of 9 (which is 3 squared), and so on. So the equation of the function is
are half of perfect squares: 8 is half of 16 (which is 4 squared), 4.5 is half of 9 (which is 3 squared), and so on. So the equation of the function is ![]() .
.
Example 10
Find the function rule that shows the volume of a balloon at different times, based on the following graph:
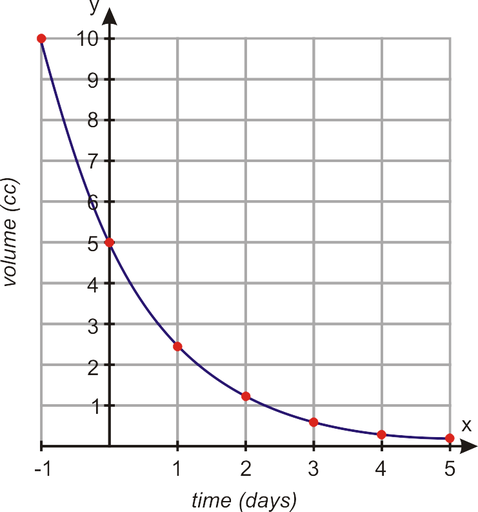
(Notice that the graph shows negative time. The negative time can represent what happened on days before you started measuring the volume.)
Solution
Once again, we make a table to spot the pattern:
![]()
We can see that every day, the volume of the balloon is half what it was the previous day. On day 0, the volume is 5; on day 1, the volume is ![]() ; on day 2, it is
; on day 2, it is ![]() , and in general, on day
, and in general, on day ![]() it is
it is ![]() . The equation of the function is
. The equation of the function is ![]() .
.
A function is a special kind of relation. In a function, for each input there is exactly one output; in a relation, there can be more than one output for a given input.
Consider the relation that shows the heights of all students in a class. The domain is the set of people in the class and the range is the set of heights. This relation is a function because each person has exactly one height. If any person had more than one height, the relation would not be a function.
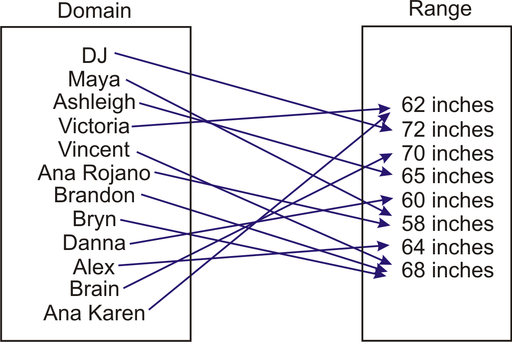
Notice that even though the same person can’t have more than one height, it’s okay for more than one person to have the same height. In a function, more than one input can have the same output, as long as more than one output never comes from the same input.
Example 11
Determine if the relation is a function.
a) (1, 3), (-1, -2), (3, 5), (2, 5), (3, 4)
b) (-3, 20), (-5, 25), (-1, 5), (7, 12), (9, 2)
c) ![]()
Solution
The easiest way to figure out if a relation is a function is to look at all the ![]() values in the list or the table. If a value of
values in the list or the table. If a value of ![]() appears more than once, and it’s paired up with different
appears more than once, and it’s paired up with different ![]() values, then the relation is not a function.
values, then the relation is not a function.
a) You can see that in this relation there are two different ![]() values paired with the
values paired with the ![]() value of 3. This means that this relation is not a function.
value of 3. This means that this relation is not a function.
b) Each value of ![]() has exactly one
has exactly one ![]() value. The relation is a function.
value. The relation is a function.
c) In this relation there are two different ![]() values paired with the
values paired with the ![]() value of 2 and two
value of 2 and two ![]() values paired with the
values paired with the ![]() value of 1. The relation is not a function.
value of 1. The relation is not a function.
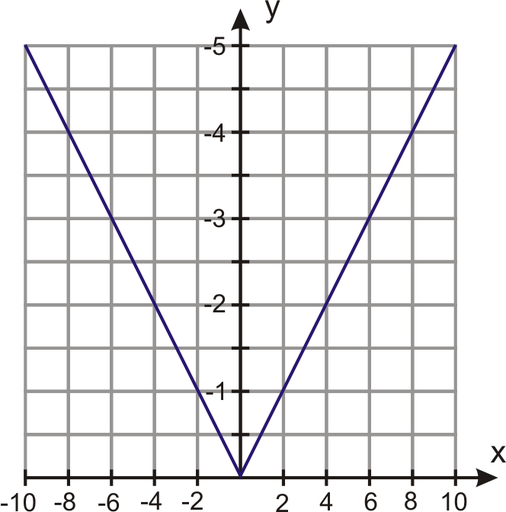
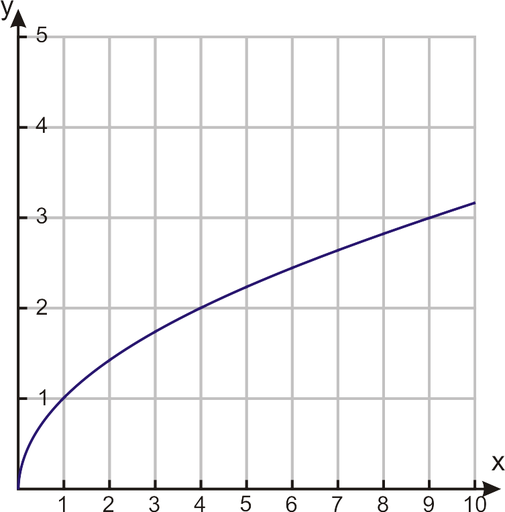
When a relation is represented graphically, we can determine if it is a function by using the vertical line test. If you can draw a vertical line that crosses the graph in more than one place, then the relation is not a function. Here are some examples.
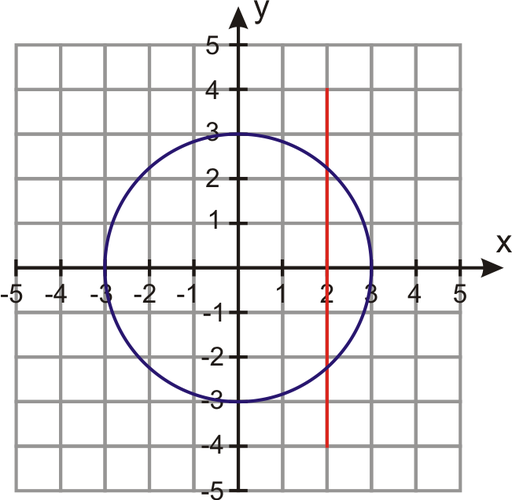
Not a function. It fails the vertical line test.
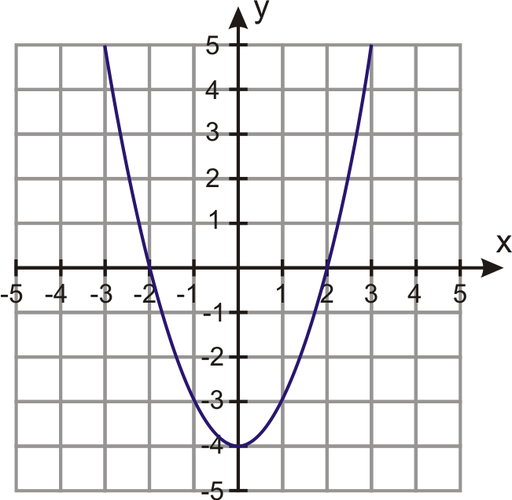
A function. No vertical line will cross more than one point on the graph.
A function. No vertical line will cross more than one point on the graph.
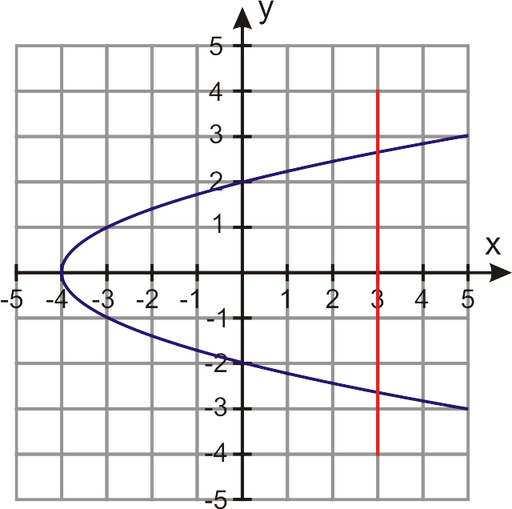
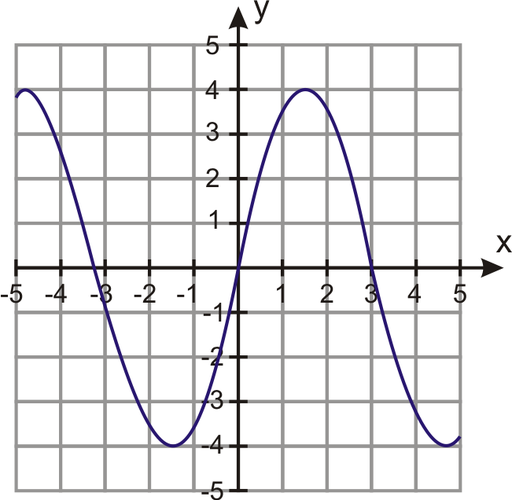
Not a function. It fails the vertical line test.
Once you’ve had some practice graphing functions by hand, you may want to use a graphing calculator to make graphing easier. If you don’t have one, you can also use the applet at http://rechneronline.de/function-graphs/. Just type a function in the blank and press Enter. You can use the options under Display Properties to zoom in or pan around to different parts of the graph.
plane.
values.
(a) ![]()
(b) ![]()
(c) ![]()
function:
(a) (1, 7), (2, 7), (3, 8), (4, 8), (5, 9)
(b) (1, 1), (1, -1), (4, 2), (4, -2), (9, 3), (9, -3)
(c) ![]()
(d) ![]()
graph.
We always think of mathematics as the subject in school where we solve lots of problems. Problem solving is necessary in all aspects of life. Buying a house, renting a car, or figuring out which is the better sale are just a few examples of situations where people use problem-solving techniques. In this book, you will learn different strategies and approaches to solving problems. In this section, we will introduce a problem-solving plan that will be useful throughout this book.
The first step to solving a word problem is to read and understand the problem. Here are a few questions that you should be asking yourself:
This is also a good time to define any variables. When you identify your knowns and unknowns, it is often useful to assign them a letter to make notation and calculations easier.
The next step in the problem-solving plan is to develop a strategy. How can the information you know assist you in figuring out the unknowns?
Here are some common strategies that you will learn:
In most problems, you will use a combination of strategies. For example, looking for patterns is a good strategy for most problems, and making a table and drawing a graph are often used together. The “writing an equation” strategy is the one you will work with the most in your study of algebra.
Once you develop a plan, you can implement it and solve the problem, carrying out all operations to arrive at the answer you are seeking.
The last step in solving any problem should always be to check and interpret the answer. Ask yourself:
Sometimes one specific method is best for solving a problem. Most problems, however, can be solved by using several different strategies. When you are familiar with all of the problem-solving strategies, it is up to you to choose the methods that you are most comfortable with and that make sense to you. In this book, we will often use more than one method to solve a problem, so we can demonstrate the strengths and weakness of different strategies for solving different types of problems.
Whichever strategy you are using, you should always implement the problem-solving plan when you are solving word problems. Here is a summary of the problem-solving plan.
Step 1:
Understand the problem
Read the problem carefully. Once the problem is read, list all the components and data that are involved. This is where you will be assigning your variables.
Step 2:
Devise a plan - Translate
Come up with a way to solve the problem. Set up an equation, draw a diagram, make a chart or construct a table as a start to solve your problem solving plan.
Step 3:
Carry out the plan - Solve
This is where you solve the equation you developed in Step 2.
Step 4:
Look - Check and Interpret
Check to see if you used all your information. Then look to see if the answer makes sense.
Let’s now apply this problem solving plan to a problem.
Example 1
A coffee maker is on sale at 50% off the regular ticket price. On the “Sunday Super Sale” the same coffee maker is on sale at an additional 40% off. If the final price is $21, what was the original price of the coffee maker?
Solution
Step 1: Understand
We know: A coffee maker is discounted 50% and then 40%. The final price is $21.
We want: The original price of the coffee maker.
Step 2: Strategy
Let’s look at the given information and try to find the relationship between the information we know and the information we are trying to find.
50% off the original price means that the sale price is half of the original or ![]() original price.
original price.
So, the first sale price ![]() original price
original price
A savings of 40% off the new price means you pay 60% of the new price, or ![]() new price.
new price.
![]() is the price after the second discount.
is the price after the second discount.
We know that after two discounts, the final price is $21.
So ![]() .
.
Step 3: Solve
Since ![]() , we can find the original price by dividing $21 by 0.3.
, we can find the original price by dividing $21 by 0.3.
![]() .
.
The original price of the coffee maker was $70.
Step 4: Check
We found that the original price of the coffee maker is $70.
To check that this is correct, let’s apply the discounts.
50% of ![]() savings. So the price after the first discount is
savings. So the price after the first discount is ![]() or
or ![]() .
.
Then 40% of that is ![]() . So after the second discount, the price is
. So after the second discount, the price is ![]() .
.
The answer checks out.
The problem-solving plan used here is based on the ideas of George P![]() lya, who describes his useful problem-solving strategies in more detail in the book How to Solve It. Some of the techniques in the book can also be found on Wikipedia, in the entry http://en.wikipedia.org/wiki/How_to_Solve_It.
lya, who describes his useful problem-solving strategies in more detail in the book How to Solve It. Some of the techniques in the book can also be found on Wikipedia, in the entry http://en.wikipedia.org/wiki/How_to_Solve_It.
In this section, we will apply the problem-solving plan you learned about in the last section to solve several real-world problems. You will learn how to develop and use the methods make a table and look for a pattern.
The most difficult parts of problem-solving are most often the first two steps in our problem-solving plan. You need to read the problem and make sure you understand what you are being asked. Once you understand the problem, you can devise a strategy to solve it.
Let’s apply the first two steps to the following problem.
Example 1:
Six friends are buying pizza together and they are planning to split the check equally. After the pizza was ordered, one of the friends had to leave suddenly, before the pizza arrived. Everyone left had to pay $1 extra as a result. How much was the total bill?
Solution
Understand
We want to find how much the pizza cost.
We know that five people had to pay an extra $1 each when one of the original six friends had to leave.
Strategy
We can start by making a list of possible amounts for the total bill.
We divide the amount by six and then by five. The total divided by five should equal $1 more than the total divided by six.
Look for any patterns in the numbers that might lead you to the correct answer.
In the rest of this section you will learn how to make a table or look for a pattern to figure out a solution for this type of problem. After you finish reading the rest of the section, you can finish solving this problem for homework.
The method “Make a Table” is helpful when solving problems involving numerical relationships. When data is organized in a table, it is easier to recognize patterns and relationships between numbers. Let’s apply this strategy to the following example.
Example 2
Josie takes up jogging. On the first week she jogs for 10 minutes per day, on the second week she jogs for 12 minutes per day. Each week, she wants to increase her jogging time by 2 minutes per day. If she jogs six days each week, what will be her total jogging time on the sixth week?
Solution
Understand
We know in the first week Josie jogs 10 minutes per day for six days.
We know in the second week Josie jogs 12 minutes per day for six days.
Each week, she increases her jogging time by 2 minutes per day and she jogs 6 days per week.
We want to find her total jogging time in week six.
Strategy
A good strategy is to list the data we have been given in a table and use the information we have been given to find new information.
We are told that Josie jogs 10 minutes per day for six days in the first week and 12 minutes per day for six days in the second week. We can enter this information in a table:
Table 1.10
| Week | Minutes per Day | Minutes per Week |
| 1 | 10 | 60 |
| 2 | 12 | 72 |
You are told that each week Josie increases her jogging time by 2 minutes per day and jogs 6 times per week. We can use this information to continue filling in the table until we get to week six.
Table 1.11
| Week | Minutes per Day | Minutes per Week |
| 1 | 10 | 60 |
| 2 | 12 | 72 |
| 3 | 14 | 84 |
| 4 | 16 | 96 |
| 5 | 18 | 108 |
| 6 | 20 | 120 |
Apply strategy/solve
To get the answer we read the entry for week six.
Answer: In week six Josie jogs a total of 120 minutes.
Check
Josie increases her jogging time by two minutes per day. She jogs six days per week. This means that she increases her jogging time by 12 minutes per week.
Josie starts at 60 minutes per week and she increases by 12 minutes per week for five weeks.
That means the total jogging time is ![]() .
.
The answer checks out.
You can see that making a table helped us organize and clarify the information we were given, and helped guide us in the next steps of the problem. We solved this problem solely by making a table; in many situations, we would combine this strategy with others to get a solution.
Looking for a pattern is another strategy that you can use to solve problems. The goal is to look for items or numbers that are repeated or a series of events that repeat. The following problem can be solved by finding a pattern.
Example 3
You arrange tennis balls in triangular shapes as shown. How many balls will there be in a triangle that has 8 rows?
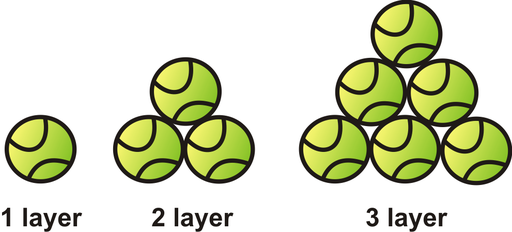
Solution
Understand
We know that we arrange tennis balls in triangles as shown.
We want to know how many balls there are in a triangle that has 8 rows.
Strategy
A good strategy is to make a table and list how many balls are in triangles of different rows.
One row: It is simple to see that a triangle with one row has only one ball.

Two rows: For a triangle with two rows, we add the balls from the top row to the balls from the bottom row. It is useful to make a sketch of the separate rows in the triangle.
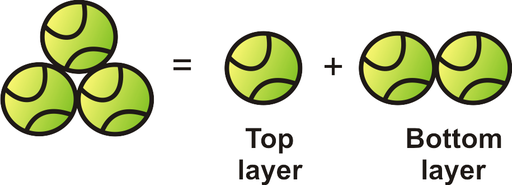
![]()
Three rows: We add the balls from the top triangle to the balls from the bottom row.

![]()
Now we can fill in the first three rows of a table.
Table 1.12
| Number of Rows | Number of Balls |
| 1 | 1 |
| 2 | 3 |
| 3 | 6 |
We can see a pattern.
To create the next triangle, we add a new bottom row to the existing triangle.
The new bottom row has the same number of balls as there are rows. (For example, a triangle with 3 rows has 3 balls in the bottom row.)
To get the total number of balls for the new triangle, we add the number of balls in the old triangle to the number of balls in the new bottom row.
Apply strategy/solve:
We can complete the table by following the pattern we discovered.
Number of balls = number of balls in previous triangle + number of rows in the new triangle
Table 1.13
| Number of Rows | Number of Balls |
| 1 | 1 |
| 2 | 3 |
| 3 | 6 |
| 4 |
|
| 5 |
|
| 6 |
|
| 7 |
|
| 8 |
|
Answer There are 36 balls in a triangle arrangement with 8 rows.
Check
Each row of the triangle has one more ball than the previous one. In a triangle with 8 rows,
row 1 has 1 ball, row 2 has 2 balls, row 3 has 3 balls, row 4 has 4 balls, row 5 has 5 balls, row 6 has 6 balls, row 7 has 7 balls, row 8 has 8 balls.
When we add these we get: ![]()
The answer checks out.
Notice that in this example we made tables and drew diagrams to help us organize our information and find a pattern. Using several methods together is a very common practice and is very useful in solving word problems.
In this section, we will compare the methods of “Making a Table” and “Looking for a Pattern” by using each method in turn to solve a problem.
Example 4
Andrew cashes a $180 check and wants the money in $10 and $20 bills. The bank teller gives him 12 bills. How many of each kind of bill does he receive?
Solution
Method 1: Making a Table
Understand
Andrew gives the bank teller a $180 check.
The bank teller gives Andrew 12 bills. These bills are a mix of $10 bills and $20 bills.
We want to know how many of each kind of bill Andrew receives.
Strategy
Let’s start by making a table of the different ways Andrew can have twelve bills in tens and twenties.
Andrew could have twelve $10 bills and zero $20 bills, or eleven $10 bills and one $20 bill, and so on.
We can calculate the total amount of money for each case.
Apply strategy/solve
Table 1.14
| $10 bills | $ 20 bills | Total amount |
| 12 | 0 |
|
| 11 | 1 |
|
| 10 | 2 |
|
| 9 | 3 |
|
| 8 | 4 |
|
| 7 | 5 |
|
| 6 | 6 |
|
| 5 | 7 |
|
| 4 | 8 |
|
| 3 | 9 |
|
| 2 | 10 |
|
| 1 | 11 |
|
| 0 | 12 |
|
In the table we listed all the possible ways you can get twelve $10 bills and $20 bills and the total amount of money for each possibility. The correct amount is given when Andrew has six $10 bills and six $20 bills.
Answer: Andrew gets six $10 bills and six $20 bills.
Check
Six $10 bills and six $20 bills ![]()
The answer checks out.
Let’s solve the same problem using the method “Look for a Pattern.”
Method 2: Looking for a Pattern
Understand
Andrew gives the bank teller a $180 check.
The bank teller gives Andrew 12 bills. These bills are a mix of $10 bills and $20 bills.
We want to know how many of each kind of bill Andrew receives.
Strategy
Let’s start by making a table just as we did above. However, this time we will look for patterns in the table that can be used to find the solution.
Apply strategy/solve
Let’s fill in the rows of the table until we see a pattern.
Table 1.15
| $10 bills | $20 bills | Total amount |
| 12 | 0 |
|
| 11 | 1 |
|
| 10 | 2 |
|
We see that every time we reduce the number of $10 bills by one and increase the number of $20 bills by one, the total amount increases by $10. The last entry in the table gives a total amount of $140, so we have $40 to go until we reach our goal. This means that we should reduce the number of $10 bills by four and increase the number of $20 bills by four. That would give us six $10 bills and six $20 bills.
![]()
Answer: Andrew gets six $10 bills and six $20 bills.
Check
Six $10 bills and six $20 bills ![]()
The answer checks out.
You can see that the second method we used for solving the problem was less tedious. In the first method, we listed all the possible options and found the answer we were seeking. In the second method, we started by listing the options, but we found a pattern that helped us find the solution faster. The methods of “Making a Table” and “Looking for a Pattern” are both more powerful if used alongside other problem-solving methods.
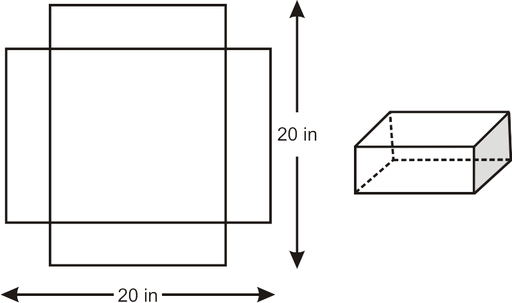
Example 5
Anne is making a box without a lid. She starts with a 20 in. square piece of cardboard and cuts out four equal squares from each corner of the cardboard as shown. She then folds the sides of the box and glues the edges together. How big does she need to cut the corner squares in order to make the box with the biggest volume?
Solution
Step 1:
Understand
Anne makes a box out of a ![]() piece of cardboard.
piece of cardboard.
She cuts out four equal squares from the corners of the cardboard.
She folds the sides and glues them to make a box.
How big should the cut out squares be to make the box with the biggest volume?
Step 2:
Strategy
We need to remember the formula for the volume of a box.
![]()
![]()
Make a table of values by picking different values for the side of the squares that we are cutting out and calculate the volume.
Step 3:
Apply strategy/solve
Let’s “make” a box by cutting out four corner squares with sides equal to 1 inch. The diagram will look like this:
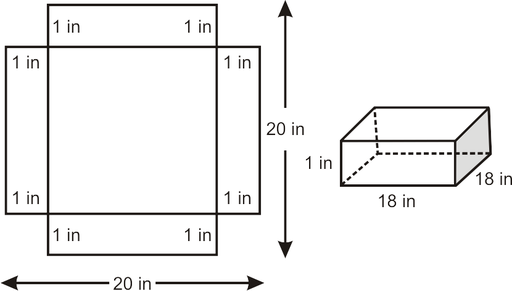
You see that when we fold the sides over to make the box, the height becomes 1 inch, the width becomes 18 inches and the length becomes 18 inches.
![]()
![]()
Let’s make a table that shows the value of the box for different square sizes:
Table 1.16
| Side of Square | Box Height | Box Width | Box Length | Volume |
| 1 | 1 | 18 | 18 |
|
| 2 | 2 | 16 | 16 |
|
| 3 | 3 | 14 | 14 |
|
| 4 | 4 | 12 | 12 |
|
| 5 | 5 | 10 | 10 |
|
| 6 | 6 | 8 | 8 |
|
| 7 | 7 | 6 | 6 |
|
| 8 | 8 | 4 | 4 |
|
| 9 | 9 | 2 | 2 |
|
| 10 | 10 | 0 | 0 |
|
We stop at a square of 10 inches because at this point we have cut out all of the cardboard and we can’t make a box any more. From the table we see that we can make the biggest box if we cut out squares with a side length of three inches. This gives us a volume of ![]() .
.
Answer The box of greatest volume is made if we cut out squares with a side length of three inches.
Step 4:
Check
We see that ![]() is the largest volume appearing in the table. We picked integer values for the sides of the squares that we are cut out. Is it possible to get a larger value for the volume if we pick non-integer values? Since we get the largest volume for the side length equal to three inches, let’s make another table with values close to three inches that is split into smaller increments:
is the largest volume appearing in the table. We picked integer values for the sides of the squares that we are cut out. Is it possible to get a larger value for the volume if we pick non-integer values? Since we get the largest volume for the side length equal to three inches, let’s make another table with values close to three inches that is split into smaller increments:
Table 1.17
| Side of Square | Box Height | Box Width | Box Length | Volume |
| 2.5 | 2.5 | 15 | 15 |
|
| 2.6 | 2.6 | 14.8 | 14.8 |
|
| 2.7 | 2.7 | 14.6 | 14.6 |
|
| 2.8 | 2.8 | 14.4 | 14.4 |
|
| 2.9 | 2.9 | 14.2 | 14.2 |
|
| 3 | 3 | 14 | 14 |
|
| 3.1 | 3.1 | 13.8 | 13.8 |
|
| 3.2 | 3.2 | 13.6 | 13.6 |
|
| 3.3 | 3.3 | 13.4 | 13.4 |
|
| 3.4 | 3.4 | 13.2 | 13.2 |
|
| 3.5 | 3.5 | 13 | 13 |
|
Notice that the largest volume is not when the side of the square is three inches, but rather when the side of the square is 3.3 inches.
Our original answer was not incorrect, but it was not as accurate as it could be. We can get an even more accurate answer if we take even smaller increments of the side length of the square. To do that, we would choose smaller measurements that are in the neighborhood of 3.3 inches.
Meanwhile, our first answer checks out if we want it rounded to zero decimal places, but a more accurate answer is 3.3 inches.
![]()
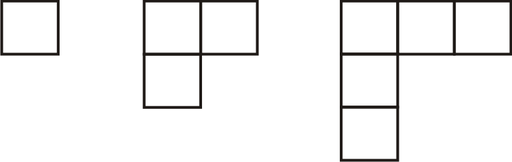
In the CK-12 Texas Instruments Algebra I FlexBook, there are graphing calculator activities designed to supplement the objectives for some of the lessons in this chapter. See http://www.ck12.org/flexr/chapter/9611.