SSRS 2016, and later versions as well as the Power BI Report Server, supports integration with the Power BI service. Once integration has been configured between the on-premises report server and the Power BI tenant, certain SSRS report items, such as charts and maps, can be pinned to Power BI dashboards. Additionally, a reporting services subscription is automatically created for pinned report items, allowing for report server administrators to manage the data refresh schedule of the dashboard tile.
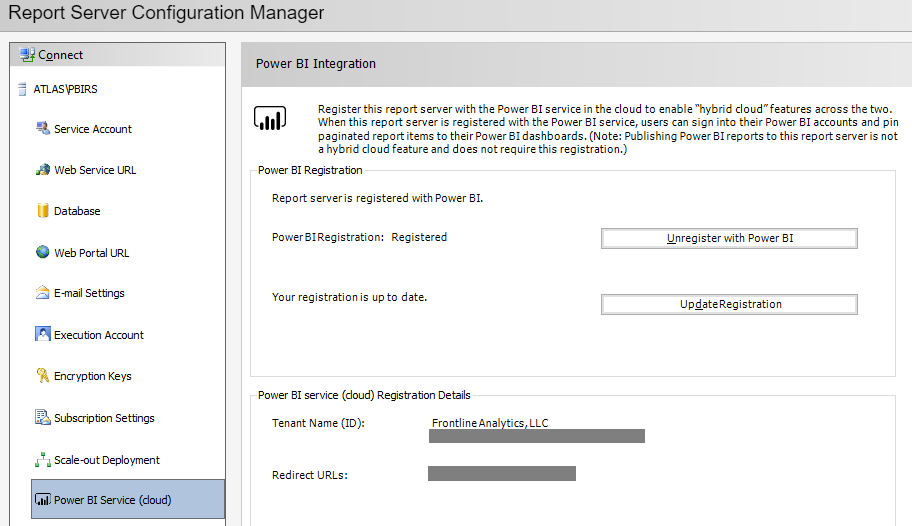
In the following image of the Report Server Configuration Manager, a Power BI Report Server has been configured:

In the preceding image, the Power BI Report Server (PBIRS) instance installed on the ATLAS server has been configured for integration with the Power BI service. The same Power BI integration is available for SQL Server Reporting Services 2016 and 2017 via the same interface in the Report Server Configuration Manager. The following documentation includes all the requirements for integration with the Power BI service as well as technical details on the integration and pinning process http://bit.ly/2CnCkOU.
In the following image from the Power BI Report Server web portal, a paginated (RDL) report containing a map has been opened:

Selecting the Pin to Power BI Dashboard icon in the top-right window prompts the user to select the specific report item to pin. In this report, the map is selected and this launches the following dialog for identifying the dashboard in the Power BI service as well as defining the refresh schedule of the tile:

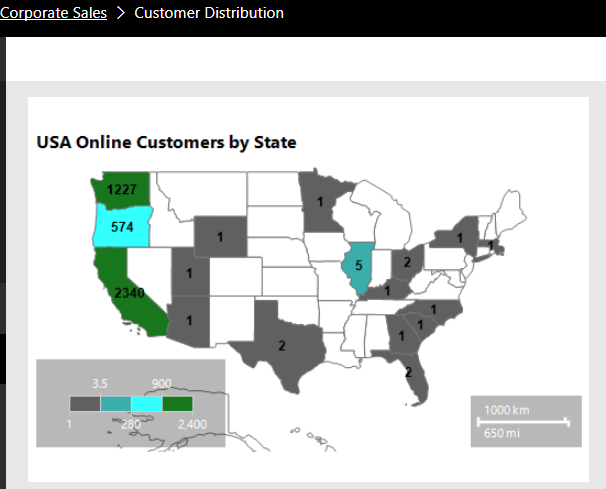
In this example, the map is pinned to the Customer Distribution dashboard in the Corporate Sales app workspace. The Daily, Hourly, and Weekly tile refreshes can be configured via the Frequency of updates drop-down menu and this setting defines the report subscription supporting the tile. Report subscriptions can be managed via the My Subscriptions (Settings | My Subscriptions) interface on the Reporting Services web portal.
Unlike visuals from Power BI reports, which can only be pinned to dashboards in the workspace of the given report, SSRS report items can be pinned to any dashboard in any workspace. In the following image from the Power BI service, the dashboard tile reflecting the pinned SSRS report item has been moved and sized to the top-left corner of the canvas:

By default, the SSRS-based dashboard tile is linked back to the on-premises SSRS report. This link, as well as the title and subtitle for the tile, can be modified via the Tile details window like other dashboard tiles.
Paginated SSRS reports (RDL files) created with SQL Server Data Tools (SSDT) for Visual Studio or SQL Server Report Builder cannot currently be published to the Power BI service. However, just as Power BI reports (PBIX files) can now be published to the Power BI Report Server, the Power BI and Reporting Services teams have advised that support for RDL files in the Power BI service is planned. Once this is accomplished, the three primary Microsoft report types (Power BI, Excel, and SSRS) will all be available in both the Power BI cloud service as well as on-premises via the Power BI Report Server.