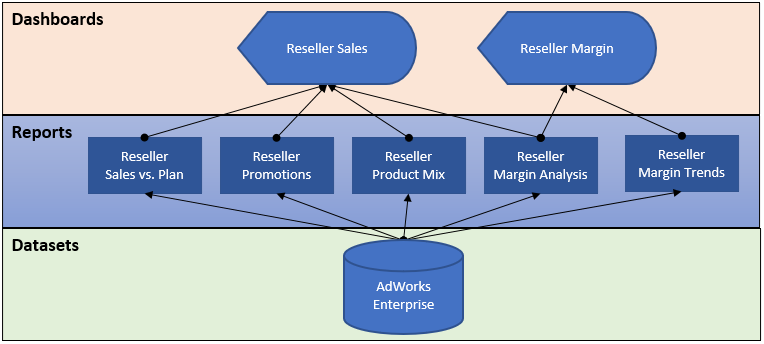
In the following diagram, a Reseller Margin dashboard and a Reseller Margin Trends report have been added to the solution described in the previous section:

In this design, a visual from the Reseller Margin Analysis report has been pinned to both the Reseller Sales and the Reseller Margin dashboards, per the preceding diagram. This is not required but is recommended for usability such that users can maintain context as they navigate between both dashboards. The new Reseller Margin Trends report, built via a Live connection to the published AdWorks Enterprise dataset, exclusively supports the Reseller Margin dashboard.
This architecture extends the scope of the solution to provide greater visibility to margin metrics and trends not available via the single dashboard. For example, rather than navigating through the multiple pages of the two reseller margin reports (Reseller Margin Analysis, Reseller Margin Trends), users could access the Reseller Margin dashboard for a more simplified dashboard experience. In addition to user convenience and the limited scope of a single dashboard, utilizing dashboards and their cached data helps to reduce the workload on the underlying dataset and resources.