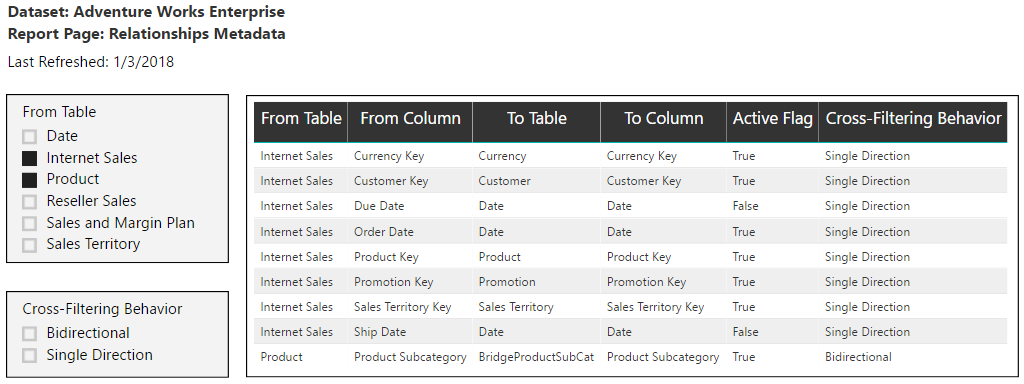
With the enhanced DMV data loaded, report pages can be created, visualizing the most important columns. In the following screenshot, the table and column names retrieved via the M query joins in the previous section, Integrating and enhancing the DMV data, are included in a simple table visual:

In the slicer visual on the left, the table is filtered to only display relationships in which the Internet Sales and Product tables are on the From Table side of the relationship. In other words, only the relationships in which the Internet Sales and Product tables are on the many side of a one-to-many relationship are displayed. The Active Flag column identifies the two inactive date relationships based on Due Date and Ship Date. Additionally, the cross-filtering behavior column and slicer makes it easy to identify any relationships with bidirectional cross-filtering enabled.