By default, Power BI assigns a default summarization to numeric columns, and this default summarization is usually a sum operation. Columns that have been assigned a default summarization are denoted by Power BI with a Sigma symbol (∑). DateKey, Day Number of Week, Day Number of Month, Day Number of Year, and Week Number of Year have all been assigned a default summarization by Power BI in the following screenshot:

This automatic assignment of default summarizations can cause a lot of confusion to report developers in Power BI. Columns that have a default summarization assigned will be automatically aggregated with their assigned default summarization when added to a report. The columns identified in Figure 23 are generally descriptive attributes that help to explain the data; these columns would rarely be aggregated. Take a look at the following screenshot:

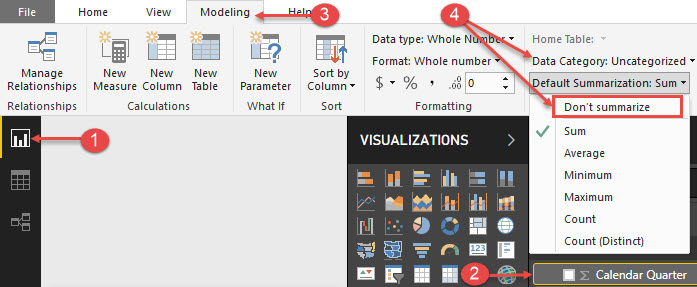
In Figure 24, the Year column from the date table has been added into a table visual, and the expected behavior is to see a distinct list of years (2005, 2006, 2007, 2008, 2009, and 2010). Instead, a value of 4,398,433 is returned. Instead of returning a distinct list, the report returns a sum of all records from the year column in the date table. See the screenshot and steps shown next to adjust the default summarization:

The preceding screenshot walks through changing the default summarization, with detailed steps listed here:
- Select the report view from the left navigation bar.
- Expand the date table and select Calendar Quarter, highlighted by a yellow box.
- Select the modeling ribbon.
- Click the dropdown for Default Summarization, and select Don't summarize.
Repeat the above process for each column in the date table that has been assigned a default summarization by Power BI.