The Power BI Publisher for Excel add-in, available for Excel 2007 and later, allows Power BI Pro users to pin Excel ranges and objects, such as pivot tables and charts, directly from local Excel workbooks to Power BI dashboards in app workspaces. This add-in includes the ability to update pinned items and to connect to published datasets in the Power BI service to create pivot-table Excel reports. Additionally, report content from Excel workbooks published to the Power BI service can also be pinned to dashboards.
Scheduled data refreshes can be configured in the Power BI service for Excel workbooks containing data models. However, given the size limitations of Excel data models as well as the additional capabilities of Power BI reports, such as custom visuals, role security, and advanced analytics, it's generally recommended to migrate Excel data models to Power BI datasets (PBIX files). Per the following image, the Power BI content contained in an Excel workbook can be imported to a Power BI Desktop file:

The migration process includes the data retrieval M queries, data model tables and relationships, DAX measures, and even any Power View report pages contained in the source workbook.
In the following image, the filtered Excel pivot table is pinned to the Customer Distribution dashboard in the Corporate Sales workspace via the Power BI Publisher for Excel:
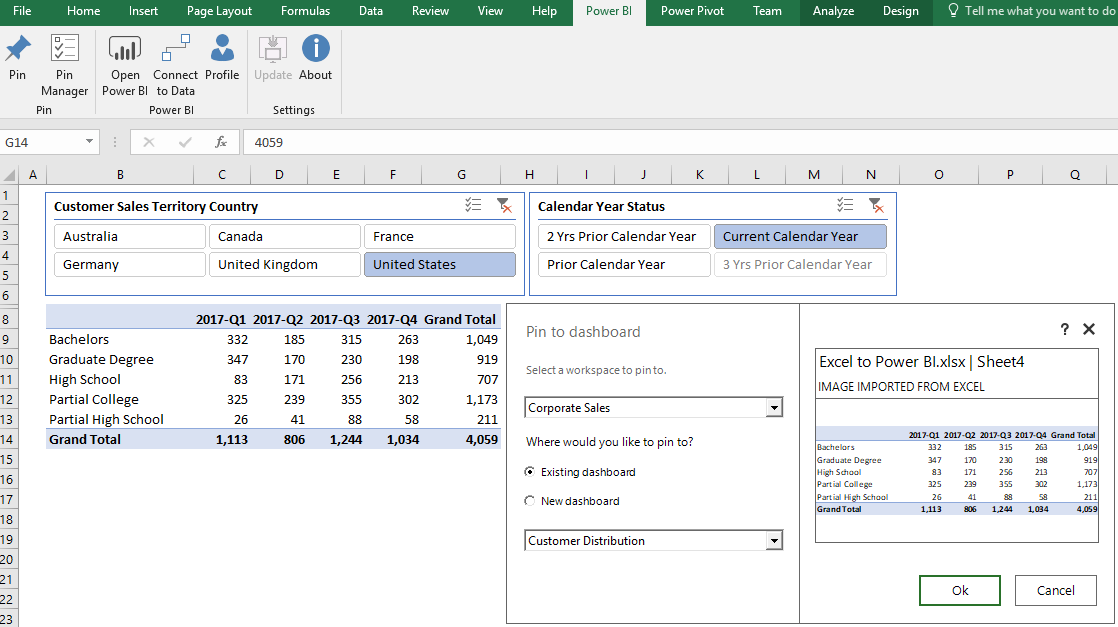
Just like SSRS report items, Excel content can also be pinned to any dashboard in any workspace in the Power BI service. However, when pinning from a local workbook, such as this example, the owner of the Excel workbook is responsible for updating the dashboard tile with any data refreshes or changes in filter conditions. The push updates from the user's workbook to the dashboard in the Power BI service can be executed via the Pin Manager dialog. This interface, which also provides visibility to pinned Excel items in any workspace, is accessed via the Power BI ribbon of the Power BI Publisher for Excel add-in, per the preceding image.
In the following image of the Customer Distribution dashboard, a custom title and subtitle have been applied to the tile containing the pinned Excel pivot table:

Also like SSRS-based dashboard tiles, the details of dashboard tiles containing Excel content can be configured, including title, subtitle, and a custom link. Moreover, Excel and SSRS dashboard tiles can also be included in dashboard layouts dedicated to consumption via smartphones. The Mobile-optimized dashboards section later in this chapter describes this feature.
Although Excel and SSRS report content are not designed to be as visually engaging as Power BI visuals, the ability to leverage these common reporting tools and to consolidate their distinct content on the same dashboard is a unique capability of Power BI. Additionally, the data refresh of Excel workbooks containing external connections to sources, such as Power BI datasets and Analysis Services data models, is a highly requested feature that may be delivered by the fall of 2018.
Per the following image, only workbooks containing data models can currently be refreshed:

Given this current limitation, the two slicers above the pivot table (Country, Calendar Year Status) from the earlier example cannot be used in the Power BI service. This is because the Excel report was based on a connection to a published Power BI dataset via Power BI Publisher for Excel.