Measuring attention
social media and altmetrics
Abstract
Scholars are communicating in many different spheres today, using social media, mobile technology, and cloud computing. Until now, research has been evaluated using citation metrics such as the impact factor (IF) and h-index. As scholarly communication has shifted now mostly to online, other methods are needed to bring attention to research and measure its impact. Altmetrics, a new field that is creating and using such alternative metrics, takes into account not just citation counts of articles published in peer-reviewed journals. It involves collecting information from different sources and measuring interest in articles, people, journals, datasets, presentations, and other artifacts by monitoring views, downloads, “likes,” and mentions in social networks and the news media. Researchers engaging in social networks now rely on recommendations from their peers about newly published articles. Altmetrics tools allow them to see what others are reading, saving, and commenting on. This chapter presents an overview of the area of altmetrics and discusses how it is affecting the dissemination of scientific information and its evaluation.
Very simple was my explanation, and plausible enough—as most wrong theories are!
H.G. Wells (The Time Machine, 1895)
14.1 Introduction
We have heard of alternative music, alternative medicine, alternative energy, and many other “alternative” things. There are even “alternative mutual funds.” In the academic and publishing world, we now often hear about alternative metrics, or altmetrics. Why are so many people and organizations interested in this new field? Altmetrics monitors attention to scholarly output in the form of mentions on social media sites, scholarly activity in online libraries, and reference managers and comments posted on scientific blogs. Who talked about that paper? How did they engage? How can the impact of their activity be measured?
Traditional methods of evaluating the impact of research were based on citations in peer-reviewed journals. The journal impact factor (IF), the most widely used measure of scientific impact, was developed in a print environment, but other alternative indicators have also been studied by such fields as webometrics and bibliometrics (Baynes, 2012; Corrall et al., 2013).
After scholarly communication shifted mostly to online, there was a need for a new approach to evaluate research. As stated in a document published by the NISO Alternative Assessment Metrics (Altmetrics) Project, “While citations will remain an important component of research assessment, this metric alone does not effectively measure the expanded scope of forms of scholarly communication and newer methods of online reader behavior, network interactions with content, and social media” (NISO, 2014).
Authors like to know who is looking at their works and what other people think about them. Why would you make the effort to publish if you do not care what others think about your work or if they see the impact of it? This interest in other people’s opinions has reached new highs with the development of advanced Internet technologies and the emergence of social media. What people are saying about an article is being viewed as some kind of an indicator of interest. Many journals now display alternative metric information at article level. Criteria such as the number of “likes” and the number of Twitter followers are viewed by some as measures of research impact (Holmberg and Thelwall, 2014; Kraker, 2014; Osterrieder, 2013; Sud and Thelwall, 2014). An article that examined how often Twitter was used to disseminate information about journal articles in the biomedical field concluded that the correlation between tweets and citations was very low (Haustein et al., 2014b).
The open-access movement, widespread use of social media, availability of free content, and new forms of scholarly output such as datasets led to the development of new alternative metrics to analyze research. The tools and the data that can be collected using them are grouped under the collective term “altmetrics.”
14.2 Measuring attention
The term “altmetrics” is an abbreviation of the phrase “alternative metrics” (Galligan and Dyas-Correia, 2013). This new field and its supporters have the ambitious goal of providing an alternative to or an enhancement of traditional citation metrics by measuring scholarly interactions taking place mainly in the social media (Galloway et al., 2013; Hoffmann et al., 2014; Kwok, 2013; Piwowar, 2013; Piwowar and Priem, 2013; Sud and Thelwall, 2014; Taylor, 2012; Viney, 2013; Wang et al., 2013; Wilson, 2013). These interactions may take the form of article views, downloads, and tweets. They could also be collaborative annotations using such tools as social bookmarking and reference managers and comments on blog posts. Altmetrics companies obtain data from many different sources and gather metrics for such digital artifacts as articles, blog posts, book chapters, books, cases, clinical trials, conference papers, datasets, figures, grants, interviews, letters, media, patents, posters, presentations, source code, theses/dissertations, videos, and even web pages.
Plum Analytics (Plum Analytics, 2014a,b), a major player in the field of altmetrics, separates collected data into the following five categories:
• Usage (e.g. downloads, views, book holdings, ILL, and document delivery).
• Captures (favorites, bookmarks, saves, readers, and groups).
• Mentions (citations from blog posts, news stories, Wikipedia articles, comments, and reviews).
• Social media (tweets, + 1’s, likes, shares, and ratings).
• Citations (retrieved from publicly available sources such as PubMed, Scopus, and patent databases).
14.3 Altmetrics companies, applications, and tools
Companies and organizations involved in altmetrics collect data from many sources, including social media outlets (Baynes, 2012; Brown, 2014; Buschman and Michalek, 2013; Cheung, 2013; Haustein et al., 2014a; Konkiel, 2013; Kwok, 2013; NISO, 2014; Piwowar, 2013; Piwowar and Priem, 2013; Sud and Thelwall, 2014; Thelwall et al., 2013; Wang et al., 2013; Wilson, 2013). While most altmetrics companies are using similar metrics, categories, and sources of data to those shown above for Plum Analytics, there are also some differences in the approaches used by these companies. This section provides information about the applications and tools currently used in this field and the major players in it.
14.3.1 Academic Analytics
Academic Analytics provides business intelligence data and solutions for research universities in the United States and the United Kingdom that allow them to compare academic institutions and help them better understand their strengths and in which areas they need to improve.
14.3.2 altmetric.com
altmetric.com is a fee-based service that provides altmetrics tools to publishers, institutions, and researchers (Figure 14.1). Publishers subscribing to this service display Article-Level Metrics (ALMs), which draws more visitors to their sites (Huggett and Taylor, 2014).
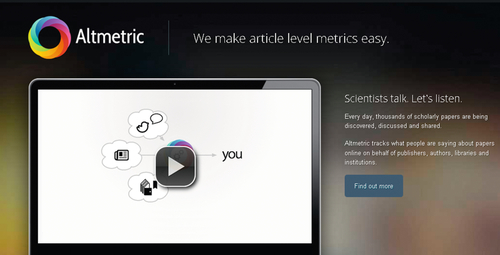
The company gathers data about mentions of academic papers on social media sites (e.g. Twitter, Facebook, Pinterest, and Google +), science blogs, mainstream media outlets such as The New York Times and The Guardian, non-English language publications like Die Zeit and Le Monde, the peer-reviewed site Publons, and information about references saved in collaborative reference managers.
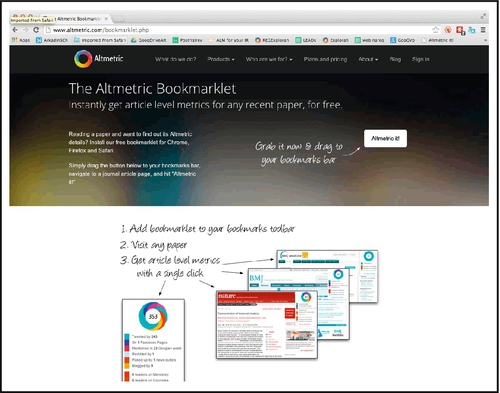
altmetric.com uses rankings for their data analysis. For example, news items have more weight than blogs, and blogs are more highly regarded than tweets. The algorithm also takes into account how authoritative the authors are. Results are presented visually with a donut that shows the proportional distribution of mentions by source type, with each source type displaying a different color—blue (for Twitter), yellow (for blogs), and red (for mainstream media sources). Elsevier displays the altmetric.com donuts for a journal’s three top-rated articles on the Elsevier.com homepages of many Elsevier titles. The donut also provides links to news and social media mentions. A free Bookmarklet that can be installed in Firefox, Chrome, and Safari allows users to see details of the use of a particular article (Figure 14.2).
14.3.3 Article-level Metrics (ALMs)
http://article-level-metrics.plos.org
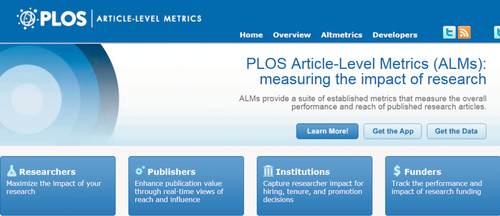
ALMs (Figure 14.3) is a new approach introduced by PLOS to measure the impact of published research at the article level. It looks at an individual article’s impact and separates it from the impact of the journal it was published in. ALMs incorporates altmetrics sources along with traditional measures to present a bigger picture of how individual articles are being discussed and used.
14.3.4 CiteULike
CiteULike is a free collaborative bibliographic management program that allows users to store, organize, share, and discover scholarly references.
14.3.5 Impactstory
Impactstory (Figure 14.4) is an open-source, web-based tool that is focused on researchers. It tracks journal articles, preprints, datasets, presentation slides, research codes, and other research outputs. It is known that Impactstory aggregates data from Mendeley, GitHub, and Twitter, but it does not disclose all its sources. Impactstory was founded by Heather Piwowar and Jason Priem, pioneers in altmetrics and also prolific writers in the area of new publishing models and alternative approaches for evaluating research (Piwowar, 2013; Piwowar and Vision, 2013; Piwowar et al., 2011).

14.3.6 InCites
http://researchanalytics.thomsonreuters.com/incites/
InCites from Thomson Reuters is using bibliographic and citation data from the Web of Science to provide tools and solutions for assessing scholarly output. InCites measures and benchmarks the research performance of individuals, organizations, programs, and peers.
14.3.7 Mendeley
Mendeley is a free collaborative bibliographic management tool owned by Elsevier. When searching Scopus, users can see the demographics, disciplines, and geographic locations of people who have saved a particular article in Mendeley (Habib, 2014). This kind of crowd sourcing might be of interest to many users, but there are some researchers (especially those working in competitive fields) who are reluctant to use a bibliographic management program that monitors their reading habits.
14.3.8 PaperCritic
PaperCritic allows researchers to get feedback about their articles. Tags, summaries, and in-text notes from an individual researcher’s Mendeley library are available to PaperCritic users if they want to rate and review any publication.
14.3.9 Plum Analytics
www.plumanalytics.com/https://plu.mx
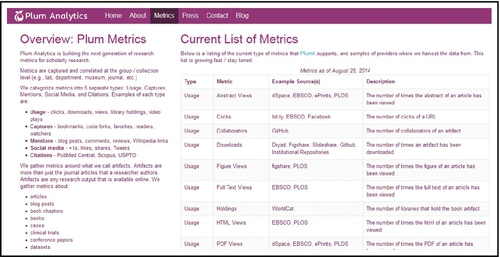
Plum Analytics (Plum Analytics, 2014a) (Figure 14.5) is a major player in the field of altmetrics. Recently acquired by the aggregator EBSCO, it is a commercial service targeting mainly libraries.
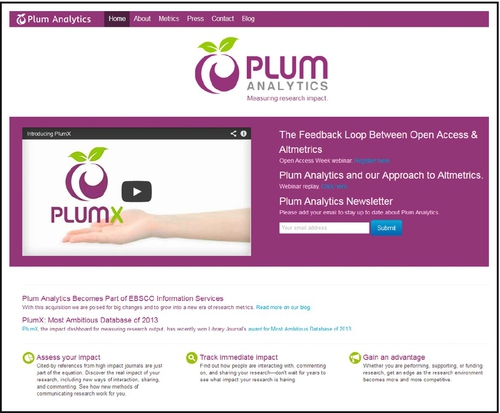
While most of the altmetrics companies do not disclose their sources of data, Plum Analytics makes an exception by publishing the full list of metrics it supports (Figure 14.6).
In June 2013, the Alfred P. Sloan Foundation awarded the National Information Standards Organization (NISO) a grant “to undertake a two-phase initiative to explore, identify, and advance standards and/or best practices related to a new suite of potential metrics in the community” (NISO, 2015). The project has the goal of developing and promoting new assessment metrics, such as usage-based metrics and social media statistics.
14.4 Altmetrics and data provenance
If you have posted a work on some publicly available website, you may get regular updates of how many times your work has been viewed and downloaded. These reports come from different places: the original site where your work has been published, altmetrics companies monitoring such outlets, or academic social websites, such as academia.edu and ResearchGate, where you have posted your works.
I had not been paying much attention to such reports, until I suddenly noticed that a report sent to me by an altmetrics company for a tutorial that I had posted on a social website showed around 1000 counts more than a report for the same work that the original company had sent me the day before. The altmetrics company confirmed that their stats had been correct and matched the counts shown on the public site of the company where the original work was posted.
Why would a company send authors results that were significantly different (much lower) from what the same company is displaying publicly? A FAQs page of the company where my tutorial was posted gave some possible explanation for this discrepancy. It turned out that some new analytics had been used to correct total counts by excluding bot (search engine crawlers) views that had been counted in the total views. These analytics, I was told by the company, had not been applied to the public site, yet. This explains the difference between the results sent to authors (who received the results normalized for bots) and those displayed for the general public and that were collected by the altmetrics companies. There is also no way to know who is viewing or downloading the works—whether these are people who are really interested in the works, or whether the authors themselves are repeatedly viewing and downloading their own works to increase their counts.
14.5 Conclusion
While it takes years for traditional citations to accrue, the number of downloads, views, and mentions in social media is reported in a matter of days, even hours (Wang et al., 2013). Researchers engaging in social networks now rely significantly on recommendations from their peers about newly published articles. They can see what their peers are finding, saving, and bookmarking. There is a general consensus that having an article mentioned in social media could lead to future citations.
With budgets tightening and funding sources becoming more limited, scientific research is becoming very competitive. When applying for grants, researchers need to show that their research will have an impact. They can demonstrate such potential impact for their past work, but not for recently published papers that might be the most relevant to the grant proposal. If researchers could show that their recent work is generating a lot of interest, this could give them an advantage in getting funded.
Academic libraries are now looking at this new field as an opportunity to play a more prominent role in their organizations (Galloway et al., 2013). They organize seminars, invite representatives from altmetrics companies, and engage in different initiatives aimed at evaluating opportunities for adopting alternative metrics and at the same time educating researchers about this new field (Brown, 2014; Corrall et al., 2013; Lapinski et al., 2013; Wilson, 2013). Professional organizations such as the American Chemical Society devote technical sessions and panel discussions to alternative metrics, thus allowing subject librarians and researchers to get acquainted with the field. The altmetrics companies targeting academic institutions require paid subscriptions, and librarians are in a good position to get involved in the selection, introduction, and promotion of such services.
There are significant differences between the disciplines in using social media, which affects whether alternative metrics could be applied for certain fields (Haustein et al., 2014a; Holmberg and Thelwall, 2014; Liu et al., 2013; Zahedi et al., 2014). Scholars in the humanities and the social sciences are very interested in altmetrics. The research output in these disciplines is mainly in the form of books and book chapters, and traditional citation analysis, which has been applied most often to disciplines where journal articles have been the main research product, does not serve them well when they are considered for promotion.
It is difficult to predict how the field of altmetrics will develop in the near future, but one thing is certain—its acceptance will be much slower in disciplines where citations in peer-reviewed journals with high IF are major criteria for researchers’ promotion. Finding a correlation between citations and counts of downloads, bookmarks, and tweets has been attempted in recent years, but there is no definitive conclusion whether such correlation exists (Baynes, 2012; Zahedi et al., 2014).
The provenance of data and interpreting the collected data will be the most important and challenging issues confronting altmetrics companies in the future. Counts mean nothing, unless they can be interpreted. Altmetrics companies need to explain what the value of their services is. Although altmetrics offers an interesting insight into how scholarly output attracts attention, it will complement rather than replace traditional methods such as citations in peer-reviewed journals (Brody, 2013; Brown, 2014; Cheung, 2013).