A map seems the type of a conceptual object, yet the interesting thing is the grotesquely token foot it keeps in the world of the physical . . . being a picture of the degree that that sacrament is a meal. For a feeling of thorough transcendence such unobvious relations between the model and the representation seem essential, and the flimsy connection between acres of soil and their image on the map makes reading one an erudite act.
—Robert Harbison, Eccentric Spaces
“They don’t know how goddamn wrong they can be,” Dave Scott told me over a stiff glass of bourbon as Flagstaff fell into the Earth’s shadow one evening. Scott is, in Lowell’s phrase, a man of more worlds than one. After getting his first degree from Caltech in the late 1930s, he spent the next thirty years in the oil business, mapping out fields all over the world. Sometimes he made his employers money. Sometimes, though, he didn’t; like all oil geologists he’d sometimes persuade the company to buy a lease and drill a hole and have nothing whatsoever to show for it—except an appreciation for how goddamn wrong he had been.
In the 1960s he changed tack. He went back to school, got a graduate degree, and joined the Survey’s Astrogeology branch. In the mid-1970s he found himself in charge of the geological mapping of Mars. He watched as experts from the Survey and beyond used the techniques that Shoemaker had pioneered on the moon to try to make sense of the thirty quadrangles into which Mars had been chopped. And he realized how different his new world was from his old one. On Mars it was possible to get an idea and pursue it unencumbered by any risk of the certainties that follow from drilling a dry hole. The planetary geologists could have ideas as wild as they liked, ideas that flatly contradicted other people’s views of the same issues, and there was no sure way of telling the good from the bad. They didn’t know how goddamn wrong they could be. At times this frustrated Scott, but he could appreciate the liberation involved.
In the late 1970s, Scott and a British-born colleague named Mike Carr took the thirty studies of Martian quadrangles and synthesized them into a geological map of the whole planet. When all the data were in from Viking, Scott, Ron Greeley of Arizona State University, John Guest of University College London, and Kenneth Tanaka, who had joined Scott in Flagstaff, edited and expanded the original geological map into a three-sheet 1:15,000,000 synopsis of the planet that was also available in digital form. This is now the basic document of Martian geology. It’s not definitive, it doesn’t show everything, and in places it’s doubtless wrong. But it’s where people start from.
The 1:15,000,000 geological map, like most geological maps, looks like a madman’s quilt. It recognizes ninety-four different rock units. Some are widespread: One type of ancient cratered terrain is shown covering more than a tenth of the planet’s surface, twice the area of the United States. Other units are no more than a tenth the size of Alabama. Some units crop up in widely separated places: Lunae Planum, just east of Tharsis, is shown as being the same sort of “ridged plain” as Hesperia Planum, halfway around the planet. Each unit has its own distinctive color, arranged in loose families of similar tone or hue. The ancient cratered units of the southern highlands are bronze, brown, and tan; volcanic plains are light violet and dusty pink, crater floors a pus yellow. The lava fields of Tharsis are arranged in tones of pink and heather and magenta, with Alba ringed in a deep steely purple. The volcanoes of Elysium are red as wine, evoking the fires within; the floors of the great channels south of Chryse are a range of blues in honor of the waters that seem to have carved them; the plains they lead to are broad expanses of green and turquoise, colors echoed in a dustier palette to represent the rocks that line the Hellas basin. At the north and the south, the polar layered terrains stand out in a startling azure.
Defining the units was one thing; saying what they represented was quite another. Geologists—especially older geologists—like to say that the best geologist is the one who’s seen the most rocks, and there’s a lot of truth to that. Total number of Martian rocks seen by Martian geologists in the 1970s? None. By 1976 there were television pictures of surface rocks from Viking, and there were interesting data in those images. But for geologists, seeing a rock is much more than looking at a single image of it from a single point of view. It’s walking around it, chipping away at it, examining it with hand lens and microscope, scratching other rocks with it, trying to find other similar samples, understanding how it relates to other rocks around it. They’ll grind them up and taste the grit when they think it might help. Geologists are about the least passive observers you could ever hope to find. Faced with Mars, though, they basically had to make do with images and interpretation.
You might think that sophisticated spacecraft could provide some diagnostic data about the rocks they are looking at, and so they can—up to a point. Spectroscopic analysis of light reflected from the Martian surface can be used to identify the minerals that make up the rocks, and by the mid-1970s it was already becoming clear from the spectrometer on Mariner 9 that the dark regions of Mars appeared to have the same mineralogical make-up as basalt, the dense volcanic rock that makes up most of the crust under the Earth’s oceans. The lighter, redder regions appeared to be similar, but covered in iron-rich dust. In the late 1990s the spectrometer on Mars Global Surveyor confirmed the overall similarity to basalt while also finding evidence that over some parts of the planet the surface minerals are more similar to a subtly different type of volcanic rock, called andesite.
Vast volcanoes, lots of basalt: It would be easy to assume that Mars was just a ball of lava. And maybe much of it is. But spectroscopy only measures minerals and minerals aren’t everything. If you grind down basalt into sand, and that sand then sets into sandstone, the sandstone may well look the same as its igneous parent to a spectrometer in orbit. But to a geologist in the field the two would look very different, and tell very different stories; a sedimentary unit and an igneous one will have completely different histories. Nor are all basalts the same; they can come out of volcanoes as liquid or as ash, they can stay in localized flows or flood whole basins, they can spread through the crust at depth; they can be eroded in different ways and to different degrees.
Deprived of rock samples, the mappers had to rely on the surface texture to distinguish different units. But even then they could not say for sure what they were looking at. A surface that shows signs of having flowed into place may be a lava field. But it may be some sort of solidified mud or a wind-borne sediment. In some places it’s fairly obvious if a rock is sedimentary or igneous. It would seem perverse to insist, for example, that the flanks of Mars’s vast volcanoes are covered in flowing sediments, rather than lavas.* In other places, though—on the floors of basins, for example—one cannot be so sure. As a result Mars’s geological mappers have for the most part been disciplined into not assuming that they know how the rock unit they are describing was formed, or what it is made of. Their descriptions are kept as free as possible of any interpretative input—preferring what Dave Scott calls the “goofy” terms of pure description, such as “mottled terrain”—lest the maps become dated through allegiance to theories about the nature of the Martian surface later overthrown. This neutrality is part of a tradition that dates back to Gilbert and his contemporaries, a way of separating the facts from the multiple working hypotheses by which they might be explained. Such strictures can be frustrating and younger astrogeologists seem to chafe against them a little. The old guard, which has seen theory after theory come and go, tries to rein them in.
At every border on the maps where one slab of color abuts the next, meticulous eyes have detected a change in surface texture: plains dissected by valleys give way to undissected plains, mottled plains to unmottled ones and so on. Sometimes the boundary is obvious, and sometimes the two units just seem to blend into each other and the boundary becomes a matter of subjective judgment. When maps of two adjacent quadrangles by two different mappers were put next to each other in the early days, many of the boundaries would not line up. “I see more discrepancies than we thought when comparing notes in the [bar of the] Little America last night,” one Flagstaff memo from the 1970s laments. Ensuring that such boundaries ended up consistently placed across the various maps was one of Scott’s duties as mapping coordinator.
These boundaries are not minor details; they are the heart of the mapping process. Each boundary is a line separating a before from an after, a hiatus in the creation of new rocks that might last a second or a billion years. The point of geological mapping is to tell a story—to turn landscape into history—and the gaps are the story’s articulation. It is the way that time sits within the boundaries marked in the rock that makes the geological map such a strange and powerful form of drawing—that gives it a plot and a structure. This representation of time as a function of space is almost unique: but not quite. In his brilliant analysis of what makes comic strips work, Understanding Comics, Scott McCloud has this to say about how time is represented between the images in a strip:
In learning to read comics we all learned to perceive time spatially, for in the world of comics, time and space are one and the same. The problem is there’s no conversion chart. The few centimeters that transport us from second to second in one sequence could take us a hundred million years in another. So as readers we’re left with only a vague sense that as our eyes are moving through space they’re also moving through time—we just don’t know by how much.
The insight needs no changes to apply to the reading of geological maps; if we all read such maps as children, they would be as clear to us as the conventions of comic books are.
In most geological situations the boundaries between rock units represent one unit overlying another, just as the frame to the right in a comic strip usually represents events that follow on from those in the frame to the left. In some cases, the relationship was fairly obvious: Where one unit seemed to flow into the other, filling up its depressions, encircling its promontories, then that embaying unit was laid down more recently and overlies buried parts of the earlier unit. Triple boundaries, where three units meet, were much prized, since they reveal the succession definitively and clearly: If one unit overlays the boundary between two others, it must have been laid down later.
These techniques allowed the geologists to define the sequence of events on a local basis, but what of the global history? On the moon, the key to global stratigraphy was ejecta from the large basins, thrown far and wide across the airless surface. If ejecta from the Imbrium basin impact lay over the rock unit you were studying, that unit had to be a pre-Imbrian formation. The moon’s geological eras thus take their names from the impacts that mark their beginnings: Nectarian, Imbrian, and so on. On Mars it was not that simple. Though there were big basins their ejecta blankets were not well preserved. Mars does not have much by way of air or weather today, but it has a lot more than the moon has and in the past it seems to have had still more. This means Martian ejecta, especially from the earliest days, is eroded and moved around. Early attempts by some mappers to make the Hellas impact mark a key event in Martian history, to define an Hellasian or Hellanic period, came to naught.
Another technique derived from moon mapping worked well, though: crater statistics. Rather than trying to establish the order in which specific craters and basins were formed, you could simply count the number of craters of a given size in a given area. The more craters there were, the older that patch of surface must be. This crater-counting technique became the main tool by which Martian history was measured, and the planet’s geological periods ended up named after the plains where craters were counted, rather than after specific craters and basins. When Scott and Carr came to sum up the geological studies to date in their synoptic map of 1978 they chose an application of this technique that divided Martian history into three parts named not for basins but for cratered plains. The oldest period was the Noachian, named for the heavily cratered region called Noachis Terra that lies between Argyre and Hellas; next came the Hesperian age, named for Hesperia Planum, the large volcanic plain east of Hellas; then came the Amazonian, named for the very lightly cratered plain between Elysium and Tharsis in the northern hemisphere from which Olympus Mons rises.
This system of ages added an historical edge to the basic fact of Martian geography: The northern lowlands were Amazonian and Hesperian in age, and thus younger; the southern highlands were mostly Noachian and thus older. This was not a complete surprise to the geologists: On the Earth and the moon, the only other planetary surfaces studied in detail at the time, there are also fundamental dichotomies of age and altitude. The moon is divided into highlands, which are extremely old, and mare deposits, great floods of basalt that have filled in low-lying impact basins. The maria are often much younger than the basins they sit in; they are much less cratered than the highlands. The Earth is divided into young, low-lying ocean basins with basalt floors and continents made of a granitelike crust that is thicker, lighter, and older (this distinction was what led Gilbert to believe that the Earth had been created from planetesimals of a different density). The idea of a planet with two fundamentally different types of crust was not a novelty.
But that didn’t mean it was easily explicable. The processes that had divided the Earth and moon in two were quite different from each other. Which was the better analogy to the split personality of Mars—if either? Over three decades the geologists who study Mars have assembled a variety of working hypotheses to answer this question. And they still don’t know how goddamn wrong they may be.
Given that Mars was clearly a battered planet, the idea that the northern lowlands had been created by impacts had an obvious appeal from more or less the moment of their discovery. In the period that followed the formation of the planets four and a half billion years ago there was a great deal of junk left over in the solar system, and the new planets suffered the consequences. The face of the moon dates largely from this time and bears the scars in the form of about forty basins, some of them filled by the flood basalts that make maria.
At some scales most of Mars seemed almost as cratered as the moon, but at the largest scales it didn’t. The Mariner 9 team saw just three obvious large basins: monstrous Hellas and the more reasonably sized Argyre and Isidis. However, telltale signs such as rough circles of uplifted fragments of old crust, concentric patterns of faulting, and radial grooves suggested to the geological mappers that there might be more. For some Martian geologists the discovery of basins became a sort of cottage industry.
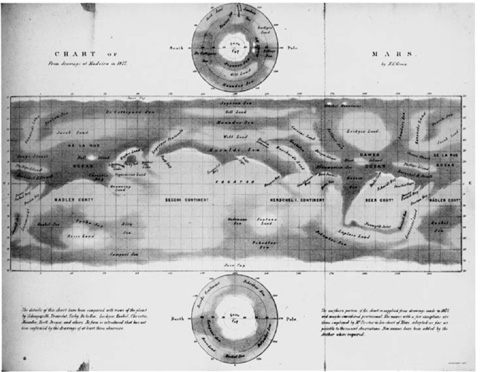
Fig 1: Painted map by Nathaniel Green, from observations in Madeira (1877).
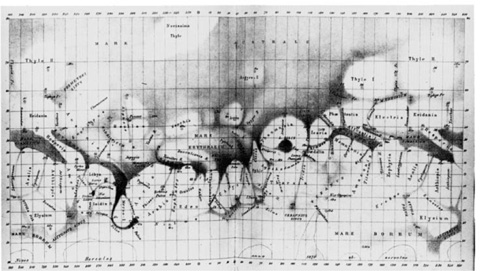
Fig 2: Map by Giovanni Schiaperelli made in 1879. Note the network of “canali.”
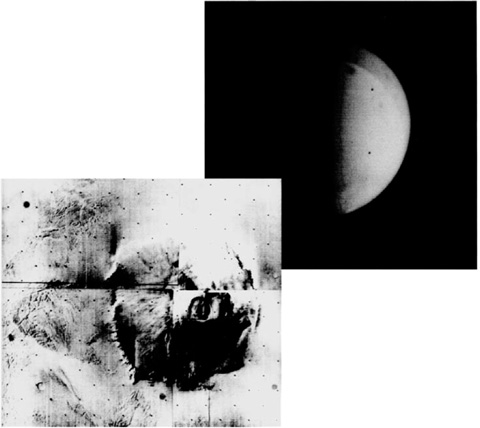
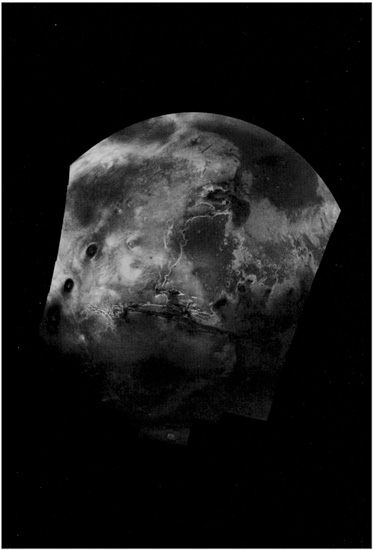
Fig 3 (right): Mars wreathed in dust, as seen by the approaching Mariner 9; the dark spot is Olympus Mons (1971).
Fig 4 (left: A Mariner 9 photomosaic of Olympus Mons (1972).
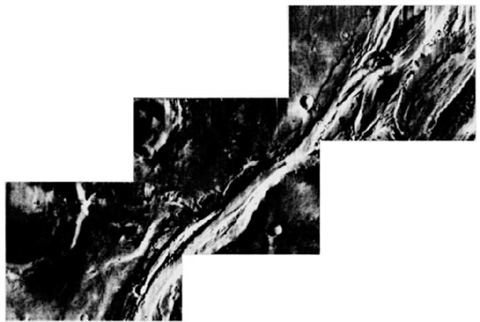
Fig 5 (bottom): A Mariner 9 picture of Mangala Vallis, an outflow channel that drains into Amazonis Planitia (1972).
Fig 6 (top opposite): A Mariner 9 photomosaic showing the North Pole and surrounding lowlands (1972).
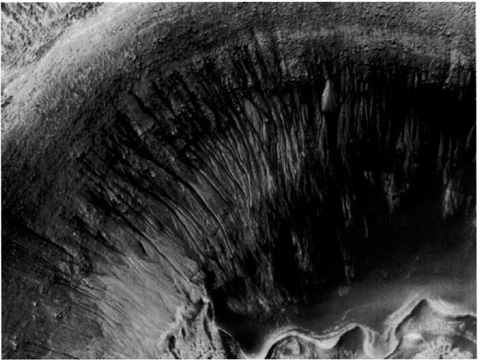
Fig 7 (bottom opposite): An oblique Viking view of Argyre Planitia and the southern highlands; the “smiley face” in Galle shows up nicely (1977).
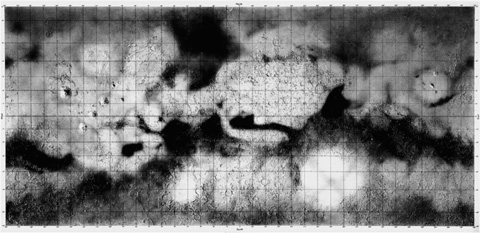
Fig 8: An albedo map prepared by Jay Inge from terrestrial observations (1971).

Fig 9: The first shaded-relief topographical map of the whole planet, prepared by Patricia Bridges and Jay Inge at the USGS (1972).
Fig 10: A composite of the previous two maps, prepared by Inge.
Fig 11: A detail from the 1:5 million shaded-relief map of Elysium (MC-15) by Jay Inge (1978).
Fig 12: A detail from the geological map of the western hemisphere by David Scott and Kenneth Tanaka (1986); this shows the area north of Valles Marineris, with Lunae Planum flanked by the outflow channels of Maja Vallis (east) and Kasei Vallis (northwest).
Fig 14 (above): David Smith’s pride and joy: a map produced from the MOLA database (2001).
Fig 13 (opposite): A USGS Viking-imagery photomosaic by Alfred McEwen (late 1980s). Features from figure 12 should be recognizable north of Valles Marineris. The dark tongue in the top right is Acidalia Planitia; the Tharsis volcanoes are surrounded by cloud.
Fig 15: MOC image of gullies in a small crater within the crater Newton (2000).
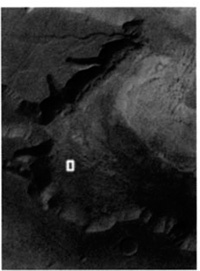
Fig 16: MOC image of western Candor Chasma (1999); the rectangle marks the site of figure 17.
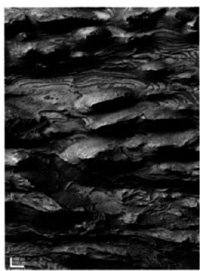
Fig 17: High-resolution MOC image of stacked layers, probably sedimentary, on the floor of Candor Chasma (1999).
Fig 18: MOC image of a layered “promontory” in the crater Terby, just north of Hellas Planitia (1999).
Fig 19: A painting by Chesley Bonestell that attempts to show the weakness of Martian gravity; the temple of Zeus at Olympus is reimagined on Mars, its pillars thinned because the weight they need to carry is reduced (1956).

Fig 20: A Bonestell of the earthly temple of Zeus, for comparison.
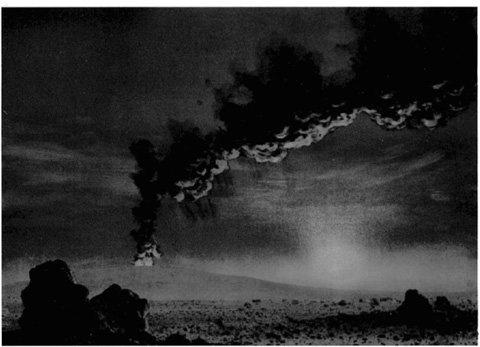
Fig 21: William Hartmann’s contemporary Martian volcanic eruption, painted in homage to Church (2000).

Fig 22: Cotopaxi, by Frederic Edwin Church (1862).
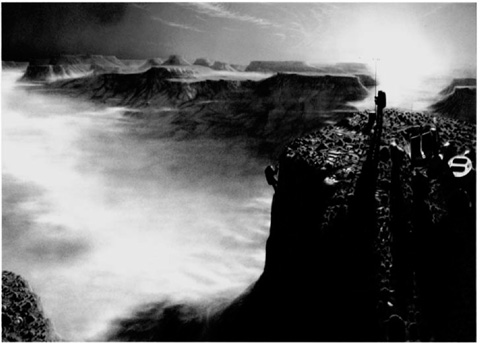
Fig 23: “First Light” by Pat Rawlings (1989).
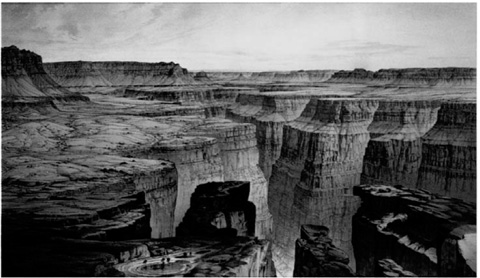
Fig 24: Engraving of the Toroweap by William Holmes, from the Atlas of the Tertiary History of the Grand Cañon (1882).
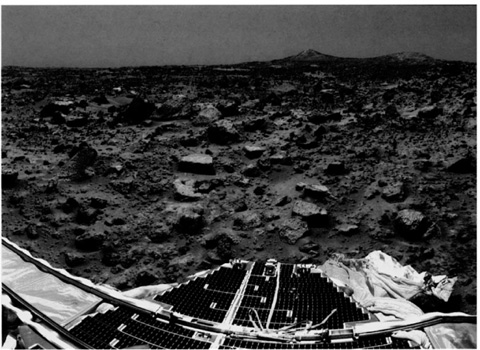
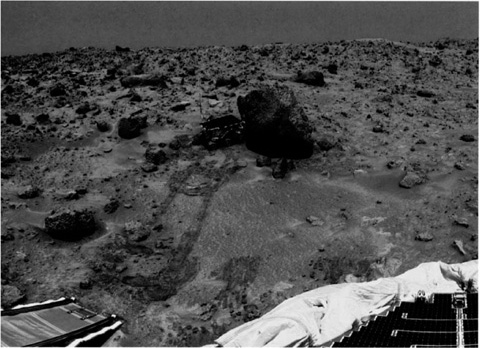
Fig 25: Detail from a panorama of the Mars Pathfinder landing site showing the Sojourner rover (1997).
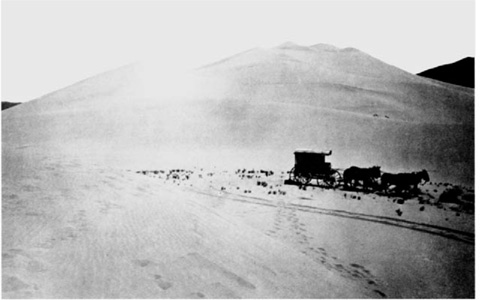
Fig 26: “Sand Dunes, Carson Desert, Nevada” by Timothy O’Sullivan (1877).
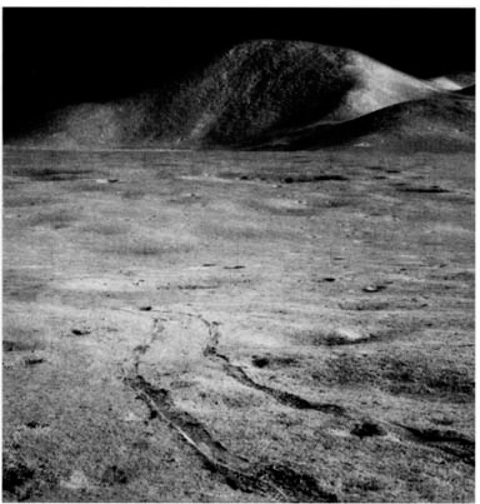
Fig 27: Lunar rover tracks in Palus Putredinis on the moon, with Mount Hadley in the background; photograph by James Irwin (1971), remastered by Michael Light.
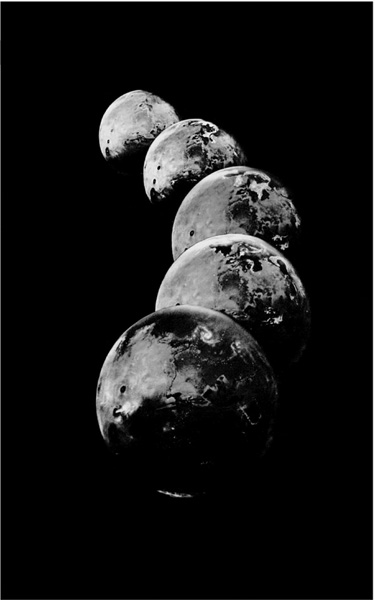
Fig 28 (following page): Sequence of images showing the return of a northern ocean to a terraformed Mars. By Michael Carroll (1989).
Grandest of all the possible new basins was Borealis, suggested in 1984 by Don Wilhelms, who had worked on Mariner 9, and Steve Squyres, then an up-and-coming planetary scientist at Cornell. Wilhelms has devoted relatively little of his time to Mars; he has become a moon man through and through, playing the same coordinating rule for lunar geological mapping that Dave Scott played for Mars. One of his pet lunar ideas was that a vast superbasin dominated its eastern hemisphere, a “Procellarian” basin two thousand miles across on which the familiar Imbrium basin, among others, was a later imposition. From that idea it was an easy step to the idea that Mars’s northern lowlands might represent an even bigger basin. Wilhelms and Squyres suggested that a range of features in the northern hemisphere represented remnants of a basin 4,800 miles across, centered at 50° N, 170° E; it would cover the north pole itself and much of the surrounding Vastitas Borealis, as well as the provinces of Utopia, Elysium, Arcadia, and Amazonis, extending over almost 30 percent of the planet’s surface. The lowlands, said Wilhelms and Squyres, had for the most part been formed in a single great blow.
Wilhelms and Squyres pointed out that, given what was generally believed about the early solar system, such a vast basin was quite plausible. Statistics suggested that if Mars had undergone a barrage of planetesimals similar to that which was recorded on the moon, it would have stood about a one in three chance of being hit by something big enough to form their Borealis. The problem with their idea was not that such an impact could not have happened. It was that the evidence for it was equivocal. The features that Wilhelms and Squyres saw as possible ramparts of Borealis were seen by other mappers as the edges of smaller (though still vast) heavily eroded basins. There were arguments for such basins in Utopia, Elysium, and north Tharsis. What was more, the dichotomy between the northern plains and the southern highlands isn’t terribly circular. So however big it might have been, a single Borealis impact simply couldn’t explain the northern lowlands all on its own: Extra impacts would be required around the edges for fine-tuning. Even then there would be some bits of the dichotomy unaccounted for.
Doing without Borealis, though, didn’t mean abandoning an impact-based explanation. Between them, after all, proposed impact basins in Chryse, Acidalia, Utopia, and Elysium account for a lot of the lowlands. If there were a few more basins whose traces had not yet been seen, the lowlands might be a patchwork of basins Hellas-sized or a bit bigger, some already mapped, some now too far gone to be mappable. But this idea, too, has a variety of problems. For a start, not everyone believes in all of the basins invoked. The idea that Chryse is a basin is broadly accepted; MOLA measurements have shown that the plains of Utopia, recognized as a basin through delicate geological mapping, do indeed sit in a large, round depression. Other northern basins, though, are less widely accepted. Then there was the problem that the northern plains are uniformly low, while a surface that is peppered with impact basins will still have raised areas between them. Each new basin would throw out ejecta that filled in the old ones. And the idea that all the biggest impacts in Martian history would be next to each other in the north, rather than spread all over the planet, was dubious.
Given the problems with impact scenarios, what are the alternatives? Some stretch back to Gilbert himself: Perhaps the asymmetry had been there since the planet’s original accretion out of objects of different densities. Another idea was that Mars’s metal core might not have separated itself from the stony mantle until comparatively late in the Noachian, and that this stygian cataclysm would have led to a plume of material rising through the mantle and removing the lower part of the northern lithosphere—the hard shell that comprises both the crust and the upper, cooler parts of the mantle—thus pulling the surface down.
There is now evidence that the core in fact formed right at the beginning of the planet’s history, but the idea that movement in the mantle might have simply dropped a section of the crust down a few miles retains some attractions. Among other things, it explains the conclusion from detailed mapping that some features at the boundary—mostly faults—date from the early Hesperian, while some of the features in the plains, such as the remnants of the Utopia basin’s rings, date from the Noachian. During the Noachian period, proponents of the sinking plains suggest, Mars was essentially undivided, with basins and craters everywhere; then at the beginning of the Hesperian, the northern parts sank a few miles en masse. Subsequent volcanism and sedimentation would have covered all but the most prominent features in the newly low lands, but would have left faint ghosts of the past topography, like those picked up in the mapping of Utopia.
This approach, too, has its problems. The main one is that no one really knows how you would go about lowering a third of the surface of a planet like the elevator on the deck of an aircraft carrier. And if you do find a way to get some mechanism in the mantle to do this, you have to explain why that mechanism doesn’t move things around from side to side as well. Or you have to accept that it could move things from side to side—in which case you have more or less worked your way around to a theory of plate tectonics, since plate tectonics deals with the way chunks of the lithosphere (plates) move around over a circulating mantle.
The fundamental insight of the 1960s’ plate tectonics revolution was that convection currents deep in the mantle, a result of the transfer of heat from the planet’s hot interior toward its cooler surface, are linked to processes near the Earth’s surface that create new portions of the crust and destroy older ones. The creation takes place along the ridges that run along the floors of oceans. The destruction takes place when a piece of oceanic crust is overridden by another plate and sinks into the mantle. The ridge between Europe and North America churns out new oceanic crust to the east and west as the two continents move apart; subduction zones circle the Pacific, the ring of fire where oceanic crust is destroyed.
When the plate tectonic revolution was at its height, Carl Sagan, never afraid to speculate and always alert to trends, suggested in a paper with his student James Pollack that the linear features Lowell had seen as canals might in fact be the Martian equivalent of midocean ridges. Once Mariner 9 had revealed the planet’s surface in its entirety, though, there seemed little room for Martian plate tectonics. Admittedly, Valles Marineris looked like a rift valley; but plate tectonics pushes continents together as often as it pulls them apart, creating compressional structures (the Alps, the Himalayas) as well as extensional ones (such as the East African rift, or the midocean ridges). On Mars, most faulting seemed to be extensional. And moving a set of rigid plates across a spherical surface necessarily cracks them so as to produce what geologists call “strike-slip” faults: Faults where one side has moved forward along the fault with respect to the other. On a pockmarked surface like that of Mars, strike-slip faulting would show up nicely, displacing one part of a crater with respect to the other. But almost no such faulting was seen: Faults on Mars all seemed to be the movement of one bit of crust up or down with respect to the other, rather than movements from side to side.
In this, as in other things, Mars looked like the moon. And that made sense, since both are a lot smaller than the Earth. Plate tectonics depend on the Earth’s internal heat, mostly generated by the decay of radioactive elements in the mantle. Bigger planets have bigger mantles and thus more internal heat. It was quite reasonable to assume that the Martian mantle, seven times less massive than the Earth’s and wrapped around a smaller, colder core, lacked the oomph required to push the lithosphere around.
So Martian geologists never really thought much about plate tectonics. In the late 1980s, though, someone outside the field started to get interested. Norm Sleep, a geophysicist at Stanford University, is widely respected as an expert on the way in which the Earth’s mantle drives plate tectonics. When his thoughts—which range wide—turned to Mars, the northern lowlands seemed to cry out for an explanation in terms of his particular expertise. In 1994 he provided that explanation. In early Martian history, something like one of the Earth’s midocean ridges had formed along the long arc of the highland-lowland boundary that runs between Isidis and Amazonis. This rift started to create new dense basaltic crust. Once new crust is being produced, old crust has to start being pushed back into the mantle at subduction zones: Sleep suggested that a subduction zone ran along the north of Tharsis and Arabia. Old cratered crust that had previously covered the high northern latitudes was pushed down into the mantle along this new subduction zone, its place taken by the new, thinner, denser crust produced at the ridge. As time went on the ridge moved north, away from the dichotomy, leaving smooth new crust behind it. (Since ridges produce crust on both their sides, they always push themselves away from the places where they begin; that’s why the mid-Atlantic ridge is in the middle of the ocean.) This tectonic process only stopped when part of the ridge ran into the subduction zone along the north of Arabia; the other section of ridge ended up stuck to the western and northern flanks of Tharsis, where Olympus Mons and Alba Patera are today. Its fires, Sleep suggested, could have fueled the volcanoes’ prodigious growth.
Norm Sleep’s proposal did offer an explanation for the flatness of the plains, as well as their low level—on the Earth, basaltic crust produced at fast-moving ridges tends to be very flat indeed. But the flatness of the plains does not necessarily have to be explained that way; it could come from flat sediments or lavas covering an originally knobbly surface. Sleep’s story was ingenious in the way it tried to account for some of the oddities of the northern plain: The stalled ridge would account for some strange outcrops north of Arabia; and a strike-slip fault in the ridge would explain an oddly straight set of hills—Phlegra Montes—northeast of Elysium. But these were not compelling readings and there were alternative explanations. Phlegra Montes could well form part of one of the outer rings of the Utopia basin (the fact that Sleep didn’t spell Phlegra correctly may not have helped his case with the Mars experts). In general, the evidence for plate tectonic features in the plains was seen as slight. And again there was a real problem with the ages. The Noachian structures in the northern plains predated the faulting at the edge of the highlands that Sleep saw as evidence for the onset of rifting, and clearly the plains could not predate the creation of the rift that had made them.
In 1999, though, when Mars Global Surveyor began its mapping mission, plate tectonics of some sort made something of a comeback, thanks to a wealth of new geophysical data. First MOLA showed that the plains, always known to be low and relatively flat, were in fact remarkably flat; by some measures, the flattest surface in the solar system. The only comparably flat places on Earth were the ocean floors, where flattening sediments sit on already flat crust. And then the MGS magnetometer produced one of the mission’s most profound surprises: broad stripes of magnetism across a large swathe of the southern hemisphere south and west of Tharsis.
Earlier Mars missions had detected barely a trace of a magnetic field and this was not a great surprise. The Earth’s magnetic field is generated by currents in the liquid outer layer of its core. Mars is not thought to have a hot liquid layer in its core. Again, the problem is a lack of heat. Mars, like the other rocky planets, would have been born hot—a fearful amount of energy is released as the constituent planetesimals smash into each other—but, being small, it would have lost that heat quite quickly. Its iron core would quickly have frozen solid, at which point any currents generating magnetic fields would have ceased. The magnetic field detected by MGS, though, was not coming from the core: It was coming from the rocks in the crust. Igneous rocks contain minerals that can act as tiny magnets and, when they cool below a certain point, these tiny magnets align themselves with the local magnetic field. From then on that’s the orientation they are stuck with. Part of the plate tectonic revolution was an understanding of what these magnetic fields frozen into rocks could reveal about the past. The fields detected on Mars seem to be similar remnants of a bygone age: Sometime in the early Noachian, when the crust of the southern highlands cooled down enough to have a magnetic field imprinted on it, there was a magnetic field there to do the imprinting.
It was not just the fact of the magnetism that came as a surprise. Its strength and pattern were also remarkable. The remnant magnetism was much stronger than was ever seen on Earth. And the magnetic field was arranged in long parallel stripes—which made Norm Sleep very excited. Vast magnetic stripes along the floor of the Atlantic had been one of the keys to plate tectonics. The new crust produced at ocean ridges preserves the magnetic field at the time that it cooled down, so since the direction of the Earth’s magnetic field flops over on a fairly regular basis the magnetic polarity of the rocks on the ocean floor changes regularly: Looked at in terms of magnetic field, the floor of the Atlantic is covered in stripes of opposite polarity arranged symmetrically around the central ridge. Stripes in the Martian crust suggested it might have been made in a similar way.
As always, there are other explanations. If you take a bar magnet with a north pole and a south pole and break it in two, you get two magnets each with a north pole and a south pole; the more you break them, the more poles you get. Similarly, if you take a magnetized lump of crust and fracture it with faults, you’ll break up its uniform field and make it stripy. But even if these stripes are not produced in the same way as the stripes along earthly ocean floors, they still speak to a very powerful primary magnetic field, and thus an active interior that makes plate tectonics more plausible than they would otherwise be.
Another set of data from MGS has also been taken as evidence that internal, rather than external, effects created the northern plains. A planet’s gravitational field is not uniform: If you stand close to a big mountain with a plumb line in your hand, the bob will be attracted toward the mountain and the line will not point quite toward the center of the Earth. In the nineteenth century, though, surveyors in India noticed that their bobs were not as attracted toward the Himalayas as they would have expected. An explanation for this effect was offered by the Astronomer Royal, George Airy—a nonastronomical insight that was his greatest contribution to science. Airy’s suggestion was that the crust of the Earth was thicker under the mountains. Assuming that the crust floats on the mantle beneath it because it is lighter, thicker crust will both sink farther into the mantle and stick up farther above it (think of a thick log floating next to a thin plank). Thus mountains must have deep roots that are less dense than the surrounding mantle that they float in—and this relative lack of density down below accounts for the smaller than expected effect of mountain ranges on the gravitational field at the surface. (The same principle applies to the ocean floors: The crust created at ocean ridges is thin and dense, and so it floats lower in the mantle than the thicker, less dense continents.) This floating is known as isostatic equilibrium. Among Gilbert’s great contributions to geology were his measurements of the way the crust in the Utah desert had risen as it sought to reestablish isostatic equilibrium when relieved of the burden of a large lake.
From the beginning of the space age it had been clear that accurately tracked spacecraft provide a very good way of measuring gravitational fields. In the early 1960s America’s Transit navigation satellites allowed an unprecedentedly accurate map of the oddities in the Earth’s field to be made—information vital if America was to get its ballistic missiles to fall in more or less the places it was aiming at. Then JPL’s Lunar Orbiter spacecraft found that some lunar maria were more attractive than they should be; they represented concentrations of mass, “mascons” in the jargon, powerful enough to make quite a change to a spacecraft’s orbit. The explanation for this was that the moon, being small and thus cold, has a very thick lithosphere that can support great weights. When thick basaltic lavas filled up large impact basins, the floors of the basins did not sink to isostatic equilibrium: The thick lunar lithosphere simply supported the lavas where they were, producing the unusual mascons.
MGS has provided the best data yet seen on the Martian gravitational field. Much of the planet seems to be in something like equilibrium. The Tharsis bulge stands out as a positive anomaly, suggesting that its height is supported by a very thick, strong lithosphere, rather than by the buoyancy that would be provided by peculiar deep crustal roots. Two of the obvious basins—Argyre and Isidis—show mascons like those seen on the moon. So does the Utopia basin in the northern lowlands, suggesting that it has been filled in by lavas or sediments many miles deep. But though Utopia looks like a basin in this way, the northern plains as a whole do not. The gravity data offer no obvious support for either the one-big-impact idea or the clustered impact idea, indeed, it seems to argue against them.
Combining these gravity measurements with the detailed topographic data provided by MOLA has allowed MGS scientists to make a rough estimate of how the Martian crust differs in thickness around the planet. Differences in crustal thickness suggest that the flow of heat through the southern highlands in the earliest days of the crust was lower than one would expect, given what is thought to be known about the total supply of internal heat available. Less heat in the south suggests more heat in the north, pumped from the deeps by some sort of convection in the mantle. Mantle convection like that which, on Earth, drives plate tectonics.
So, after thirty years of mapping and study, the most salient geological feature on the face of the planet lacks an agreed explanation. The multiple working hypotheses all have their problems. More tests are needed, which means more data. Most of all, especially from the geologists’ point of view, dates are needed. Solid, reliable dates by which their threefold history of Mars could be tied down, which could say for sure when the dichotomy formed, and which could help answer the other great question raised by the idea that movements in the mantle have shaped Martian history. Have those movements stopped completely? Or does Mars still have enough internal heat to drive a little activity? Are its volcanoes long dead, or merely dormant?
* Just because it’s perverse doesn’t mean it’s impossible. Thomas Gold, an astrophysicist at Cornell who has various iconoclastic views about planets and their interiors, is convinced that Olympus Mons is made of frozen mud.