5
The Stock Market Is Smarter Than You Think
The stock market's volatility and the erratic pricing of some companies' shares have raised questions about whether stock prices are actually linked to economic fundamentals. Some experts even assert that stock markets lead lives of their own. Nobel Prize winner Robert Shiller writes, “Fundamentally, stock markets are driven by popular narratives, which don't need basis in solid facts.”1 Bill Gross, cofounder and former chief investment officer of PIMCO, one of the world's largest fixed-income investment managers, claims that the last 100 years of U.S. stock returns “belied a commonsensical flaw much like that of a chain letter or yes—a Ponzi scheme.”2
Does it make sense to view the stock market as an arena where emotions rule supreme? We think not. Certainly, irrational behavior can drive prices for some stocks in some sectors in the short term. And for shorter periods of time, even the market as a whole can lose touch with economic fundamentals. But in the long term, the facts clearly show that individual stocks and the market as a whole track return on invested capital (ROIC) and growth. For this reason, managers should continue to make decisions based on these fundamental value drivers. By doing so, managers can also detect and perhaps exploit any irrational market deviations if and when they occur.
In this chapter, we'll explain how a market with different types of investors can lead to rational prices most of the time, even if some of the investors don't make decisions based on economic fundamentals. Then we'll show the empirical evidence that growth and ROIC are, in fact, the key drivers of value. Finally, we'll explode the myths behind a number of commonly accepted beliefs that are at odds with the fundamental principles of valuation.
Markets and Fundamentals: A Model
We use a straightforward model to illustrate how market trading by both fundamental, or informed, investors and nonfundamental investors (what we call “noise traders”) will produce prices that are generally in line with intrinsic value but can still be volatile.3 These prices may even deviate significantly from intrinsic value under certain, albeit rare, conditions.
Assume a basic market where trading is limited to only one company's stock and a risk-free asset (for comparison). Two types of investors trade in this market. Informed investors develop a point of view about the intrinsic value of the company's shares based on its underlying fundamentals, such as return on capital and growth. They base their buy and sell decisions on this informed point of view. They may not all agree on the intrinsic value. Some may believe the company's shares are worth $40, others $50, and others $60. Because of transaction costs and uncertainty about the intrinsic value, they will trade only if the stock price deviates by more than 10 percent from their value estimates.
The other type of investors in this market are the noise traders. These traders may be news oriented, trading on any event that they believe will move the share price in the near term, without having a point of view on the company's intrinsic value. Noise traders can also trade on momentum, basing their trades only on price trends: when shares are going up, they buy, assuming the price will continue to increase, and when prices are going down, they sell.4
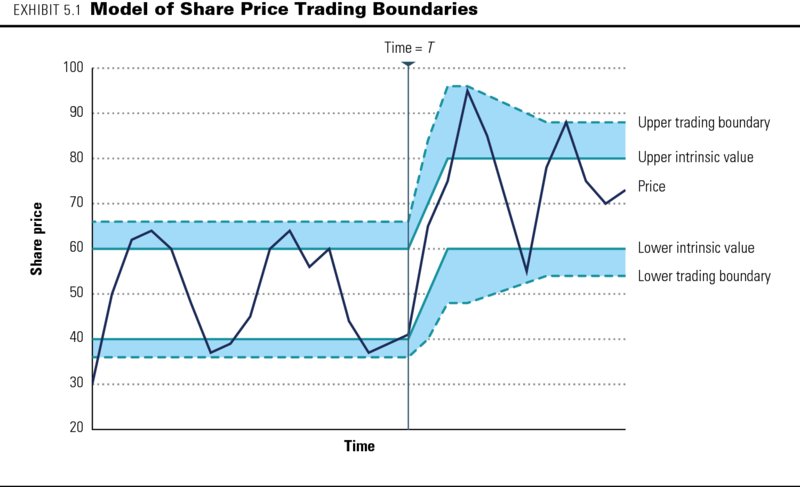
Say trading starts when the price of a single share in the market is $30. Informed investors start buying shares because they believe the shares should be worth $40 to $60; this buying drives up the share price. Some noise traders notice the rising share price and begin to purchase as well. This accelerates the share price increase, attracting more and more noise traders to jump on the bandwagon. As the share price increases, the informed investors gradually slow their purchases. At $44 the most pessimistic begin to sell. Once the price passes $66, all informed investors are selling. Momentum declines, which some of the noise traders sense, so they begin to sell as well. The selling pressure builds, and the stock price begins to fall. The noise investors accelerate the fall, but this slows as more and more informed investors begin to buy until, at $36, all informed investors are buying again and the fall is reversed.
The pattern continues, with the share price oscillating within a band whose boundaries are set by the informed investors, as shown in Exhibit 5.1. If the noise traders act not only on price movements but also on random, insignificant events, there will also be price oscillations within the band. The band itself can change over time, depending on the uncertainty among informed investors about the company's intrinsic value. For example, product launches or successes in research and development can lead informed investors to increase their value estimates as well as their trading bandwidth. As a result, price volatility will be temporarily higher while they are absorbing the new information, as shown in the period after time T in Exhibit 5.1.
In this model, prices will move within the bandwidth if there is sufficient informed capital. This mechanism can break down, but only in rare situations. For example, when fundamental investors are vastly outnumbered by noise traders, their sales of stocks might not be able to stop a price rally. Such circumstances are unlikely, given the amounts of capital managed by sophisticated, professional—that is to say, fundamental—investors today.5 Nevertheless, once they have sold all the overvalued stock, some fundamental investors can be reluctant to engage in short sales for fear of losing significant amounts before prices revert to higher levels. Others can face institutional or regulatory restrictions. As a result, the price rally might continue. But noise traders cannot push share prices above their intrinsic levels for prolonged periods; at some point, fundamentals prevail in setting prices in the stock market. In extreme cases, such as the technology bubble of the 1990s, this could take a few years, but the stock market always corrects itself to align with the underlying fundamental economics.
Markets and Fundamentals: The Evidence
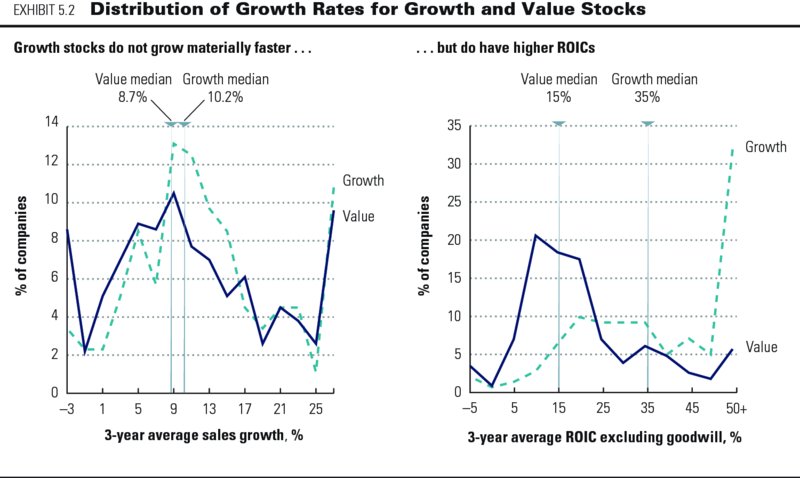
Even some of the most conventional beliefs about the stock market are not supported by the facts. For example, most growth and value indexes, like those of Standard & Poor's, categorize companies as either “value” or “growth” based on a combination of factors, including market-to-book ratios and price-to-earnings (P/E) ratios. Typically, companies with high market-to-book ratios and high P/Es end up in the growth category, while the others fall in the value category. However, growth is only one factor driving differences in market-to-book ratios and P/Es. ROIC also is important. In fact, we have found no difference in the distribution of growth rates between so-called value and growth stocks (see Exhibit 5.2). We did, however, find that so-called growth stocks tend to have high ROICs, and value stocks have lower ROICs. The median return on capital for so-called value companies was 15 percent, compared with 35 percent for the growth companies. So the companies classified as growth did not grow faster on average, but they did have higher returns on capital. That's why a modestly growing company, like the tobacco company Philip Morris International, ends up on the growth-stock list.
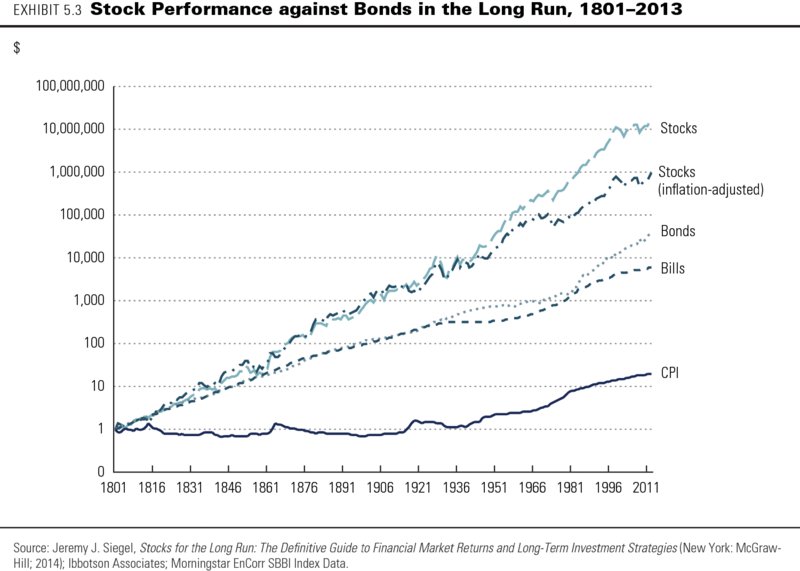
Similarly, market bubbles and crises have always captured public attention, fueling the belief that the stock market moves in chaotic ways, detached from economic fundamentals. The 2008 financial crisis, the technology bubble of the 1990s, the Black Monday crash of October 1987, the leveraged-buyout (LBO) craze of the 1980s, and, of course, the Wall Street crash of 1929 appear to confirm such ideas. But the facts tell a different story. In spite of these events, U.S. equities over the past 200 years have delivered decade after decade of consistent returns to shareholders of about 6.5 percent annually, adjusted for inflation. Over the long term, the stock market is far from chaotic (see Exhibit 5.3).
The origins of this 6.5 percent inflation-adjusted total returns to shareholders (TRS) lies in the fundamental performance of companies and the long-term cost of equity. Unadjusted for inflation, TRS is simply the sum of the percentage share price appreciation plus the cash yield. Over the past 70 years, real corporate profits in the United States have grown about 3.0 to 3.5 percent per year, and the median P/E has hovered around a level of about 15.6 If P/Es revert to a normal level over time, share price appreciation should therefore amount to around 3.0 to 3.5 percent per year. In addition, corporate America, as a whole, typically reinvests about 50 percent of its profits every year to achieve this profit growth, leaving the other half to be paid to shareholders as dividends and share repurchases. This translates to a cash yield to shareholders of about 3.0 to 3.5 percent at the long-term average P/E of 15.7 Adding the cash yield to the annual 3.0 to 3.5 percent share price appreciation results in total real shareholder returns of about 6.5 percent per year.
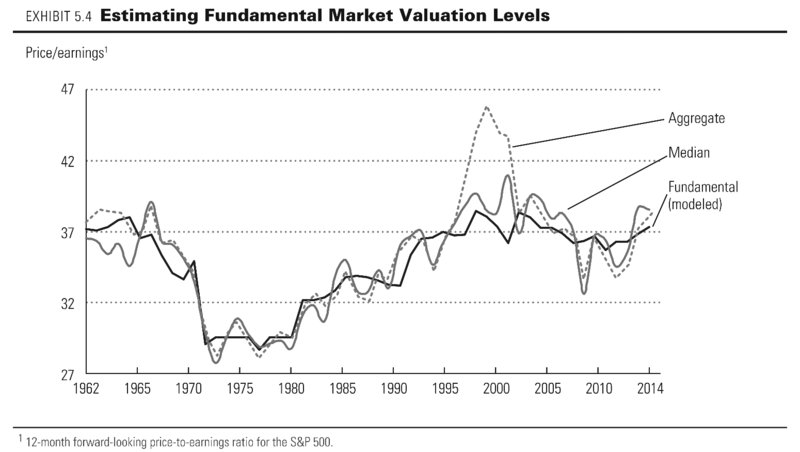
The fundamental performance of companies and of the economy also explains the level of the stock market over shorter periods of time. We estimated a fundamental P/E for the U.S. stock market for each year from 1962 to 2014, using a simple equity discounted-cash-flow (DCF) valuation model following the value driver formula first presented in Chapter 2. We estimated what the price-to-earnings ratios would have been for the U.S. stock market for each year, had they been based on these fundamental economic factors. Exhibit 5.4 shows how well a simple, fundamental valuation model fits the stock market's actual P/E levels over the past five decades, despite periods of extremely high economic growth in the 1960s and 1990s, as well as periods of low growth and high inflation in the 1970s and 1980s. By and large, the U.S. stock market has been fairly priced and in general has oscillated around its fundamental price-to-earnings ratios. Note that both the fundamental and actual P/Es have shown an upward trend over the past 30 years, driven by increasing margins and returns on capital.8 We did a similar analysis for the European stock markets and obtained similar results.
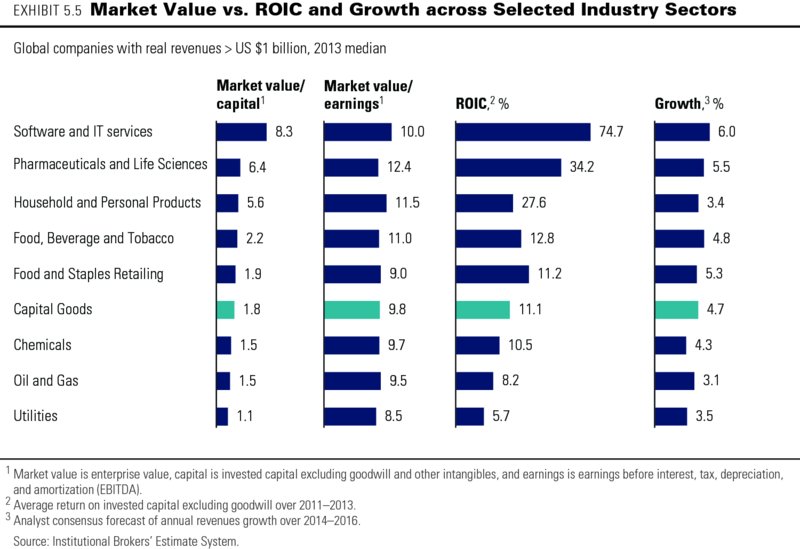
What holds for the stock market as a whole also holds across industries. For selected industry sectors of the largest listed companies in the world in 2013, 9 we took their average ROIC for the previous three years as a proxy for expected future returns, and used the analysts' consensus estimate of their three-year growth outlook as the proxy for long-term expected growth (see Exhibit 5.5). Industries with higher ratios of market value to capital or market value to earnings also have higher growth and/or higher ROIC driven by better sales margins and capital turnover. Software and pharmaceutical companies had the highest valuation levels, thanks to having the highest ROICs combined with superior growth. Oil and gas companies and utilities were valued at low market-value-to-capital multiples because of their low return on capital and low expected growth. Manufacturers of household and personal products enjoyed high valuation levels thanks to their superior ROIC even though their growth expectations were below average. Note that the ratios of market value to earnings show less variation across sectors, reflecting investor expectations of converging earnings growth in the long term. For example, software and IT services companies scored highest on ROIC and growth but not on earnings multiple because of anticipated sales margin pressure over the long term.
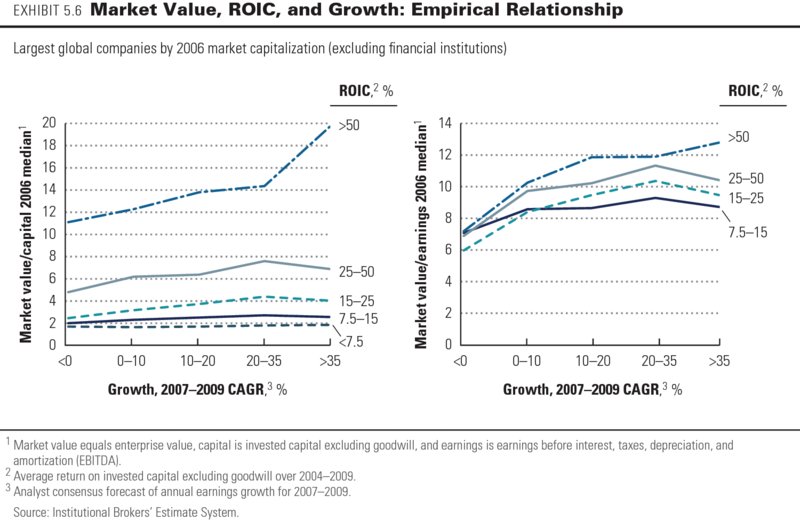
The same principles apply to individual companies. We compared the ratios of market value to capital of the world's 1,700 largest listed companies by market capitalization in 2006 versus their expected ROIC and growth. Exhibit 5.6 shows that, for any level of growth, higher rates of ROIC lead to higher market values, and above a given level of ROIC, higher growth also leads to higher value. Although the empirical results do not fit the theoretical model perfectly, they still clearly demonstrate that the market values companies based on growth and ROIC.10
Nevertheless, there have been periods when deviations from economic fundamentals were so significant and widespread that they affected the stock market as a whole. Two recent examples are the technology bubble that burst in 2000 and the credit bubble that collapsed in 2007 (see Exhibit 5.7).
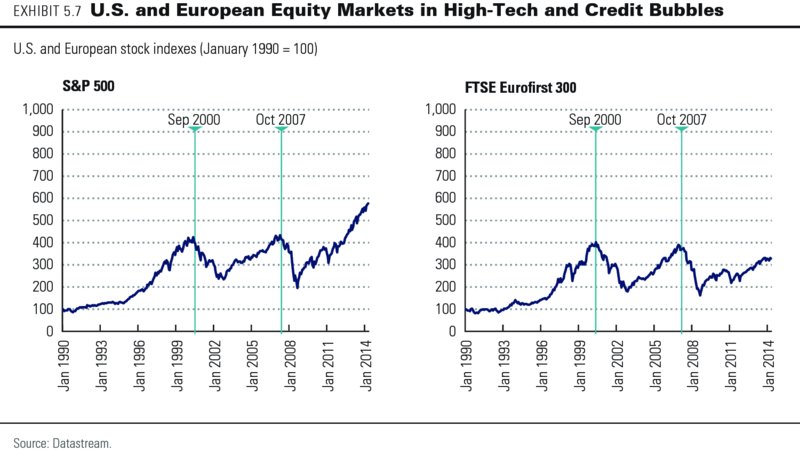
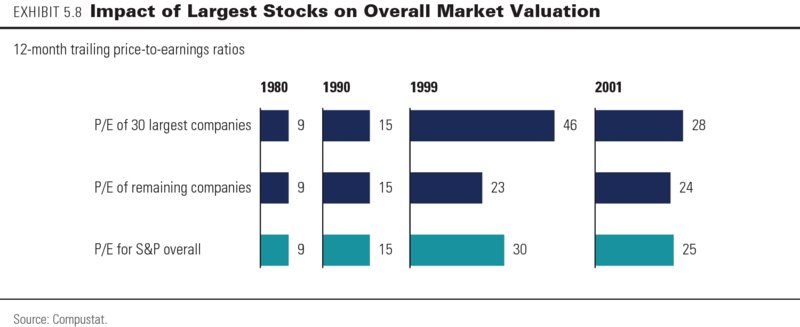
The technology market boom is a classic example of a valuation bubble, in which stocks are priced at earnings multiples that underlying fundamentals cannot justify. When Netscape Communications became a public company in 1995, it saw its market capitalization soar to $6 billion on an annual revenue base of just $85 million. As investors quickly became convinced that the Internet would change the world, they sent the Standard & Poor's (S&P) 500 index to a new peak of more than 1,500 in 2000. By 2001, the index had tumbled back to half that level. Although the valuation of the market as a whole was affected, the technology bubble was concentrated in technology stocks and certain very large stocks in other sectors (so-called megacaps). Before and after the bubble, the P/Es of the 30 largest companies were about the same on average as those of the other 470 companies in the index (see Exhibit 5.8). However, in 1999, the average top-30 company had a P/E of 46 times, compared with an average of 23 times for the other 470 companies. As a result, the weighted average P/E for the market overall reached 30 times.
Most of the large-capitalization companies with high P/Es were clustered in just three sectors: technology, media, and telecommunications (TMT). Of course, some of the companies born in this era (including Amazon.com and eBay) have created and are likely to continue to create substantial economic value. But for every solid, innovative new business idea, there were dozens of companies that forgot or purposely threw out fundamental rules of economics.
By 2007, stock markets around the world had more than recovered from the technology bubble fallout, and the S&P 500 reached a new peak value in excess of 1,500 (see Exhibit 5.7). This time, the market rode to its peak on the back of an earnings bubble instead of a valuation bubble.11 The largest property boom and credit expansion in U.S. and European history drove corporate earnings to exceptional levels that ultimately proved unsustainable. Aggregate return on equity (ROE) had shot up to 23 percent in 2006, well above the 13.6 percent median ROE from 1962 to 2006. Combined with exceptional growth, the record returns on capital caused the ratio of total profits to gross domestic product (GDP) to jump to an unprecedented 5.7 percent in 2006—much higher than the historical average of about 2.3 percent, and easily surpassing the previous record of 4.5 percent, set in 2000.12 Although all companies were affected, this bubble too was mainly driven by a few sectors. The financial, energy, utilities, and materials sectors showed sharply inflated earnings from 41 percent of total S&P earnings in 1997 to 51 percent in 2006. But in 2007, a chain reaction of collapsing funding structures for mortgages and other forms of credit brought financial institutions across the world into distress. Stock markets worldwide lost more than half of their value as the world's economy experienced the steepest downturn since the 1930s. By 2009, before the recession bottomed out, the stock market had largely corrected itself to valuation levels more in line with sustainable profits.
Paradoxically, the fact that market deviations do occur from time to time makes it even more important for corporate managers and investors to understand the true, intrinsic value of their companies; otherwise, they will be unsure how to exploit any market deviations, if and when they occur. For instance, they might use shares to pay for acquisitions when those shares are overvalued by the market, or they might divest particular businesses at times when trading and transaction multiples in those sectors are higher than underlying fundamentals can justify.
What about Earnings?
So far, we've made the positive case for managers to focus their energy on growth at an attractive ROIC. Yet some companies go to great lengths to achieve a certain earnings per share (EPS) number or smooth out their earnings. This is wasted energy. The evidence shows that these efforts aren't worth it, and they may actually hurt the company.
We're not saying that earnings don't matter. Companies that create value often have attractive earnings growth, and earnings will equal cash flow over the life span of the company. But as we've pointed out, earnings growth without a return on invested capital exceeding the cost of capital will destroy value. Similarly, earnings growth based purely on cost cutting, not organic revenue growth, is not sustainable.
In this section, we'll show that the sophisticated investors who drive stock market values dig beneath a company's accounting information in order to understand the underlying economic fundamentals. A classic example is the share price reaction to changes in inventory accounting by U.S. companies in the 1960s and 1970s. Because of rising price levels in these years, changing from first-in first-out (FIFO) to last-in first-out (LIFO) accounting decreased reported profits as well as taxable income. But the investor reaction reflected by the share price was typically positive, because investors understood that free cash flows would be higher as a result of lower taxes.13
Sometimes investors have difficulty detecting the true economic situation behind accounting information. For example, the financial reports of many banks and insurance companies are so opaque that it is difficult for investors to assess those businesses' true returns on capital and risks. Some companies, including Enron and WorldCom, have misled stock markets by purposely manipulating their financial statements. But all managers should understand that markets can be mistaken or fooled for only so long. Sooner or later, share prices need to be justified by cash flows rather than accounting earnings.
Earnings from Mergers and Acquisitions (M&A)
It's relatively easy for companies to increase their earnings by buying another company. Say a company has $1 billion of excess cash. It uses the cash to buy another company earning $50 million per year at a P/E multiple of 20 times. Its earnings will increase by $50 million, less the forgone interest it was earning on the excess cash—say, $5 million (at a 0.5 percent after-tax return on cash)—for a net increase of $45 million. Though its earnings have increased, we can't tell whether it has created value. At a 20 P/E purchase price, it will be earning only 5 percent on its invested capital. If it has a 10 percent cost of capital, it will need to double the earnings of the acquired company to earn its cost of capital on the $1 billion it just invested. Investors see through the accounting earnings. Chapter 27 shows that whether an acquisition increases or decreases earnings in the first year or two after the acquisition has no correlation with the stock market's reaction to the transaction.
Decisions on acquisitions and divestments should be based on whether or not these transactions create value. That can be the case only if the combined cash flows of the business involved in the transaction increase because of additional revenues, cost reductions, or capital efficiency improvements. We come across executives and financial professionals who believe in the illusion of “multiple expansion,” as we discussed in Chapter 3. This assumes that the stock market will value an acquired business at the earnings multiple of the acquiring business. Any acquisition of a lower-multiple business would then lead to value creation, regardless of the businesses involved and the impact on future cash flows. Not surprisingly, there is no empirical evidence or economic logic for such expansion. The earnings multiple of two combined businesses will simply equal the weighted average of the individual earnings multiples. Any value increase must come from additional cash flows over and above those of the individual businesses.
Write-Downs
Executives are often reluctant to take the earnings hit from writing down the value of assets, assuming that investors will react negatively. Investors don't respond mechanically to write-downs. Rather, they assess what information the write-down conveys about the future performance of the company.
We looked at 99 companies in the United States that had written off at least $2 billion of impaired goodwill against their profits from 2007 to 2011.14 There was no statistically significant drop in share prices on the day a write-off was announced. The markets had already anticipated the lower benefits from past acquisitions and reduced the share prices long before the write-off announcements. For example, prices jumped nearly 10 percent when Boston Scientific announced a $2.7 billion write-down associated with its 2006 acquisition of Guidant. Prices rose almost 8 percent when U.S. Steel announced a goodwill impairment charge of $1.8 billion with its third-quarter earnings in 2013. We found a similar pattern for the 15 largest goodwill impairments by European companies from 2010 to 2012. The pattern is consistent over many years. Exhibit 5.9 shows there is no statistically significant drop in share prices on the announcement of goodwill impairments in an earlier sample of 54 companies in the United States and Europe from 2002 to 2004.15
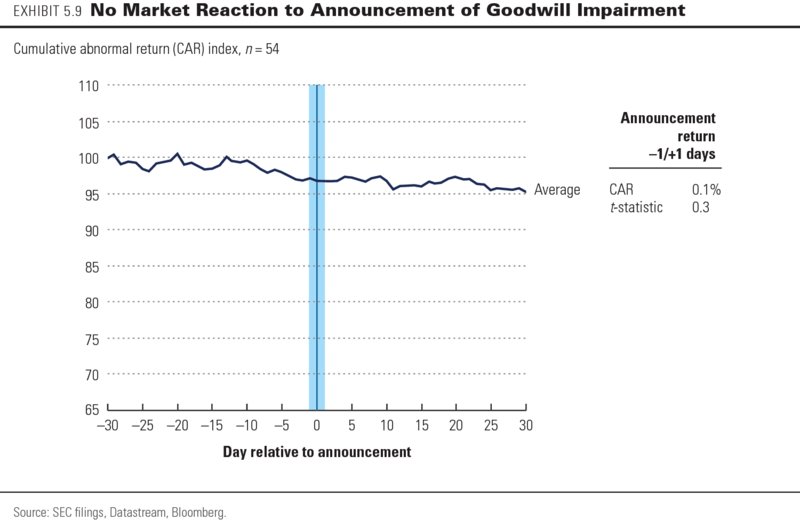
Stock markets clearly look at the underlying cash flows and business fundamentals rather than reported earnings and goodwill impairments. In the 2010 to 2012 sample of European write-offs, in fact, only one analyst report issued after one announcement even commented on the size of the impairment. Analysts did, however, comment strongly on indications of how the company would move forward. Changes in signals or explicit guidance about future operating earnings, the outlook for the market and business units, and any management actions or plans to address changing conditions are important.
Employee Stock Options
In the early 2000s, proposed new accounting rules requiring employee stock options to be expensed in the income statement caused much concern. Some executives and venture capitalists claimed that expensing stock options would reduce the earnings of small high-growth companies so much that they would not be able to take the companies public.
Of course, there was no need for concern, because stock prices are driven by cash flows, not reported earnings. Academic research has shown that the stock market already took account of employee options in its valuation of companies that give full information about their options schemes—even when the option values are not explicitly expensed in the companies' income statements.16 In fact, companies that voluntarily expensed their employee options before it became mandatory experienced no decrease in share price, despite the negative implications for reported earnings.17
We came to a similar conclusion after examining 120 U.S. companies that began expensing their stock options between July 2002 and May 2004. Furthermore, we found no relationship between the size of the earnings decrease due to option expensing and any abnormal returns during the days surrounding the new policy's announcement. The market already had the relevant information on the option plans and was not confused by a change in reporting policy.
Different Accounting Standards
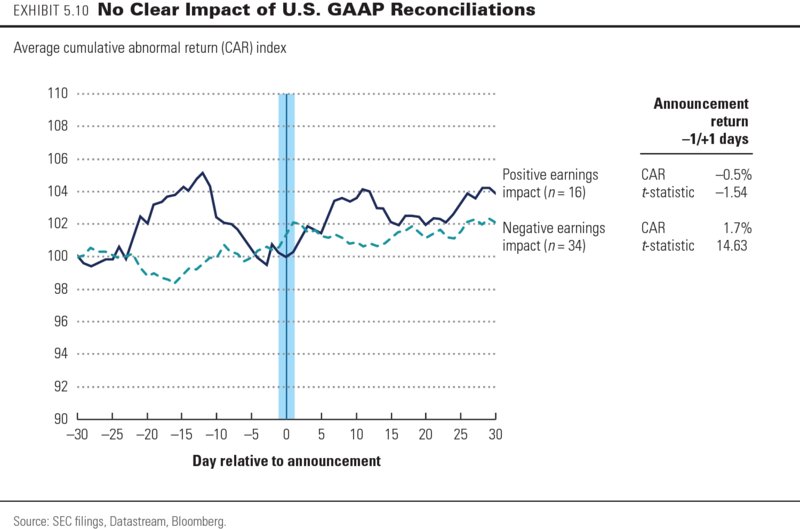
Share price data for companies that report different accounting results in different stock markets provide additional evidence that stock markets do not take reported earnings at face value. Non-U.S. companies that have securities listed in the United States and do not report under U.S. Generally Accepted Accounting Principles (GAAP) or International Financial Reporting Standards (IFRS), for example, are still required to report equity and net profit under U.S. GAAP.18 These can give results that differ significantly from the equity and net profit reported under their domestic accounting standards. We analyzed a sample of 50 European companies that began reporting reconciliations of equity and profit to U.S. GAAP after obtaining U.S. listings between 1997 and 2004. The differences between net income and equity under U.S. and local accounting standards were often quite large; in more than half the cases, the gap was more than 30 percent.
Many executives probably worried that lower earnings under U.S. GAAP would translate directly into a lower share price. But this was not the case. As shown in Exhibit 5.10, even though two-thirds of the companies in our sample reported lower earnings following U.S. disclosure, the stock market reaction to their disclosure was positive. At that time, following U.S. GAAP standards also generally meant disclosing more information than required by local standards. Evidently, improved disclosure outweighed any artificial accounting effects.
Earnings Management
On February 13, 2013, cloud computing company Rackspace Hosting reported record fourth-quarter earnings of $0.21 per share, just one cent short of the $0.22 analyst consensus expectations. On the same day, its share price dropped by almost 20 percent. But the trigger for the price decline was not the company's narrowly missing its earnings target. Rather, its revenue growth had been slowing down for the fifth quarter in a row, raising concerns among investors about the company's long-term outlook. Still, events such as this have led many managers to believe that stock markets are increasingly sensitive to short-term earnings that undershoot analysts' expectations or to volatility in earnings generally. As we'll show, events like these are not driven by the earnings announcement itself, but by other information that accompanies the earnings. Furthermore, investors are not much concerned by earnings volatility and offer no rewards for predictable earnings or earnings guidance.
Earnings Volatility Doesn't Matter
Some managers believe investors will pay a premium for steady earnings growth. Indeed, executives regularly cite stabilizing earnings growth as a reason for strategic actions. For example, the CEO of Conoco justified a pending merger with Phillips Petroleum in part by asserting that the merger would offer greater earnings stability over the commodity price cycle.19
In contrast, academic research finds that earnings variability has either limited or no impact on market value and shareholder returns. Ratios of market value to capital certainly are diminished by cash flow volatility, but not by earnings volatility. Investors see through earnings smoothing that is unconnected to cash flow.20 In 30 years of U.S. profit data, there is no correlation between variability in EPS and a company's market value.21 Some researchers find a statistically significant, but practically negligible, relationship between the two: between the 1 percent of companies with the lowest earnings volatility and the 1 percent with the highest lies a difference in market-to-book ratios of less than 10 percent.22
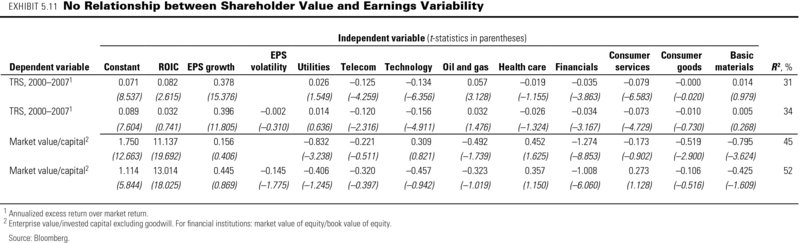
For a sample representing the largest 1,500 European companies between 2000 and 2007, we also found that variability in earnings growth rates had no meaningful effect on shareholder returns or value.23 As shown in Exhibit 5.11, a company's earnings variability was unrelated to its total returns to shareholders (TRS) and its ratio of market value to capital, after controlling for differences in underlying performance (that is, earnings growth and ROIC) and industry sector. Long-term earnings growth, ROIC, and industry sector together explained 34 percent of TRS for the entire sample over a five-year period, while earnings variability did not explain TRS to any significant degree.
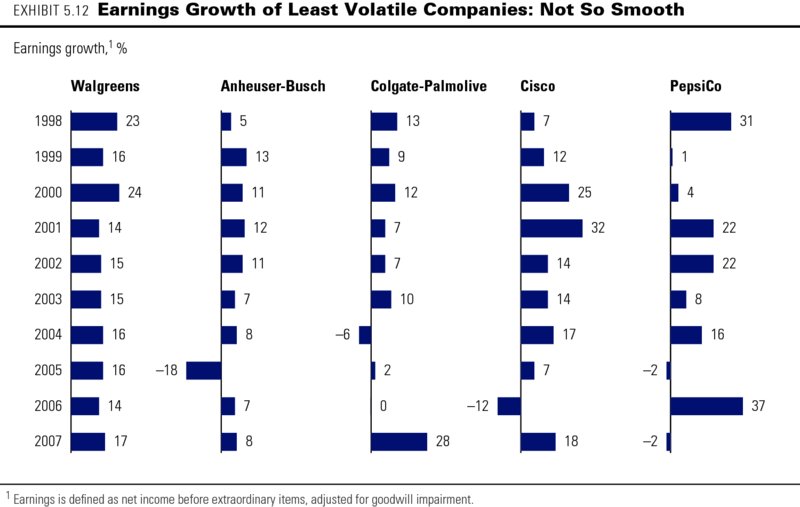
Part of the explanation for the results is that smooth earnings growth is a myth. Almost no companies demonstrate smooth earnings growth. Exhibit 5.12 shows five firms among the 10 percent of 500 large companies that had the least volatile earnings growth from 1998 to 2007.24 Of the companies we examined, Walgreens was the only one with seven years of steady earnings growth. Only a handful had earnings growth that was steady for four or more years. Most companies with relatively stable earnings growth follow a pattern similar to the four companies other than Walgreens in Exhibit 5.12: several years of steady growth interrupted by a sudden decline in earnings. For 460 of the companies, earnings fell in at least one year of the period studied.
Meeting Consensus Earnings Estimates Doesn't Matter
When a high-profile company misses an earnings target, it certainly makes headlines, but the impact of short-term earnings on share prices should not be overstated. For example, empirical research has shown that earnings surprises explain less than 2 percent of share price volatility in the four weeks surrounding the announcements.25 Investors place far more importance on a company's economic fundamentals than on reported earnings. Sometimes, however, short-term earnings are the only data investors have on which to base their judgment of fundamental corporate performance. In these cases, investors may interpret a missed EPS target as an omen of a decline in long-term performance and management credibility, so they lower the company's share price accordingly. As we describe in more detail in Chapter 30, the announcement of lower-than-expected earnings only drives share prices down in case of downward revisions of long-term fundamental prospects.
Similarly, share prices do not rise if the market believes a positive earnings surprise is simply the result of some imaginative accounting, such as deliberate timing of book gains from asset divestments or acceleration of sales from deep discounts to customers. For such accruals-dependent earnings increases, subsequent shareholder returns are poor, relative to peers.26 And investors are wise to be wary when accruals contribute substantially to earnings, because this typically indicates that a company has reached a turning point and will post lower earnings in the future.
Earnings Guidance
Many companies believe that providing guidance on their expected earnings for the upcoming quarter or year can lead to higher valuations, lower share price volatility, and greater market liquidity for their shares at what they perceive to be limited costs. Unfortunately, there is no evidence that guidance provides any of these benefits. There is also reason to believe that the costs are substantial. As we discuss in Chapter 30, we find that whether companies issue guidance or not does not affect their earnings multiples, returns to shareholders, or share price volatility. The impact of guidance on a stock's liquidity, if any, typically disappears in the following year, making it practically irrelevant from a shareholder's perspective.27
However, earnings guidance could lead to significant but hidden costs. Companies at risk of missing their own forecasts could be tempted to artificially improve their short-term earnings. As described previously, that is not likely to convince the market and could come at the expense of long-term value creation. When providing earnings guidance at all, companies are therefore better off if they present ranges rather than point estimates and if they present these for underlying operational performance (for example, targets for volume and revenue, operating margins, and initiatives to reduce costs) rather than for earnings per share.
Diversification and the Conglomerate Discount
Diversification is still a hotly debated topic, as we discuss in Chapter 17. Yet the myths around diversification are contradictory. One day an executive will argue that diversification creates value by smoothing a company's performance. The next day another will complain about a conglomerate discount. Neither is right.
Diversification is intrinsically neither good nor bad; it all depends on whether the parent company is the best owner for the businesses in its portfolio. But some executives believe that diversification brings benefits of its own, such as more stable aggregate cash flows, tax benefits from higher debt capacity, and better timing of investments across business cycles. However, as we discuss in Chapter 25, there is no evidence of such advantages in developed economies. Yet the costs of diversification can be very real: the business units of diversified companies often underperform their focused peers, because of added complexity and bureaucracy.
A widespread misunderstanding about spin-offs and other forms of divestment is that they are effective instruments to unlock so-called conglomerate discounts. Share price reactions to divestment announcements are typically positive, and many executives interpret this as evidence that such transactions are an easy solution to low valuations.
Key to the misunderstanding is typically a misleading sum-of-the-parts calculation. Analysts estimate the value of each of a company's businesses based on the earnings multiples of each business's industry peers. If the value of the sum of the businesses exceeds the company's current market value, the analysts assume the market value includes a conglomerate discount. However, as we discuss in Chapter 17, the analyses are often based on industry peers that are not actually comparable in terms of performance or sector. When the analysis uses true industry peers, the conglomerate discount typically disappears.
Positive share price reactions to divestment announcements therefore do not represent any correction of undervaluation or oversight by investors. The reactions simply reflect investor expectations that performance will improve at both the parent company and the divested business once each has the freedom to change its strategies, people, and organization. As a large body of empirical evidence shows, investors are right in anticipating performance step-ups.28 For example, we found that for 85 major spin-offs since 1992, both the divested businesses and the parent companies delivered significant improvements in operating profit margins over five years following the transaction (see Chapter 28).
Size and Value
Many executives are tempted by the illusion that the absolute size or scale of a company brings benefits—in the form of higher share prices in the stock market or higher ROIC and growth in the businesses. Academics and practitioners have claimed that larger companies are in higher demand by investors because they get more coverage from equity analysts and media. Or they say the cost of capital is lower because large companies are less risky and their stocks more liquid. Higher demand and lower cost of capital should lead to higher valuation in the market.
However, there is no evidence that size matters once companies have reached a certain size. The cutoff point probably lies in the range of a market capitalization of $250 million to $500 million.29 Only below that range is there some indication of higher cost of capital, for example. Whether a company has a market capitalization of $1 billion, $5 billion, or more does not matter for its relative valuation in the market.
The same holds for any positive effect of a company's size on its ROIC and growth. In most businesses, economies of scale make a difference only up to a certain size of the business. Large (and medium-sized) companies have typically already extracted maximum benefits from such economies of scale. For example, it is tempting to believe that package-delivery companies such as FedEx or UPS can easily process more packages at limited additional costs (the planes and trucks are already in place). But the networks of these companies are finely tuned and optimized for minimum unused capacity. Increasing volume by 10 percent might in fact require 10 percent more planes and trucks.
For most companies, increases in size alone no longer automatically bring further improvements in performance but just generate more complexity. Growth often means adding more business units and expanding geographically, which lengthen the chain of command and involve more people in every decision. Smaller, nimbler companies can well end up with lower costs. Whether size helps or hurts, whether it creates scale economies or diseconomies, depends on the unique circumstances of each company.
Market Mechanics Don't Matter
Conventional wisdom has long held that companies can capture benefits for their shareholders without any improvements to underlying cash flows by listing their stock in multiple markets, splitting their stocks, having more analyst coverage, being included in a key market index, or providing earnings guidance. True, a company from an emerging market in Asia securing a U.S. listing or a little-known European company joining a leading global stock index might secure some appreciable uplift. But well-functioning capital markets are entirely focused on the fundamentals of cash flow and revenue growth.
Index Membership
Becoming a member of leading stock market indexes such as the S&P 500 or FTSE 100 appeals to managers because many large institutional investors track these indexes. Managers believe that when institutional investors rebalance their portfolios to reflect the change of index membership, demand will shift dramatically—along with the share price. Anecdotal evidence appears to confirm this view. In 2001, Nortel, Shell, Unilever, and four other companies based outside the United States were removed from the S&P 500 index and replaced by the same number of U.S. corporations. The departing companies lost, on average, nearly 7.5 percent of their value in the three days after the announcement. The stock prices of the new entrants—including eBay, Goldman Sachs, and UPS—increased by more than 3 percent in the same period.
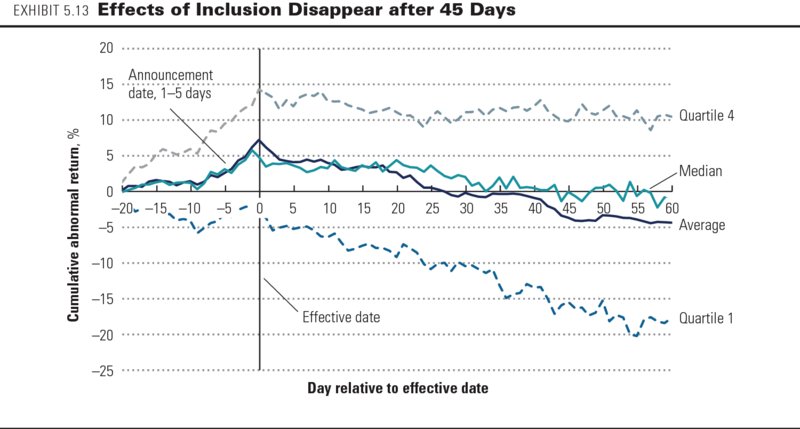
But empirical evidence shows that such changes are typically short-lived. On average, share prices of companies excluded from a major stock index do indeed decrease after the announcement. But this fall is fully reversed within one or two months.30 Surprisingly, the evidence on the impact of index inclusions appears less conclusive; several publications report that price increases occurring immediately after an inclusion are only partly reversed over time.31 We analyzed the effect on share price of 103 inclusions and 41 exclusions from the S&P 500 between December 1999 and March 2004.32 As Exhibit 5.13 shows, new entrants to the index experienced only a short-lived increase in share price: statistically significant positive returns disappeared after only 20 days, and all effects largely disappeared after 45 days. As investors adjust their portfolios to changes in the index, share prices of new entrants initially increase but then revert to normal once portfolios are rebalanced. For 41 companies ejected from the S&P 500 over the same period, we found similar patterns of temporary price change. The pressure on their prices following exclusion from the index lifted after two to three weeks.
Cross-Listing
For years, many academics, executives, and analysts believed companies cross-listing their shares on exchanges in the United States, London, and Tokyo could realize a higher share price and a lower cost of capital.33 Cross-listed shares would benefit from more analyst coverage, a broader shareholder base, improved liquidity, higher governance standards, and better access to capital.
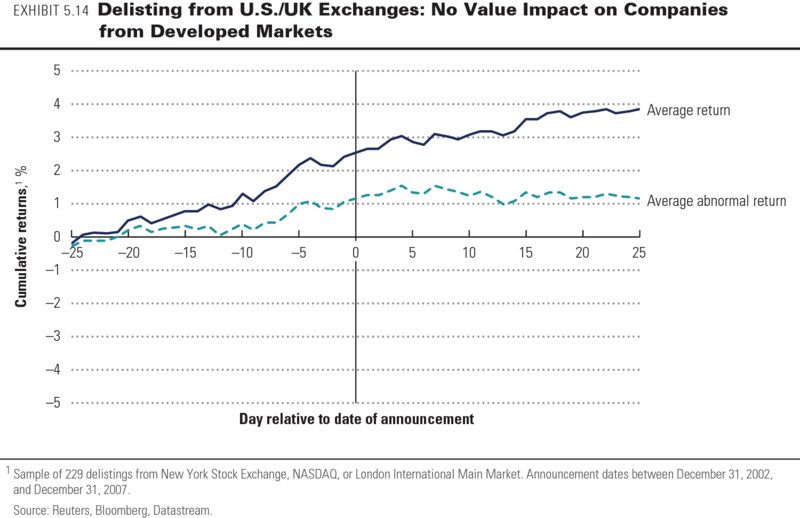
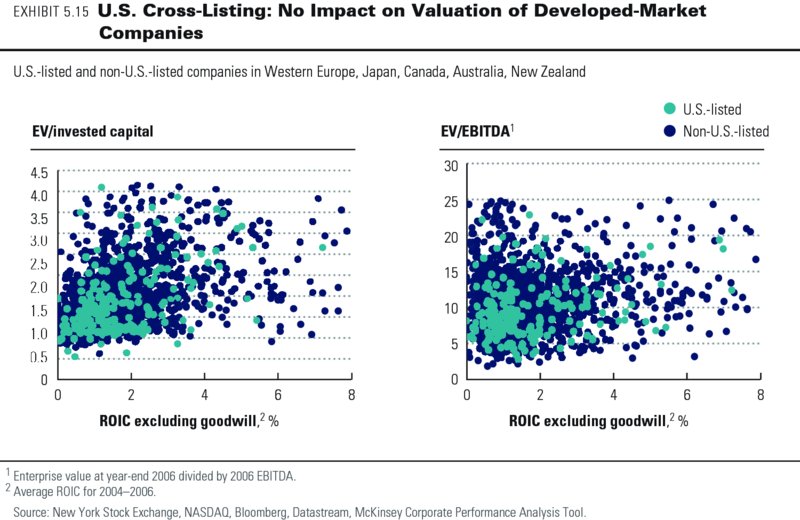
But our analysis does not find any significant impact on shareholder value from cross-listings for companies in the developed markets of North America, Western Europe, Japan, and Australia.34 We found no decline in share price when companies announced a delisting from U.S. and UK stock exchanges (see Exhibit 5.14).35 In fact, most announcements in our sample produced hardly any reaction from analysts and investors. Neither did we find any valuation premium for companies with cross-listings in New York or London relative to companies without any cross-listing, once we corrected for differences in return on invested capital (see Exhibit 5.15).
In fact, we did not find evidence for any of the deemed benefits from cross-listings. After correcting for size, cross-listed European companies have only marginally more analyst coverage than those not cross-listed.36 Institutional investors from the United States do not require the foreign companies in which they want to invest to be listed in the United States.37 There is no impact on liquidity, as cross-listed shares of European companies in the United States—American depositary receipts (ADRs)—typically account for less than 3 percent of these companies' total trading volumes. Corporate governance standards across the developed world have converged with those in the United States and the United Kingdom. There is hardly any benefit from better access to capital, given that three-quarters of the U.S. cross-listings of companies from the European Union have never involved raising any new capital in the United States.38
For companies from the emerging world, however, the story might be different. These companies might benefit from access to new equity and more stringent corporate governance requirements through cross-listings in U.S. or UK equity markets.39
Stock Splits
In the United States alone, each year hundreds of companies increase their number of shares through a stock split to bring a company's share price back into the “optimal trading range.”40 But fundamentally, stock splits can't create value, because the size of the pie available to shareholders does not change. For example, after a two-for-one stock split, a shareholder who owned two shares worth $5 apiece ends up with four shares, each worth $2.50. But some managers and academics claim that the lower price should make the stock more attractive for capital-constrained investors, thereby increasing demand, improving liquidity, and leading to higher returns for shareholders.41
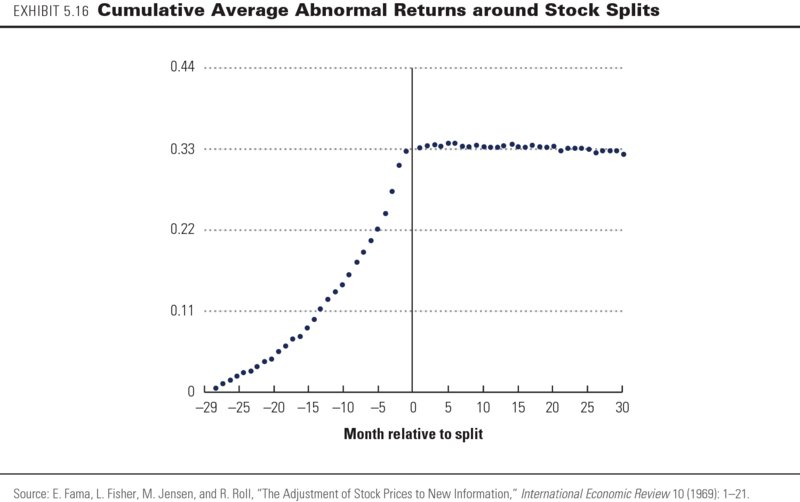
In many cases, a stock split is indeed accompanied by positive abnormal returns to shareholders (see Exhibit 5.16).42 The abnormal returns have nothing to do with the split as such but are simply a function of self-selection and signaling. Self-selection is the tendency of companies to split their stocks into lower denominations because of a prolonged rise in their share price, as shown in Exhibit 5.16. As a result, one should expect any sample of companies that have split their stocks to show positive abnormal returns in the months preceding the split announcement, which is usually one to two months before the effective split date.43
When managers announce a stock split, they are also signaling that they expect further improvement in economic fundamentals. The abnormal return is statistically significant for the three days around the date of the stock split announcement, at about 3 percent. Indeed, two-thirds of companies reported higher-than-expected earnings and dividends in the year following a stock split. When performance improvements actually occurred after the split, the stock market did not react, indicating that investors had already factored them into their decisions at the time of the stock split announcement.44 Consistent with this pattern, companies that did not improve performance as expected in the year after a stock split saw their share prices fall.45
Value Creation Is More Important than Value Distribution
Another common misconception by executives is that share repurchases and dividends create value for shareholders. This view is often reinforced by both private and public demands from investors for companies to return more cash to shareholders, particularly as share repurchases. If you dig deeper into understanding investor demands, though, you will typically find that investors want more cash distributed, not because the cash distribution itself creates value, but because investors are concerned that companies will squander excess cash and debt capacity on value-destroying investments. They view cash distributions as way to impose discipline on the company's use of its cash.46 We discuss cash distributions extensively in Chapter 29.
In addition, counting cash distributions as value-creating would be double-counting. Companies create value when they generate cash flows. Distributing those cash flows to shareholders cannot create additional value. That would be similar to violating principles like the conservation of matter in physics.
So why do companies' share prices often increase on the announcement of share repurchases or dividend increases? In some cases, investors interpret dividend increases as a sign that management is confident enough about future cash flow generation to commit to a higher dividend level. That causes investors to reassess their view of future profits and cash flow generation. Often, though, as we have just noted, investors are relieved that management is less likely to squander cash on value-destroying investments, so investors again reassess their view of future cash flows. If these expectations are not met, the companies' share prices will decline later.
Another argument for share repurchases is that they increase a company's earnings per share. At a constant P/E, a higher EPS would lead to a higher share price. But P/Es do not remain constant. Share repurchases either increase a company's debt or reduce its cash. In either case, the math of finance leads to a decline in a company's P/E. Consider the case of Apple, with around $25 billion of cash by mid-2014. That cash is low risk and low return, so it has a high P/E (higher than for Apple's operating assets). Paying out that cash would reduce the proportion of high-P/E assets relative to lower-P/E assets, reducing the overall (weighted average) P/E for Apple as a whole.
Dividends and share repurchases are merely instruments for distributing cash that is generated by the company's operations. Furthermore, as we will discuss in Chapter 29, decisions about cash distributions should not drive a company's investment decisions; they should be a residual after a company has determined its strategy, its investment opportunities, and its desired level of risk.
Summary
Dramatic swings in share prices over the last two decades have led some finance practitioners to suggest that long-held valuation theories have become irrelevant and that stock markets lead lives of their own, detached from the realities of economic growth and business profitability. We disagree. There is compelling evidence that valuation levels for individual companies and the stock market as a whole clearly reflect the underlying fundamental performance in terms of return on capital and growth. Yes, there are times when valuations deviate from fundamentals, but these typically do not last long. Evidence also shows that some widespread beliefs espoused by managers and finance professionals are inconsistent with the fundamental principles of valuation, and are erroneous.
We also find that executives are often overly focused on earnings and earnings growth. Earnings don't drive value in their own right; only cash flows do. Companies with attractive growth and returns on invested capital will also generate good earnings. The market sees through earnings that aren't backed up by solid fundaments, such as earnings increases from mergers and acquisitions (M&A) that don't earn adequate returns on capital. Managers should also not be concerned about noneconomic events that reduce earnings, such as asset write-downs or the effects of changes in accounting rules. Nor should they be concerned about delivering smooth earnings or meeting short-term analyst consensus earnings forecasts.
Finally, myriad myths have grown up about how the market values companies that have nothing to do with the company's economic performance. None stand up to scrutiny. There is no value premium from diversification, from cross-listing, or from size for size's sake. Conversely, there is no conglomerate discount, only a performance discount for many diversified companies. Dividends and share repurchases don't create value, but markets react positively when management signals it will be disciplined about future investments.
Review Questions
- Explain how long-term price-to-earnings (P/E) ratios in the U.S. stock market of around 15 times are consistent with long-term expected stock returns of around 6 to 7 percent a year in real terms.
- Many corporate executives focus on earnings per share (EPS) and attempt to manage reported earnings in order to meet analysts' expectations. Can managers succeed in protecting the stock price of their company by managing these accounts? Why or why not?
- If a company's value is not driven by its short-term earnings, why do investors spend so much time analyzing a company's annual or even quarterly earnings announcements?
- Empirical research shows that goodwill impairments have no impact on a company's share price. But these impairments do reflect an auditor's best estimate of the value lost in an acquisition by the company. Does the stock market not care about such losses? Explain.
- In inflationary periods for input prices, what happens to earnings when firms change from first-in first-out (FIFO) to last-in first-out (LIFO) inventory accounting? How does the market react? Why is this the case?
- As a rule, cross-listings for companies with a home listing in a mature capital market do not offer material benefits. Discuss how and why this might be different for companies based in emerging capital markets.
- Over the past five years, the highest share price for HighTechCo, a 15-year-old software company, was around $650, and its lowest price was around $150. BrandCo, a consumer products firm with a 70-year history, had share prices ranging from $85 down to $40 over the same period. Do such wide ranges mean that the stock market is reflecting emotions more than fundamentals? Explain.
- Why is it much riskier to take a short position in a stock than a long position? What does that mean for the likelihood of overvaluation versus undervaluation of a company's share price?
- Why do executives spend so much time and effort on communicating with noise traders if intrinsic investors ultimately drive a company's share price?
- Would a company's share price benefit from having fewer traders and more fundamental investors among the company's shareholders? Why or why not?
- Why do noise traders have limited impact on a company's share price even when they make the largest volume of trades in the company's stock over a given time period?
- Certain agencies often categorize company shares as growth stocks or value stocks. What is the difference between growth and value stocks? Why are these labels misleading?
- What do executives believe are the benefits of issuing EPS guidance? Do companies actually realize these benefits?
- Some firms chose not to expense employee stock options until accounting rules required all firms to do so, while other firms chose to expense options even before being required to do so. What was the impact on financials for firms that chose to expense options? What was the impact on their share prices?