18
Taxes
In Chapter 9, the company's income statement and balance sheet are reorganized into operating items, nonoperating items, and financing items. Using the reorganized financial statements, we build return on invested capital (ROIC) and free cash flow (FCF), which in turn drive the company's valuation. One complex line item that typically combines all three categories (operating, nonoperating, and financing items) is taxes. Unfortunately, company disclosures rarely provide all the information required to build the operating taxes necessary to project free cash flow. However, you can reverse engineer operating taxes by combining assumptions about marginal tax rates with a clever analysis of the company's tax reconciliation tables.
Once you have computed operating taxes, we recommend converting them from an accrual basis to a cash basis for valuation, because accrual taxes typically do not reflect the cash taxes actually paid. For instance, growing companies with fixed assets tend to pay lower cash taxes than those reported on the income statement, since the government allows accelerated depreciation on new fixed assets. To convert operating taxes to operating cash taxes, adjust operating taxes by the increase in operating deferred-tax liabilities (net of operating tax assets). To ensure that operating cash taxes are independent of nonoperating items, such as taxes related to unfunded pensions, you need to separate deferred taxes into operating and nonoperating categories. Again, company disclosures do not easily lend themselves to determining operating-related deferred-tax assets and liabilities.
Any deferred taxes you classify as operating will flow through cash taxes, net operating profit less adjusted taxes (NOPLAT), and consequently free cash flow (FCF). Deferred taxes classified as nonoperating will not be included in an FCF valuation and therefore must be valued along with their corresponding accounts (as in the case of pensions), valued separately (as in the case of net operating loss carryforwards), or ignored as accounting conventions (as in the case of nondeductible amortization). Regardless of methodology, do not assume that the value of these items equals their book value. Deferred-tax accounts represent past differences between investor and government accounting and not an estimation of the value of future cash flows.
This chapter goes through the steps of estimating operating taxes, converting operating taxes to operating cash taxes, and incorporating deferred taxes into a corporate valuation. We start with the calculation of operating taxes.
Operating Taxes on the Reorganized Income Statement
To determine operating taxes, it is necessary to remove the effects of nonoperating and financing items from reported taxes. This can be challenging because of the complexity of tax accounting and the need for data that companies do not typically disclose. We'll introduce a hypothetical company to show several ways to estimate operating taxes, as the best approach may not be possible when you have only the information typically found in an annual report.
Exhibit 18.1 presents the internal financial statements of a global company for a single year. The company generated $2,000 million in domestic earnings before interest, taxes, and amortization (EBITA) and $500 million in EBITA from foreign operations. The company amortizes intangible assets held domestically at $400 million per year. Thus, domestic earnings before interest and taxes (EBIT) are $1,600 million. The company holds debt locally and deducts interest ($600 million) on its domestic statements. It recently sold an asset held in a foreign market and recorded a gain of $50 million. The company pays a statutory (domestic) tax rate of 35 percent on earnings before taxes, but only 20 percent on foreign operations.
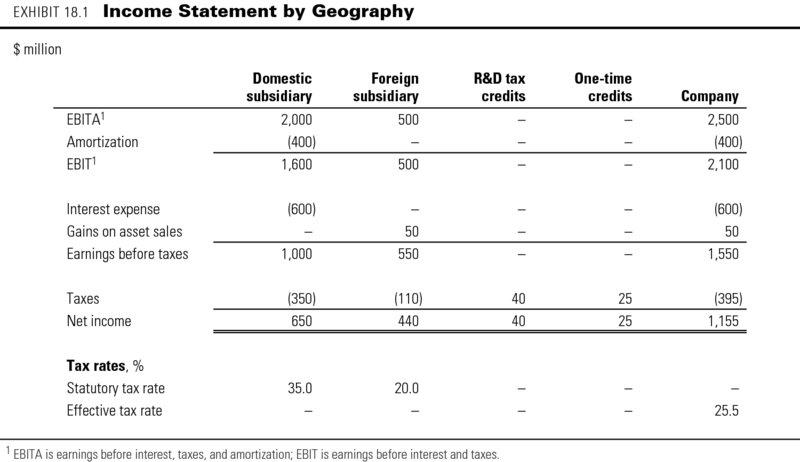
The company generates $40 million in ongoing research and development (R&D) tax credits (credits determined by the amount and location of the company's R&D activities), which are expected to grow as the company grows. It also has $25 million in one-time tax credits, in this case a tax rebate related to historical tax disputes. All told, the company pays an effective tax rate on pretax profits of 25.5 percent, well below its statutory domestic rate of 35 percent.1
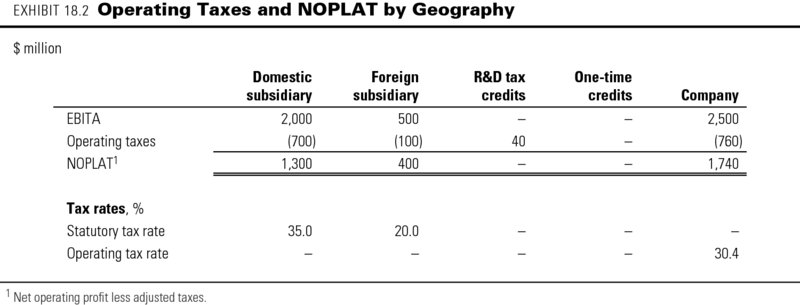
Operating taxes are computed as if the company were financed entirely with equity. Exhibit 18.2 calculates operating taxes and NOPLAT for our hypothetical company. To compute operating taxes, apply the local marginal tax rate to each jurisdiction's EBITA, before any financing or nonoperating items.2 In this case, apply 35 percent to domestic EBITA of $2,000 million and 20 percent to $500 million in foreign EBITA. Since research and development (R&D) tax credits are related to operations and expected to grow with revenue, they are included in operating taxes as well. The corporation as a whole pays $760 million in operating taxes on EBITA of $2,500 million, resulting in an operating tax rate of 30.4 percent. Note how the operating tax rate does not equal either the statutory tax rate (35 percent) or the effective tax rate from Exhibit 18.1 (25.5 percent).
Computing Operating Taxes Using Public Statements
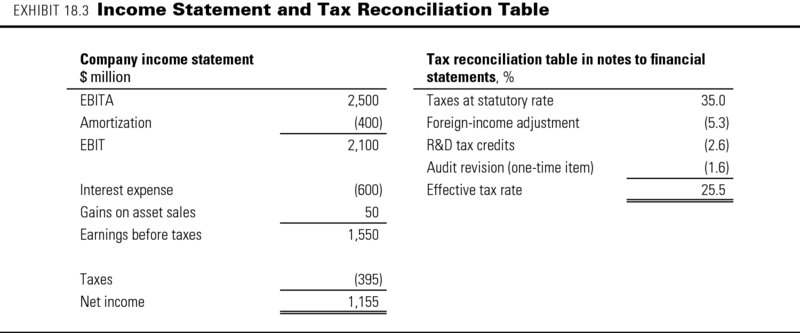
In practice, companies do not give a full breakout of the income statement by geography, but provide only the corporate income statement and a tax reconciliation table. Exhibit 18.3 presents the income statement and tax reconciliation table for our hypothetical company. The income statement matches the company-wide income statement in Exhibit 18.1. The tax reconciliation table, which is found in the notes of the annual report, reconciles the taxes reported on the income statement with the taxes that would be paid at the company's domestic statutory rate. For instance, the company paid 5.3 percent ($82.5 million) less in taxes than under the statutory rate of 35 percent because foreign geographies were taxed at only 20 percent.3 The tax table plays a critical role in determining operating taxes.
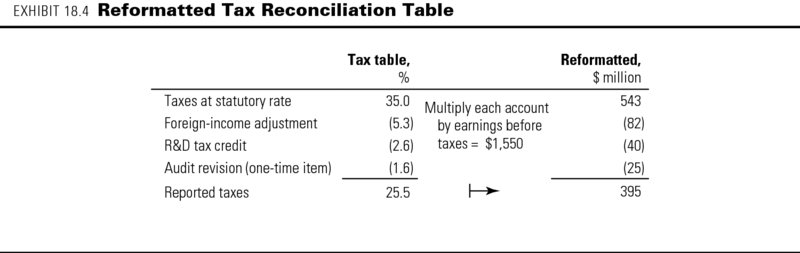
The most comprehensive method for computing operating taxes from public data is to begin with reported taxes and undo financing and nonoperating items one by one. In most cases, start by converting the tax reconciliation table from percentages to millions of dollars.4 To do this, multiply each reported percentage on the tax reconciliation table by “earnings before taxes” found on the income statement. Exhibit 18.4 presents the results when we apply this conversion to a reported tax reconciliation table.5
Next, use the dollar-based tax reconciliation table to eliminate one-time and nonoperating taxes from reported taxes. One-time items are excluded for valuation purposes because they have no effect on future tax obligations. Value nonoperating items separately or in conjunction with the corresponding nonoperating asset or liability. Determining what constitutes a one-time or nonoperating tax requires judgment.6 Our hypothetical company recently concluded a tax audit with the government for past overpayments. Since the tax credit is not expected to recur, we deem it nonoperating. In Exhibit 18.5, reported taxes of $395 million are adjusted by $25 million to remove the effect of the audit revision. Reported taxes related to operations equal $420 million.
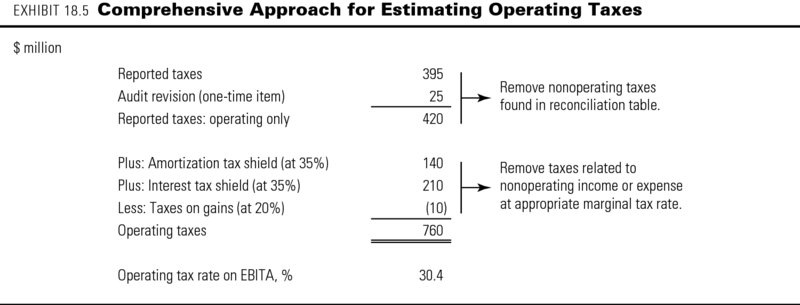
In the final step, adjust reported taxes for each nonoperating item the company reports on its income statement between EBITA and earnings before taxes. In our hypothetical company, the three nonoperating items between EBITA and earnings before taxes are amortization, interest expense, and gains on an asset sale. Since intangibles and debt are held domestically, the amortization tax shield and interest tax shield are computed at 35 percent of the corresponding line item. For instance, the interest tax shield equals $210 million ($600 million × 0.35). Subtract any incremental taxes on nonoperating gains (add taxes related to losses), again at the appropriate marginal tax rate.7 By applying these adjustments to reported operating taxes in Exhibit 18.4, we arrive at an operating tax of $760 million, which matches the operating taxes found in Exhibit 18.2.
This is the most accurate method for computing operating taxes. However, it relies on properly matching each nonoperating item with the appropriate marginal tax rate—a difficult achievement in practice. In some cases, the annual report will provide pretax and posttax nonoperating charges. For instance, in its 2013 10-K, Sierra Wireless reported a gross gain on the sale of its AirCard business of $94 million and a gain net of taxes equal to $70 million, implying that the company was taxed $24 million on the transaction. Since gains are excluded from operating profit, taxes on gains must be removed from reported taxes.
In most cases, however, companies will not explicitly report marginal taxes related to nonoperating items. It therefore becomes necessary to assume the marginal rate for each nonoperating item. We discuss this next.
Computing Operating Taxes: Dealing with Incomplete Data
If marginal tax rates on nonoperating items are not reported (as is usually the case), you will have to make an assumption about the tax jurisdiction in which nonoperating items are held. If you believe the company incurs interest expense and other nonoperating items domestically (typical for companies in countries with high tax rates), multiply the domestic statutory tax rate by EBITA, and then adjust for other operating taxes. In Panel A of Exhibit 18.6, the domestic statutory rate (35 percent) is applied to EBITA ($2,500 million), resulting in statutory taxes on EBITA of $875 million. Using data from the converted tax reconciliation table computed in Exhibit 18.4, subtract the dollar-denominated foreign-income adjustment ($82 million) and the R&D tax credit ($40 million) from statutory taxes on EBITA ($875 million) to determine operating taxes.
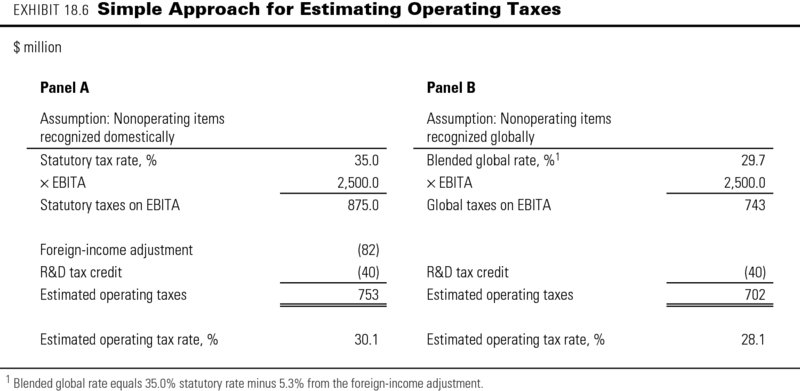
The estimate for operating taxes, $753 million, is close but not equal to the $760 million computed using the comprehensive method. The difference is explained by the gains on the asset sales of $50 million that were taxed at 20 percent, not at the statutory rate. Had gains on asset sales been taxed at 35 percent, the two methods would yield identical results.
If you believe the company reports interest expense and other nonoperating items in various geographies proportional to each geography's profits (typical for companies in countries with low tax rates), multiply a blended global rate by EBITA, and adjust for other operating taxes. In Panel B of Exhibit 18.6, a blended global rate of 29.7 percent is applied to $2,500 million in EBITA. The blended global rate is the statutory tax rate (35 percent) adjusted by the foreign-income adjustment (–5.3 percent) found in the company's tax reconcilia- tion table in Exhibit 18.3. Next, work through the reformatted tax reconciliation table for other operating taxes beyond the foreign-income adjustment. For our hypothetical company, subtracting $40 million in R&D tax credits from global taxes on EBITA of $743 million leads to an estimate of $703 million in operating taxes. Once again, estimated operating taxes are not quite equal to actual operating taxes. This is because the majority of nonoperating items actually are recognized domestically, in violation of the assumption that they were distributed across geographies in line with profits.
Be especially cautious when applying a global percentage (Panel B) instead of a dollar-based adjustment (Panel A) when earnings before taxes (EBT) are uncharacteristically small. In 2012, UPS recorded a large pension loss, causing EBT to fall dramatically.8 As a result, each account in the tax reconciliation table expanded dramatically in size. The foreign-income adjustment, which had been below 1.5 percent, grew to 6.1 percent, only to revert the following year to historical levels. Mistakenly lowering the operating tax rate by 6.1 percentage points in a 2012 forecast would have underestimated the company's likely tax burden, leading to an overestimate of value.
If these two methods lead to incorrect assessments of operating taxes, why use them? Because for most companies, the marginal tax rate on nonoperating items is not disclosed, making the comprehensive method presented in Exhibit 18.5 unusable. In our experience, you are likely to make fewer implementation errors using the simplified method based on an assumption about the provenance of nonoperating items than if you try to use the comprehensive method based on inadequate information. In Chapter 9, we estimated UPS's operating tax rate using the simple approach presented in Panel A of Exhibit 18.6.
Erroneous Alternatives for Computing Operating Taxes
Two alternatives that are incorrect yet common in practice are to use either the company's statutory tax rate or the company's effective rate with no adjustments. These shortcuts work for straightforward companies that operate only domestically, but in most other cases they lead to volatile, incorrect estimates of operating taxes.
Computing operating taxes as operating profit multiplied by the company's statutory tax rate typically leads to an upward-biased estimate of operating taxes for U.S.-based companies, because it fails to recognize that foreign earnings are typically taxed at lower levels. For example, the operating tax rate at Hasbro, a toy company with extensive foreign earnings, is consistently below 30 percent, even though the company's statutory rate hovers near 37.5 percent (federal rates plus state rates). In fact, 73 percent of profitable Standard & Poor's (S&P) 500 companies had effective tax rates below the statutory tax rate of 35 percent in 2013.
Alternatively, applying the effective tax rate to operating profit handles foreign earnings properly but does not exclude one-time nonoperating items. This can lead also to incorrect and volatile estimates of operating taxes. For instance, in 2004, the U.S. Congress passed legislation allowing companies to repatriate foreign earnings at a small incremental tax if domestic investments were made. Many companies used this opportunity to repatriate significant earnings, leading to unusually high effective tax rates in 2005. Since this is a one-time tax, it should be evaluated separately and not as part of operating taxes.
Converting Operating Taxes to Operating Cash Taxes
In the previous section, we estimated accrual-based operating taxes. In actuality, many companies will never pay (or at least will significantly delay paying) accrual-based taxes. Consequently, for estimating taxes on EBITA, you should use a cash tax rate (one based on the operating taxes actually paid in cash to the government), rather than accrual-based taxes.
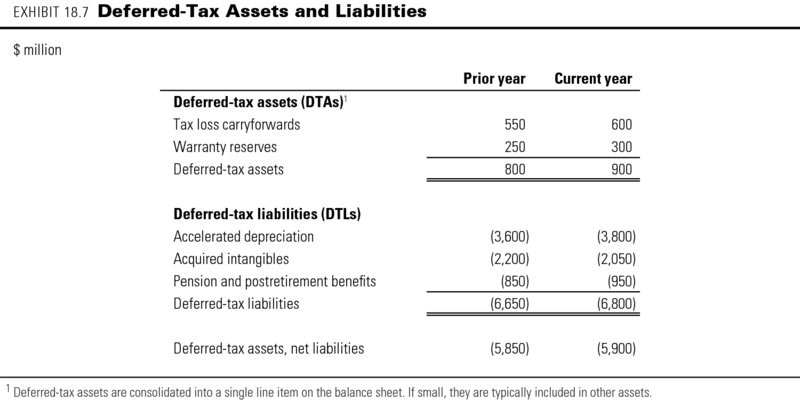
To convert operating taxes to operating cash taxes, subtract the increase (or add the decrease) in net operating deferred-tax liabilities from accrued operating taxes.9 The income tax footnote contains the information you need to estimate operating deferred-tax assets and liabilities. Exhibit 18.7 presents the footnote for deferred-tax assets (DTAs) and deferred-tax liabilities (DTLs) for our hypothetical company. The company has two operating-related deferred-tax accounts:
- Warranty reserves (a DTA): The company records an expense (and takes a tax deduction) for promised warranties when it sells the product. The government recognizes a deductible expense only when a product is repaired, so cash taxes tend to be higher than accrual taxes. With regard to warranty reserves, accrual-based taxes typically understate the actual cash taxes paid.
- Accelerated depreciation (a DTL): The company uses straight-line depreciation for its U.S. Generally Accepted Accounting Principles/International Financial Reporting Standards (GAAP/IFRS) reported statements and accelerated depreciation for its tax returns (because larger depreciation expenses lead to lower pretax income and hence smaller taxes). For a growing company, accelerated depreciation is typically larger than straight-line depreciation, so accrual-based taxes typically overstate the actual cash taxes paid.
In addition, the company has three nonoperating deferred-tax accounts:
- Tax loss carryforwards (a DTA): When a company loses money, it does not receive a cash reimbursement from the government (as negative taxes in the income statement would imply), but rather a credit toward future taxes. Given that past losses are typically unrelated to current profitability, they should not be included as operating. Since tax loss carryforwards are valuable, they must be valued separately.
- Acquired intangibles (a DTL): When a company buys another company, it recognizes intangible assets on its balance sheet for items such as patents and customer lists.10 Since these assets are amortized on the income statement but are not deductible for tax purposes, the company will record a DTL during the year of the acquisition and then draw down the DTL as the intangible amortizes. Since operating taxes (computed in Exhibit 18.5) already exclude the amortization tax benefit in calculating NOPLAT, no adjustment is required for deferrals related to these intangible assets. Instead, treat deferred taxes related to amortization of intangibles as nonoperating.
- Pension and postretirement benefits (a DTL): In the United States, the government provides tax relief only when cash contributions are made to pension plans. Thus, deferred taxes arise when reported pension expense differs from cash contributions. Since excess pension assets and underfunded pensions are treated as nonoperating, deferred taxes related to pensions also are nonoperating.
Exhibit 18.8 reorganizes the items in the note about deferred-tax assets and liabilities into operating and nonoperating items. Deferred-tax liabilities (such as those related to accelerated depreciation) are netted against deferred-tax assets (such as those related to warranties). This reorganization makes the components of operating taxes, the reorganized balance sheet, and ultimately the final valuation more transparent and less prone to error.
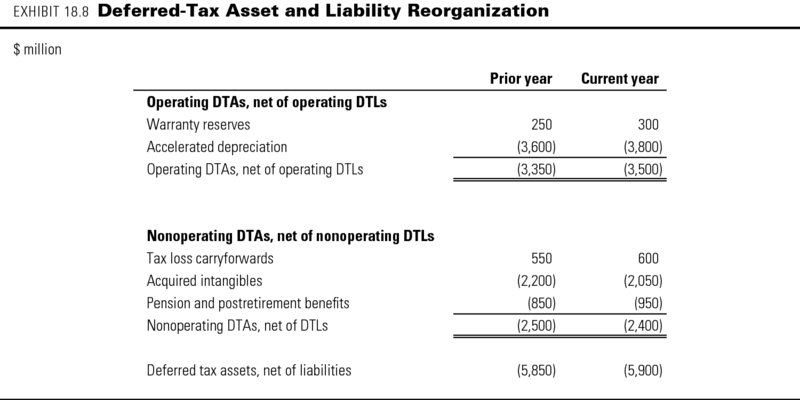
To convert accrual-based operating taxes into operating cash taxes, add the increase in operating DTAs, net of operating DTLs, to operating taxes. In most cases, DTLs will exceed DTAs, so this is equivalent to subtracting the increase in operating DTLs, net of operating DTAs. In Exhibit 18.8, net operating DTLs grow from $3,350 million to $3,500 million, an increase of $150 million. Subtracting the $150 million from operating taxes of $760 million (computed in Exhibit 18.5) gives $610 million of operating cash taxes:
| $ million | Current year |
| Operating taxes | 760 |
| Decrease (increase) in net operating DTLs | (150) |
| Operating cash taxes | 610 |
The operating cash tax rate equals operating cash taxes of $610 million divided by EBITA of $2,500 million (found in Exhibit 18.3), which equals 24.4 percent. Because of the operating deferrals, operating cash taxes are approximately 5 percent lower than operating taxes on an accrual basis. The operating cash tax rate can be applied to forecasts of EBITA when projecting future free cash flow.
Deferred Taxes on the Reorganized Balance Sheet
One critical component of a well-structured valuation model is a properly reorganized balance sheet. As outlined in Chapter 9, the accounting balance sheet is reorganized into invested capital, nonoperating items, and sources of financing. Since operating DTAs and DTLs flow through NOPLAT via cash taxes, they are considered equity equivalents. Why equity? When we convert accrual taxes to cash taxes, income is adjusted, and the difference becomes part of retained earnings, making it an equity equivalent.11
Exhibit 18.9 presents a reorganized balance sheet that includes the deferred-tax items for the current year from Exhibit 18.8. Equity equivalents, which are located in the equity section, include any accounts used to convert operating taxes to cash operating taxes, in this case, the accelerated depreciation DTL ($3,800 million) net of the warranty reserves DTA ($300 million). Since warranty reserves result in an operating DTA, they are treated as a negative equity equivalent (i.e., a reduction to retained earnings). With the exception of tax loss carryforwards and nondeductible intangibles, classify nonoperating deferred taxes (e.g., pension and postretirement benefits) as an equity equivalent. Since they do not flow through free cash flow, you will need to value them separately, which we discuss later in the chapter.
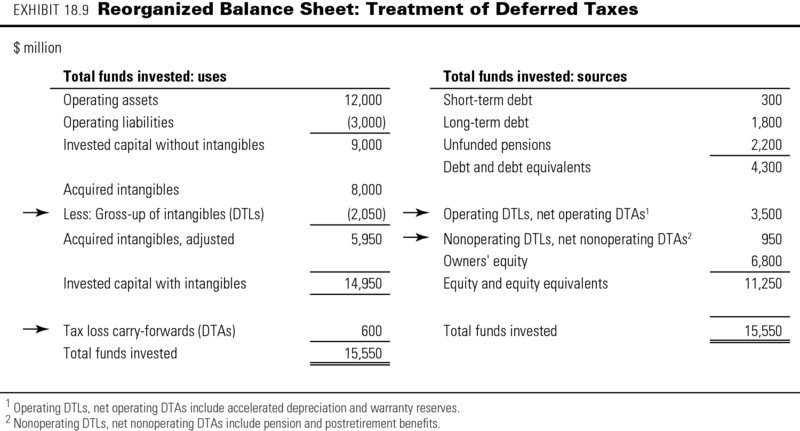
Two nonoperating deferred taxes will not be classified as equity equivalents: tax loss carryforwards and deferred taxes related to acquired intangibles. The DTA for tax loss carryforwards ($600 million) shows up as a nonoperating asset and should be valued separately. The deferred-tax liability related to the acquired intangibles ($2,050 million) is treated as an offset to the intangible asset itself, since the asset was grossed up for hypothetical taxes when the asset was created.
Why net deferred taxes for intangible assets against acquired intangibles? When a company buys another company, it typically recognizes intangible assets for intangibles that are separable and identifiable (such as patents). These intangible assets are amortized over their estimated life on the GAAP income statement, but since the amortization is not deductible in most countries for tax purposes, a mismatch will occur. To prepare for this mismatch, the company creates a deferred-tax liability when it makes the acquisition. To keep the balance sheet balanced, the company also increases intangible assets (known in accounting as “grossing up”) by the size of the new DTL. Since the grossed-up intangible and deferred-tax liability are purely accounting conventions and do not reflect cash transactions, they should be eliminated.
To apply this offset in Exhibit 18.9, we subtract the deferred-tax liability of $2,050 million from acquired intangibles of $8,000 million, resulting in adjusted intangibles of $5,950 million. By calculating taxes on EBITA and subtracting the DTL from acquired intangibles, we have essentially converted accrual taxes to the cash taxes actually paid.
Finding Deferred Taxes in the Annual Report
One practical difficulty with DTAs and DTLs is finding them. Sometimes they are explicitly listed on the balance sheet, but often they are embedded within other assets and other liabilities. Check the tax footnote for embedded items. For instance, in its 2013 annual report, Coca-Cola describes DTAs and DTLs as follows:
Noncurrent deferred tax assets of $328 million and $403 million were included in the line item other assets in our consolidated balance sheets as of December 31, 2013 and 2012, respectively. Current deferred tax assets of $211 million and $244 million were included in the line item prepaid expenses and other assets in our consolidated balance sheets as of December 31, 2013 and 2012, respectively. Current deferred tax liabilities of $339 million and $331 million were included in the line item accounts payable and accrued expenses in our consolidated balance sheets as of December 31, 2013 and 2012, respectively.
Valuing Deferred Taxes
As noted at the beginning of this chapter, deferred-tax assets and liabilities classified as operating will flow through NOPLAT and free cash flow via cash taxes, and therefore are not valued separately. The remaining nonoperating DTAs and DTLs are either valued as part of the corresponding nonoperating account (as for pensions and convertible bonds), valued separately (as for net operating loss carryforwards), or ignored as an accounting convention (as for intangible assets). For each deferred-tax account, there are four valuation methodologies:
- Value as part of NOPLAT and subsequently enterprise value. Any DTA or DTL used to convert operating taxes into cash operating taxes will flow through free cash flow and subsequently be valued as part of enterprise value. In our hypothetical example, DTAs related to warranties and DTLs related to accelerated depreciation are valued as part of free cash flow.
- Value in conjunction with a corresponding nonoperating asset or liability. The value of DTAs and DTLs related to pensions, convertible debt, and sale/leasebacks should be incorporated into the valuations of their respective accounts. How this is done depends on the nuances of the account. As an example, deferred taxes related to pensions arise when pension expense differs from the cash contribution. But the deferred-tax account recognized on the balance sheet reflects accumulated historical differences, not future tax savings. Therefore, to value the tax shield associated with unfunded pensions, multiply the current unfunded liability by the marginal tax rate (i.e., the expected tax savings attributable to funding the shortfall).12 Do not use the book value of the deferred-tax account.
- Value as a separate nonoperating asset. When a DTA such as a tax loss carryforward does not have a corresponding balance sheet account like pensions, it must be valued separately. To value tax loss carryforwards, project which years the future tax savings might be realized, and discount those cash flows at the unlevered cost of equity (the cost of debt is too conservative). Be careful to check with local tax experts, since the statutes governing tax loss carryforwards are complex. Also keep in mind that tax loss carryforwards are country specific. A company with tax loss carryforwards in one country cannot use the benefit against profits in another country.
- Ignore as an accounting convention. Some DTLs, such as the kind of non- deductible amortization described earlier in this chapter, arise because of accounting conventions and are not an actual cash liability. These items should be valued at zero.
Closing Thoughts
Accounting for taxes is complex and can be daunting to even the most seasoned professional. But given the number of companies whose operating tax rates consistently differ from both the statutory tax rate and the effective tax rate, a careful assessment of the operating tax rate is critical to an accurate valuation. If you are confused about a particular line item in the tax reconciliation table, always rely on the general principles of this book by asking two questions: First, is the item ongoing and related to core operations? Second, does the item materially change your perception of the company's performance or valuation? Finally, when converting from operating taxes to cash operating taxes, always assess whether the deferral rate is reasonable and can be continued. Perhaps an acquisition is causing a jump in a deferred-tax account, making the deferral rate uncharacteristically high. If so, use long-term trends to forecast future deferral rates.
Review Questions
- Exhibit 18.10 presents the tax reconciliation table for ToyCo, a $5 billion designer and distributor of children's toys. Convert the tax table from percentages to millions of dollars. Separate the converted tax table into three groups: taxes attributable to domestic income, other operating taxes, and nonoperating taxes. Treat “other, net” as nonoperating.
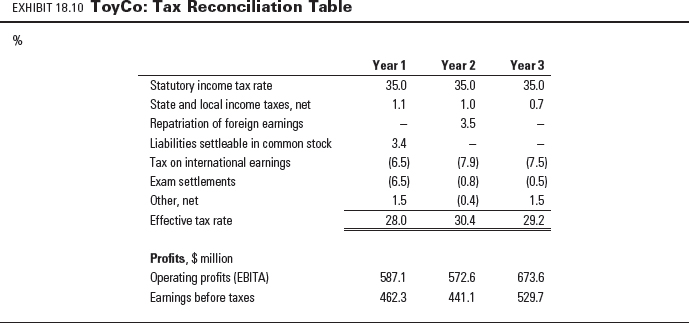
- Exhibit 18.6 presents two approaches for estimating operating taxes. Use both methods to determine the operating taxes for ToyCo in year 3. What are ToyCo's statutory rate, effective tax rate, and operating tax rate (under both approaches)?
- When a company incorporated in a country with a high tax rate does business in countries with lower tax rates, it will report an effective tax rate below its statutory rate. Is the difference sustainable into the future? What occurs if the company decides to repatriate earnings? How should operating taxes be computed in the year of repatriation? How is ROIC distorted by foreign taxation and repatriation?
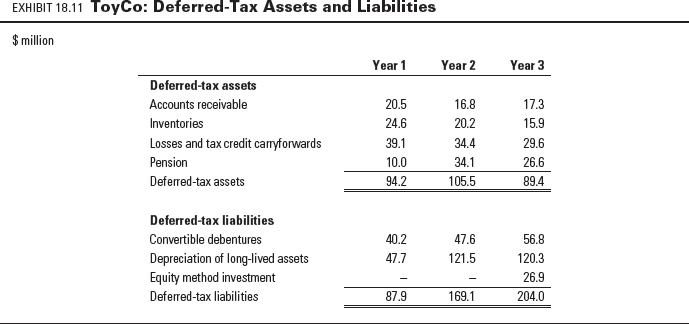
- Exhibit 18.11 presents deferred-tax assets and liabilities for ToyCo. Using Exhibit 18.8 as a guide, reorganize the deferred-tax table into two categories: net operating deferred-tax assets (net of operating deferred-tax liabilities), and net nonoperating deferred-tax assets (net of nonoperating deferred-tax liabilities). In year 3, ToyCo generated $200.7 million in operating taxes on $673.6 million of EBITA. Using this information, what are the cash taxes in year 3? What is the percent of operating taxes that were deferred, and what is the operating cash tax rate?
- ToyCo has working capital of $400 million, fixed assets equal to $800 million, and debt equal to $600 million. Use these data and the reorganized deferred taxes in Question 4 to create invested capital and total funds invested for year 3. Use equity as the plug to get total funds invested to reconcile.
- One of the most common deferred-tax liabilities occurs because of accelerated depreciation. When is the difference between reported taxes and cash taxes likely to be greatest? When will it be smallest? Can it reverse? That is, can cash taxes be higher than reported taxes?