33
Cyclical Companies
A cyclical company is one whose earnings demonstrate a repeating pattern of significant increases and decreases. The earnings of cyclical companies, including those in the steel, airline, paper, and chemical industries, fluctuate because the prices of their products change dramatically as demand for them varies and as the companies themselves at times create too much capacity. Volatile earnings within the cycle introduce additional complexity into the valuation of these cyclical companies. For example, historical performance must be assessed in the context of the cycle. A decline in recent performance does not necessarily indicate a long-term negative trend, but rather a shift to a different part of the cycle.
This chapter explores the valuation issues particular to cyclical companies. It starts with an examination of how the share prices of cyclical companies behave. This leads to a suggested approach for valuing these companies, as well as possible implications for managers.
Share Price Behavior
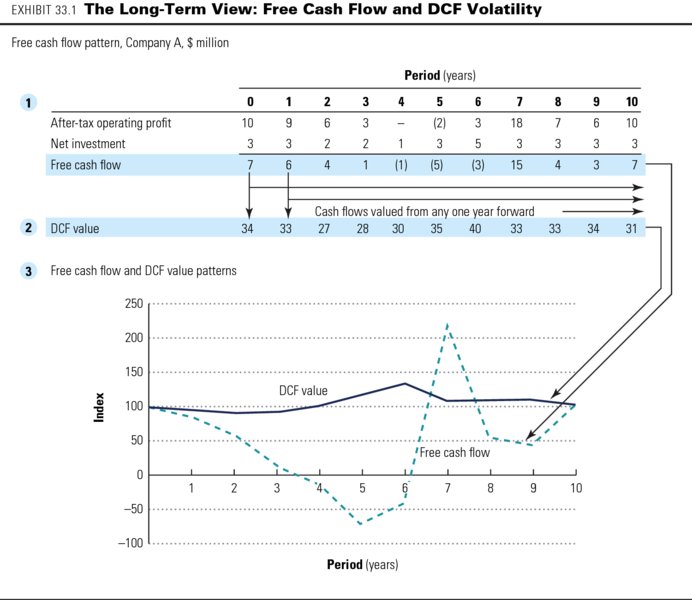
Suppose you were using the discounted-cash-flow (DCF) approach to value a cyclical company and had perfect foresight about the industry cycle. Would the company's value and earnings behave similarly? No. A succession of DCF values would exhibit much lower volatility than the earnings or cash flows. DCF reduces future expected cash flows to a single value. As a result, any single year is unimportant. For a cyclical company, the high cash flows cancel out the low cash flows. Only the long-term trend really matters.
To illustrate, the business cycle of Company A is 10 years. Exhibit 33.1, part 1, shows the company's hypothetical cash flow pattern. It is highly volatile, containing both positive and negative cash flows. Discounting the future free cash flows at 10 percent produces the succession of DCF values in part 2 of the exhibit. Part 3 compares the cash flows and the perfect foresight DCF values (the values are indexed for comparability). It shows that the DCF value is far less volatile than the underlying cash flow, because no single year's performance has a significant impact on the value of the company.
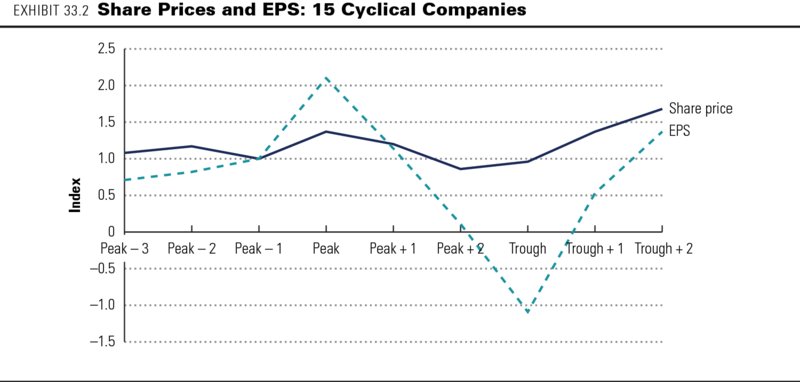
In the real world, the share prices of cyclical companies are less stable than the example in Exhibit 33.1. Exhibit 33.2 shows the earnings per share (EPS) and share prices, both indexed, for 15 companies with a four-year cycle. The share prices are more volatile than the DCF approach would predict—suggesting that market prices exhibit the bias of anchoring on current earnings.
How can this apparent anomaly be explained? We examined equity analysts' consensus earnings forecasts for cyclical companies to see if they would provide any clues to the volatile stock prices of these companies. What we found surprised us. Consensus earnings forecasts for cyclical companies appeared to ignore cyclicality entirely. The forecasts invariably showed an upward-sloping trend, whether the companies were at the peak or trough of the cycle.
What became apparent was not that the DCF model was inconsistent with the facts, but that the market's projections of earnings and cash flow (assuming the market followed the analysts' consensus) were to blame. This conclusion was based on an analysis of 36 U.S. cyclical companies during 1985 to 1997. We divided them into groups with similar cycles (e.g., three, four, or five years from peak to trough) and calculated scaled average earnings and earnings forecasts. We then compared actual earnings with consensus earnings forecasts over the cycle.1
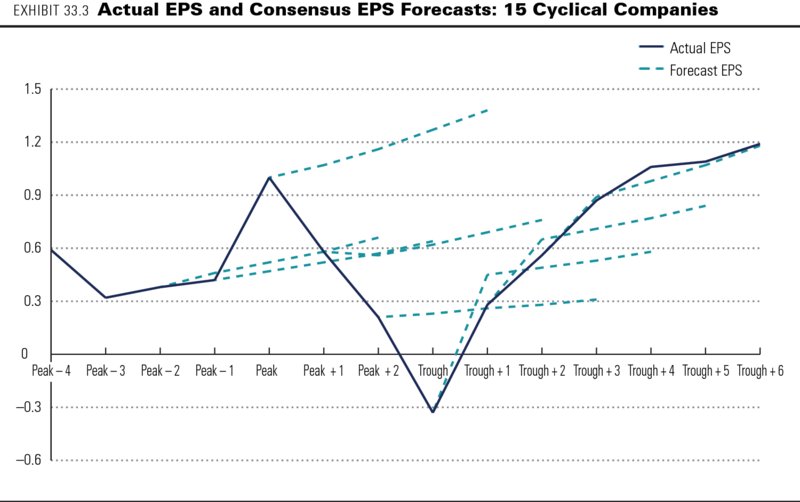
Exhibit 33.3 plots the actual earnings and consensus earnings forecasts for the set of 15 companies with four-year cycles in primary metals and manufacturing transportation equipment. The consensus forecasts do not predict the earnings cycle at all. In fact, except for the next-year forecasts in the years following the trough, the earnings per share are forecast to follow an upward-sloping path with no future variation.2
One explanation could be that equity analysts have incentives to avoid predicting the earnings cycle, particularly the down part. Academic research has shown that earnings forecasts have a positive bias that is sometimes attributed to the incentives facing equity analysts at investment banks.3 Pessimistic earnings forecasts may damage relations between an analyst's employer—an investment bank—and a particular company. In addition, companies that are the target of negative commentary might cut off an analyst's access to management. From this evidence, we could conclude that analysts as a group are unable or unwilling to predict the cycles for these companies. If the market followed analyst forecasts, that behavior could account for the high volatility of cyclical companies' share prices.
We know that it is difficult to predict cycles, particularly their inflection points. So it is not surprising that the market does not get it exactly right. However, we would be surprised if the stock market entirely missed the cycle, as the analysis of consensus forecasts suggests. To address this issue, we returned to the question of how the market should behave. Should it be able to predict the cycle and therefore exhibit little share price volatility? That would probably be asking too much. At any point, the company or industry could break out of its cycle and move to one that is higher or lower, as illustrated in Exhibit 33.4.
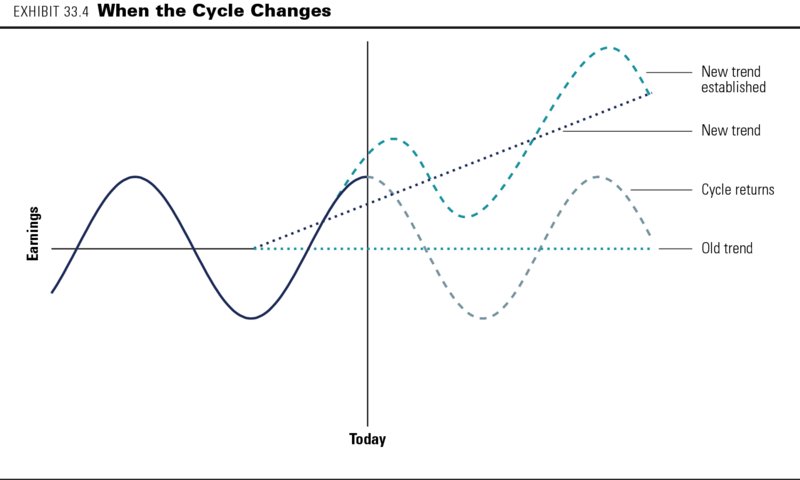
Suppose you are valuing a company that seems to be at a peak in its earnings cycle. You will never have perfect foresight of the market cycle. Based on past cycles, you expect the industry to turn down soon. However, there are signs that the industry is about to break out of the old cycle. A reasonable valuation approach, therefore, would be to build two scenarios and weight their values. Suppose you assumed, with a 50 percent probability, that the cycle will follow the past and that the industry will turn down in the next year or so. The second scenario, also with 50 percent probability, would be that the industry will break out of the cycle and follow a new long-term trend based on current improved performance. The value of the company would then be the weighted average of these two values.
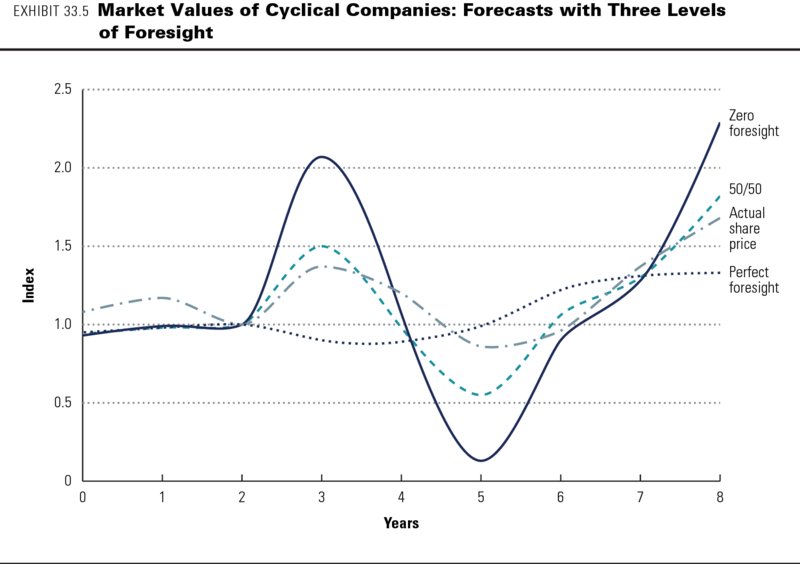
We found evidence that this is, in fact, the way the market behaves. We valued the four-year cyclical companies three ways:
- With perfect foresight about the upcoming cycle
- With zero foresight, assuming that current performance represents a point on a new long-term trend (essentially the consensus earnings forecast)
- With a 50/50 forecast: 50 percent perfect foresight and 50 percent zero foresight
Exhibit 33.5 summarizes the results, comparing them with actual share prices. As shown, the market does not follow either the perfect-foresight or the zero-foresight path; it follows a blended path, much closer to the 50/50 path. So the market has neither perfect foresight nor zero foresight. One could argue that this 50/50 valuation is the right place for the market to be.
An Approach to Valuing Cyclical Companies
No one can precisely predict the earnings cycle for an industry, and any single forecast of performance must be wrong. Managers and investors can benefit from following explicitly the multiple-scenario probabilistic approach to valuing cyclical companies, similar to the approach used in Chapter 15 and the high-growth-company valuation in Chapter 32. The probabilistic approach avoids the traps of a single forecast and allows exploration of a wider range of outcomes and their implications.
Here is a two-scenario approach for valuing cyclical companies in four steps (of course, you could always have more than two scenarios):
- Construct and value the normal cycle scenario, using information about past cycles. Pay particular attention to the long-term trend lines of operating profits, cash flow, and ROIC, because they will have the largest impact on the valuation. Make sure the continuing value is based on a normalized level of profits (i.e., a point on the company's long-term cash flow trend line), not a peak or trough.
- Construct and value a new trend line scenario based on the company's recent performance. Once again, focus primarily on the long-term trend line, because it will have the largest impact on value. Do not worry too much about modeling future cyclicality (although future cyclicality will be important for financial solvency).
- Develop the economic rationale for each of the two scenarios, considering factors such as demand growth, companies entering or exiting the industry, and technology changes that will affect the balance of supply and demand.
- Assign probabilities to the scenarios, and calculate their weighted values. Use the economic rationale and its likelihood to estimate the weights assigned to each scenario.
This approach provides an estimate of the value as well as scenarios that put boundaries on the valuation. Managers can use these boundaries to improve their strategy and respond to signals about which scenario is likely to occur.
Implications for Managing Cyclical Companies
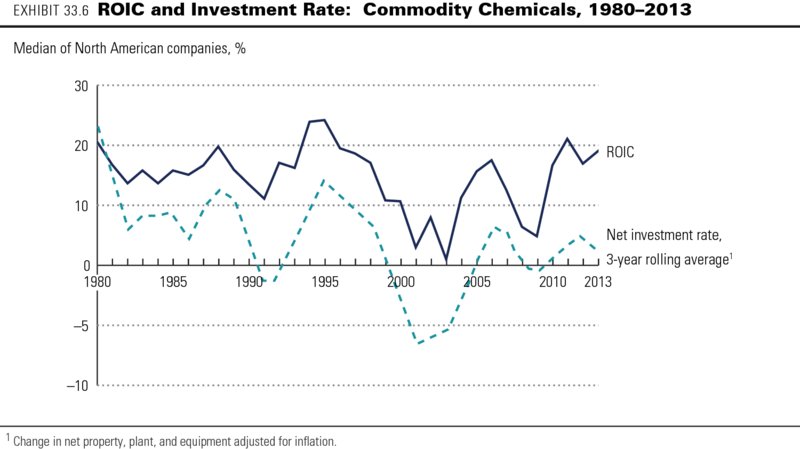
Is there anything managers can do to reduce or take advantage of the cyclicality of their industry? Evidence suggests that, in many cyclical industries, the companies themselves are what drive cyclicality. Exhibit 33.6 shows the ROIC and net investment in commodity chemicals from 1980 to 2013. The chart shows that, collectively, commodity chemical companies invest large amounts when prices and returns are high. Since capacity comes on line in very large chunks, however, utilization plunges, and this places downward pressure on price and ROIC. The cyclical investment in capacity is the driver of the cyclical profitability. Fluctuations in demand from customers do not cause cyclicality in profits. Producer supply does.
Managers who have detailed information about their product markets should be able to do a better job than the financial market in figuring out the cycle and then take appropriate actions. We can only speculate why they do not do so. Still, based on conversations with these executives, we believe that the herding behavior is caused by three factors: First, it is easier to invest when prices are high, because that is when cash is available. Second, it is easier to get approval from boards of directors to invest when profits are high. Finally, executives are concerned about their rivals growing faster than themselves (investments are a way to maintain market share).
This behavior also sends confusing signals to the stock market. Expanding when prices are high tells the financial market that the future looks great (often just before the cycle turns down). Signaling pessimism just before an upturn also confuses the market. Perhaps it should be no surprise that the stock market has difficulty valuing cyclical companies.
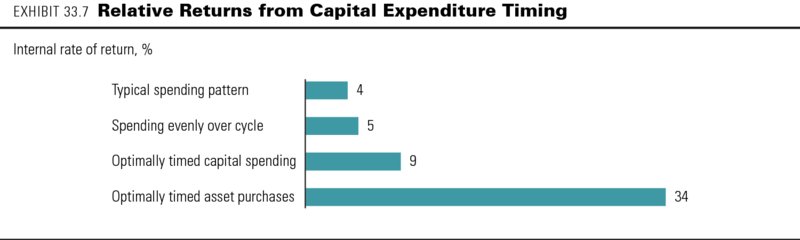
How could managers exploit their superior knowledge of the cycle? The most obvious action would be to improve the timing of capital spending. Companies could also pursue financial strategies, such as issuing shares at the peak of the cycle or repurchasing shares at the cycle's trough. The most aggressive managers could take this one step further by adopting a trading approach, making acquisitions at the bottom of the cycle and selling assets at the top. Exhibit 33.7 shows the results of a simulation of optimal cycle timing. The typical company's returns on investment could increase substantially.
Can companies really behave this way and invest against the cycle? It is actually very difficult for a company to take the contrarian view. The CEO must convince the board and the company's bankers to expand when the industry outlook is gloomy and competitors are retrenching. In addition, the CEO has to hold back while competitors build at the top of the cycle. Breaking out of the cycle may be possible, but it is the rare CEO who can do it.
Summary
At first glance, the share prices of cyclical companies appear too volatile to be consistent with the DCF valuation approach. This chapter shows, however, that share price volatility can be explained by the uncertainty surrounding the industry cycle. Using scenarios and probabilities, managers and investors can take a systematic DCF approach to valuing and analyzing cyclical companies.
Review Questions
- Assuming investors had perfect foresight, how would the volatility of a cyclical company's share price compare with the volatility of its profits?
- Describe how analyst projections of cyclical company profits compare with actual performance. What are the possible reasons for the deviation?
- Why should a scenario approach to valuation be used to value cyclical companies?
- What are the potential reasons cyclical companies invest cyclically rather than countercyclically? When should companies invest?
- What are the four steps in a scenario analysis approach for valuing cyclical companies?