After we have configured the triggers, they generate events, which in turn are acted upon by actions.
But can we see more details about them somewhere? In the frontend, go to Monitoring | Problems, and click on date and time in the Time column for the latest entry with a Problem status.
This opens up the Event details page, which allows us to determine the event flow with more confidence. It includes things such as event and trigger details and action history. The Event list section in the lower-right corner, which includes the previous 20 events, acts as a control, allowing you to click on any of these events and once again see the previous 20 events from the chosen event. As this list only shows events for a single trigger, it is very handy if you need to figure out the timeline of one, isolated problem:

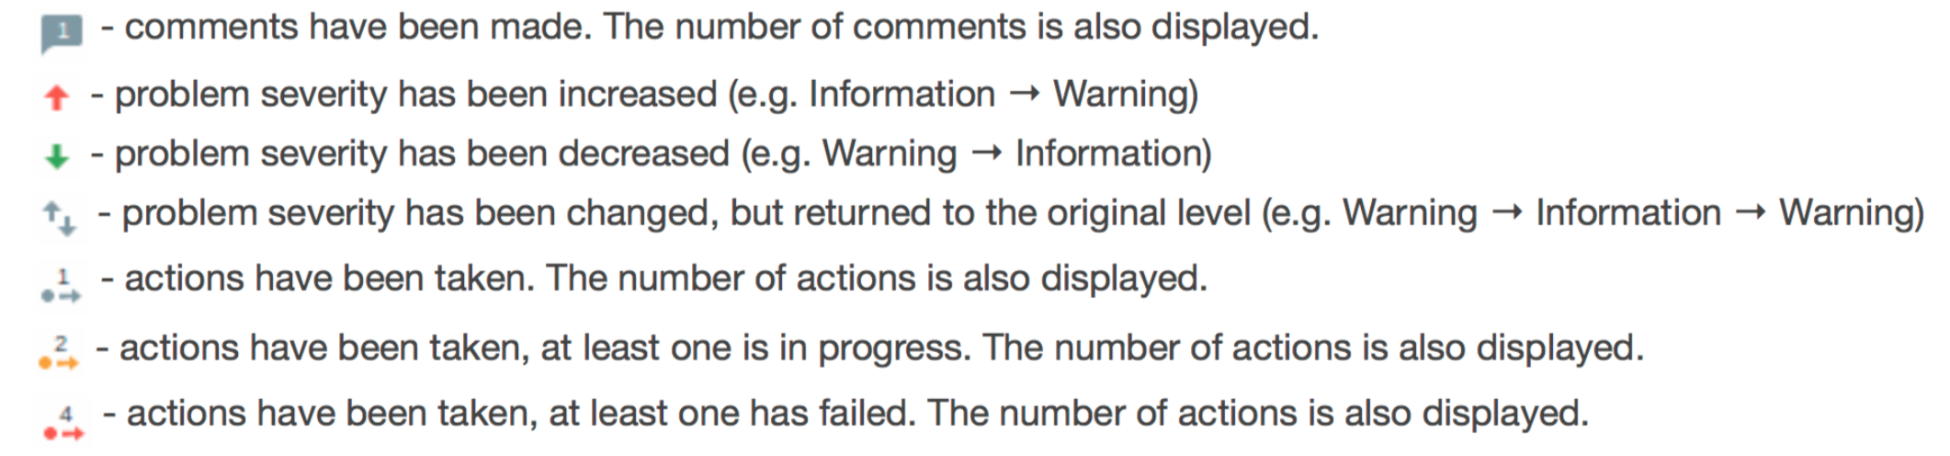
Another handy feature that's new in version 4.0 is, as you can see, the use of icons. They are visible in multiple places, such as, for example, in the problem page and the event page. They show us a quick overview of what happened with a specific item. Here is a list of icons that you might encounter and their meaning: