So, we have created our first very own host. But, given that items are the basis of all the data, it's probably of little use right now. To give it more substance, we should create items. So, still on the Configuration | Hosts page, select Linux servers from the Groups drop-down, and then click on Items next to the host we just created, A test host. This host has no items to list—click on the Create item button in the upper-right corner.
There's a form, vaguely resembling the one for host creation, so let's fill in some values:
- Name: Enter CPU Load into this field. This is how the item will be named—basically, the name that you will use to refer to the item in most places.
- Key: The value in this field will be system.cpu.load. This is the technical name of the item, which identifies what information it gathers.
- Type of information: Choose Numeric (float). This defines which formatting and type the incoming data will have.
After filling in all the required information, you will be presented with the following screenshot:
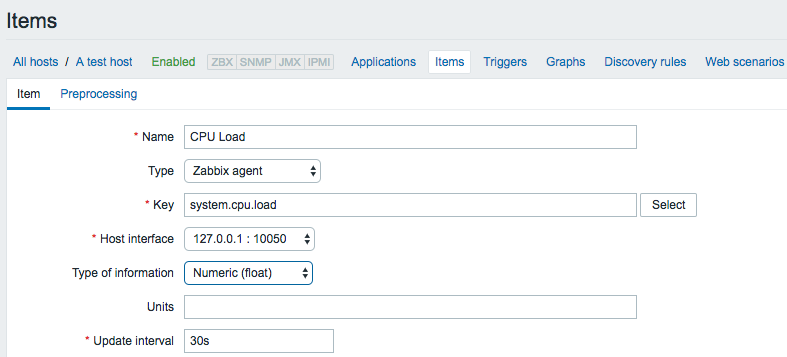
We will look at the other defaults in more detail later, so click on Add at the bottom.
You should now see your new item in the list. But we are interested in the associated data, so navigate to Monitoring | Latest data. Notice the filter that takes up half the page? This time, we will want to use it right away.
Starting with Zabbix 2.4, the Latest data page does not show any data by default for performance reasons; thus, we have to set the filter first.
In Filter, type test in the Hosts field. Our new host should appear. Click on it, then click on Apply below the filter. You might have to wait for up to a minute to pass after saving the item, and then you should see that this newly created item has already gathered some data:

What should you do if you don't see any entries at all? This usually means that data has not been gathered, which can happen for a variety of reasons. If this is the case, check for these common causes:
- Did you enter item configuration exactly as in the screenshot? Check the item key and type of information.
- Are both the agent and the server running? You can check this by executing the following as root:
# ss -lpn | grep zabbix
- The output should list both the server and agent daemons running on the correct ports:
tcp LISTEN 0 128 *:10050 *:* users:(("zabbix_agentd",pid=1001,fd=4),("zabbix_agentd",pid=1000,fd=4)
 tcp LISTEN 0 128 :::10051 :::* users:(("zabbix_server",pid=1509,fd=6),("zabbix_server",pid=1508,fd=6)
- Can the server connect to the agent? You can verify this by executing the following from the Zabbix server:
# telnet localhost 10050

Trying ::1...
Connected to localhost.
Escape character is '^]'.
Connection closed by foreign host.
- If the connection fails, it could mean that either the agent is not running or some restrictive firewall setting is preventing the connection. In some cases, SELinux might prevent that connection, too.
- If the connection succeeds but is immediately closed, then the IP address that the agent receives the connection from does not match the one specified in the zabbix_agentd.conf configuration file for the Server directive. On some distributions, this can be caused by IPv6 being used by default, so you should try to add another comma-delimited value to the same line for the IPv6 localhost representation to this directive, ::1.
The Zabbix server reads into the cache all the information on items to monitor every minute by default. This means that configuration changes such as adding a new item might show an effect in the data that's collected after one minute. This interval can be tweaked in zabbix_server.conf by changing the CacheUpdateFrequency parameter.
Once data starts arriving, you might see no value in the Change column. This means that you moved to this display quickly, and the item managed to gather only a single value, thus, there's no change yet. If that is the case, waiting a bit should result in the page automatically refreshing (look at the page title—remember the 30-second refresh we left untouched in the user profile?), and the Change column will be populated. So, we are now monitoring a single value: the UNIX system load. Data is automatically retrieved and stored in the database. If you are not familiar with this concept, it might be a good idea to read the overview at https://www.tecmint.com/understand-linux-load-averages-and-monitor-performance/.