The initial Zabbix installation does not contain many predefined users—let's look at the user list. Navigate to Administration | Users:

That's right; only two user accounts are defined—Admin and guest. We have been logged in as Admin all the time. On the other hand, the guest user is used for unauthenticated users. Before we logged in as Admin, we were guest. The user list shows some basic information about the users, such as which groups they belong to, whether they are logged in, when their last login was, and whether their account is enabled. A guest user can be unwanted, as they could reveal certain information that should not be visible to anybody, so use with care!
Let's create another user for ourselves. Click on the Create user button located in the upper-right corner. We'll look at all of the available options for a user account, while filling in the appropriate ones:
- Alias: Enter monitoring_user. This is essentially a username.
- Name: Enter monitoring. In this field, you would normally enter the user's real name.
- Surname: Enter user. This field normally contains the user's real surname.
- Groups: Just like hosts, user accounts can be grouped. A user must belong to at least one group, so let's assign our new user to a group, at least temporarily. Click on the Select button next to the Groups field, and mark the checkbox next to Zabbix administrators. Then, click on Select.
- Password: Choose and enter a password, and then retype it in the next field.
- Language: The frontend has translations in various levels of maturity, and each user can choose their own preference. We'll leave this as English (en_GB).
- Theme: The Zabbix frontend supports theming. Currently, there are only four themes included, though. We'll leave the theme as System default.
- Auto-login: Marking this option will automatically log the user in after they have logged in at least once manually. Automatic login is performed with browser cookies. We won't be using automatic login for this user.
- Auto-logout: You can make a particular account automatically log out after a specific period of inactivity. The minimum time period that can be set is 90 seconds. The maximum is about 1 day, and time suffixes are supported. There is no need to set automatic logout here.
- Refresh: This is the time, in seconds, between page refreshes when in the Monitoring section. While smaller values might be nice to look at when first setting up and having items with short check intervals, they somewhat increase the load on the server, and if the page contains a lot of information, then it might not even finish loading before the next refresh kicks in. Let's set this to 60s for this user—after all, they can always refresh manually when testing something. Note that some pages do not perform a full page refresh; instead, they just reload some elements on that page. A graph page, for example, only reloads the graph image.
- Rows per page: Each user can have an individual maximum rows-per-page setting. If the returned data exceeds this parameter, the interface splits the data into multiple pages. We won't change this parameter.
- URL (after login): A user might wish to always see a specific page after logging in – be it the overview, trigger list, or any other page. This option allows the user to customize that. The URL that's entered is relative to the Zabbix directory, so let's make this user always see Monitoring | Problems when they log in, by entering tr_status.php here.
The final result should look as follows:
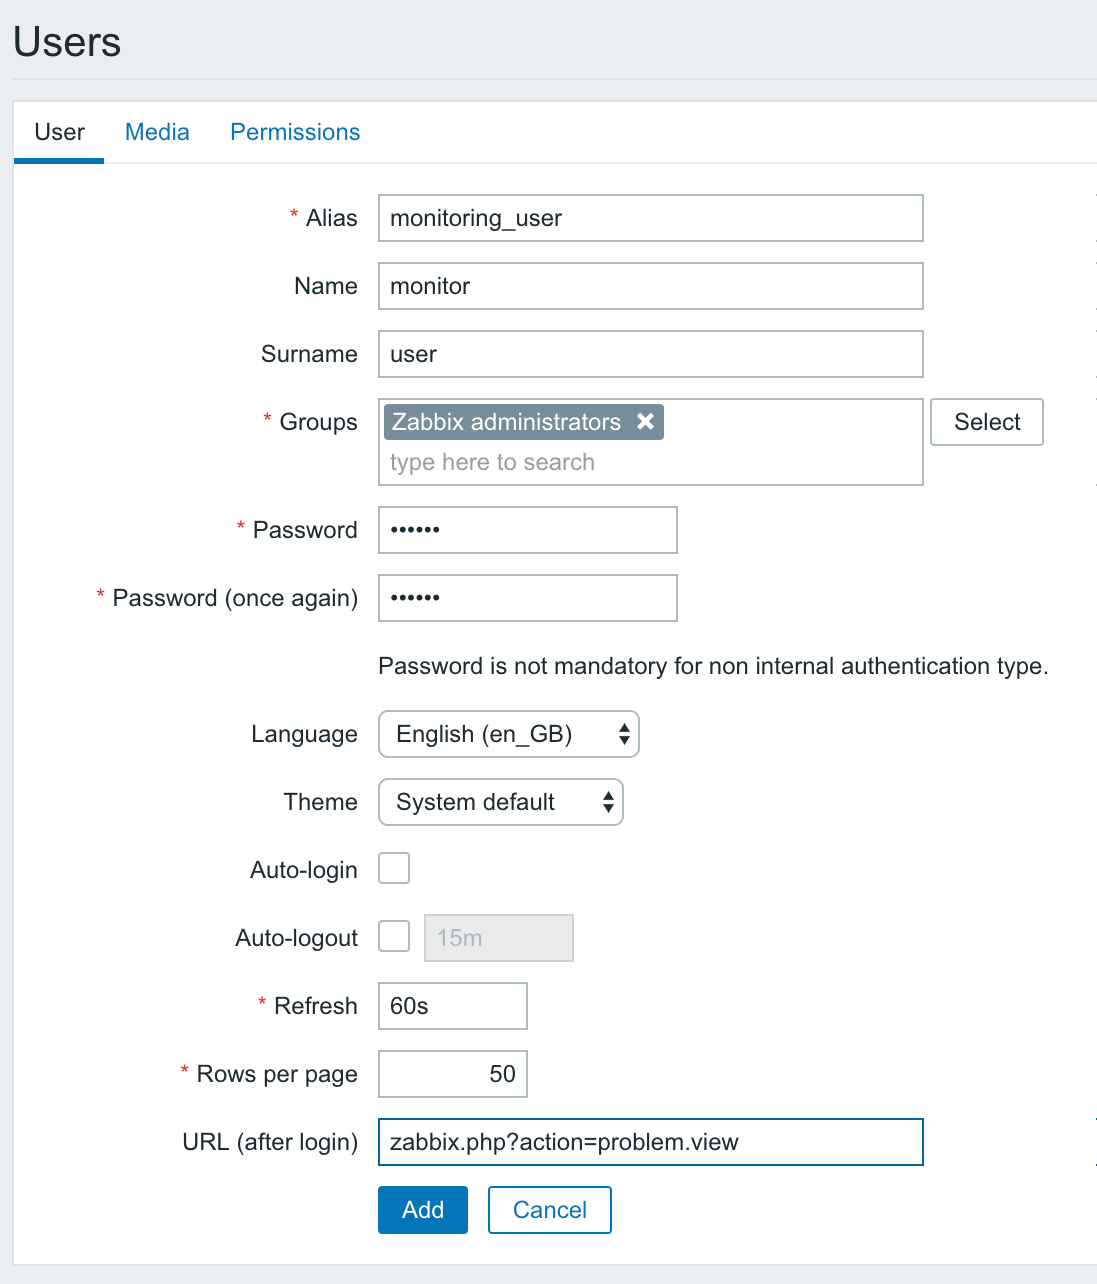
If it does, click on the Add button at the bottom.
Now, it would be nice to test this new user. It is suggested that you launch another browser for this test so that any changes are easy to observe. Let's call the browser where you have the administrative user logged in Browser 1 and the other one Browser 2. In Browser 2, open the Zabbix page and log in as monitoring_user, supplying whatever password you entered before. Instead of the dashboard, the Monitoring | Problems page is opened.
Also, the page is notably different than before—the main menu entries Configuration and Administration are missing here. Also the Host and Host groups entries are both empty and nothing can be selected; no issues are visible. Go to Monitoring | Overview. The Group drop-down is set to all and Type is set to Triggers, but the Details view claims that there's No data found. How come?
By default, users don't have access to any systems. When our new user logs in, nothing is displayed in the monitoring section, because we did not grant any privileges, including read-only. We did assign this user to the Zabbix administrators group, but that group has no permissions set by default.
Back in Browser 1, click on monitoring_user in the Alias column. One minor thing to notice—instead of a Password input field, this time, a button that says Change password is visible. If you ever have to reset a password for a user, clicking on this button will reveal the password input fields again, allowing a password update along with any other changes that might have been made:

But there's a tab we still haven't used—Permissions. Let's switch to it.
The first thing to notice is the User type drop-down. It offers three user types. We'll leave it at Zabbix User for this user:
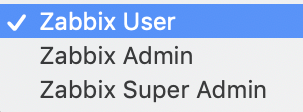
For reference, these types have the following meanings:
- Zabbix User: These are normal users that only have access to the Monitoring, Inventory, and Reports sections in the Main menu
- Zabbix Admin: These users, in addition to the previous three sections, have access to the Configuration section, so they are able to reconfigure parts of Zabbix
- Zabbix Super Admin: These users have full access to Zabbix, including the Monitoring, Configuration, and Administration sections
The following is a section that looks very similar to what we are looking for; there are Host groups and permissions:

There's just one problem—there is no way to change these permissions.
A helpful message at the bottom of the page explains why. It says Permissions can be assigned for user groups only.
We conveniently skipped adding or configuring any groups and permissions, so now is a good time to fix that.