INEQUALITY OF INCOME

Let’s start, then, with income. We use a fairly simple metric for this: the share of total income going to the top 10 percent of earners. By definition, in a perfectly egalitarian society that share would equal 10 percent of total income, since those earners represent 10 percent of the population. In a perfectly inegalitarian society, they would take all the income, a share of 100 percent. What actually happens, of course, lies somewhere between the two extremes. As shown in figure 1, the share going to the top 10 percent is lowest in Northern Europe (20 to 30 percent), and highest in South Africa, where that share reaches 70 percent. This should give you a first glimpse of the considerable variation in levels of inequality across the globe.
If you were to try, looking down from a great height, to decide which were the most egalitarian and inegalitarian parts of the world, the first thing you’d notice is a great deal of variation, sometimes even within a single region: in Latin America, for instance, Argentina is more egalitarian than Brazil or Chile, in keeping with the country’s sociopolitical history and the groundwork laid by Juan Perón to build a welfare state, which was realized more fully there than in any of the neighboring countries. But some regions do show a higher degree of overall inequality: South Africa, with its legacy of apartheid, and southern Africa generally; and Latin America as a whole has a high degree of inequality of property, tied to Spanish colonization and the political regimes that followed; North America, for its part, bears traces of specific racial inequalities. Generally speaking, colonial legacies have left a strong and lasting mark on the structures of inequality. But there are also areas, like the Middle East, where the sharp disparities are not due to a past history of racial or colonial inequality but to a modern fact, namely oil revenues, which have turned into financial revenues, concentrated among an extremely small share of the population. In the current map of inequality, we therefore see a mix of old and new, with different interlocking rationales.
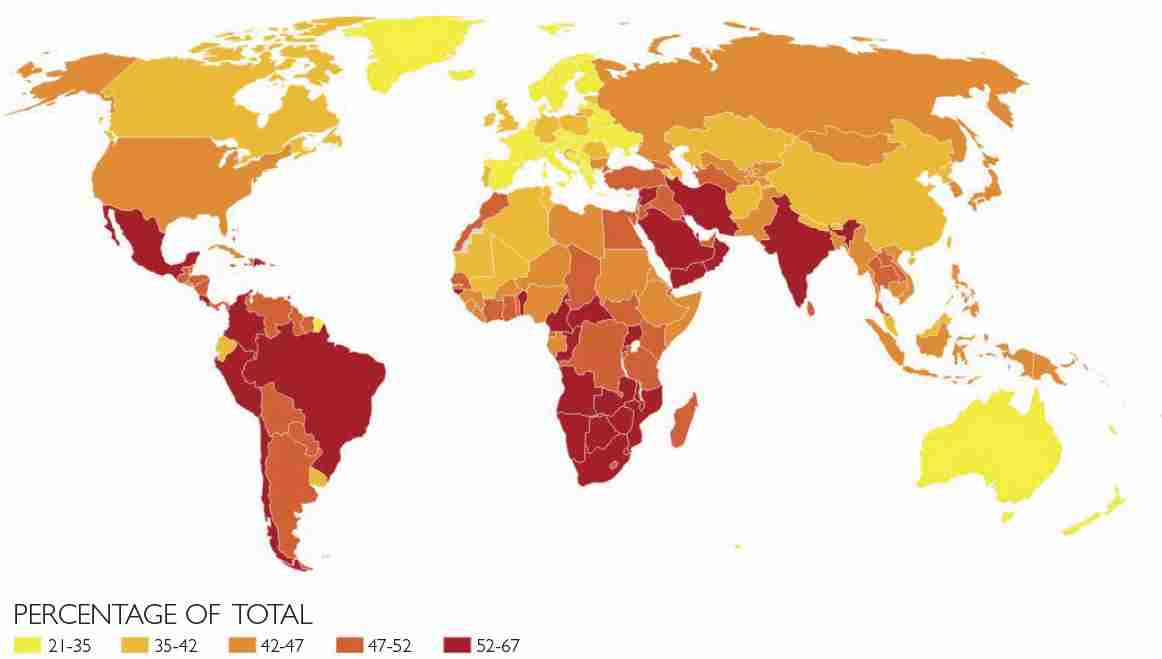
FIG. 1 Share of income going to the top 10 percent globally, 2022
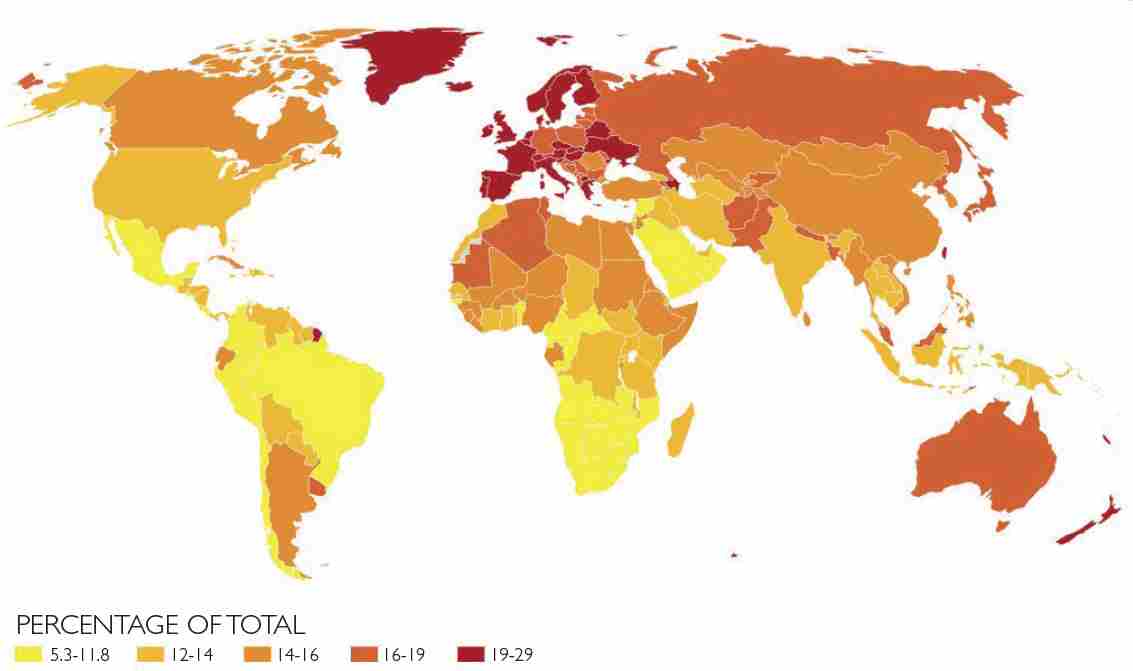
FIG. 2 Share of income going to the bottom 50 percent globally, 2022
Our metric for income inequality gives even starker results when we look at the lower end of the economic spectrum: What share of the total national income goes to the poorest 50 percent (fig. 2)? There again, you have to keep proportionality in mind. In a perfectly egalitarian society, the poorest 50 percent would receive 50 percent of total income. Conversely, in a totally inegalitarian society, they would receive nothing at all. In fact, the number stands at 5 or 6 percent of total income in the most inegalitarian countries (South Africa, for instance), and 20 or 25 percent in the most egalitarian (again, Northern Europe). Nowhere does it reach 50 percent. When we say that this portion of the population receives 25 percent of total income, it means that the average income of the poorest 50 percent is approximately half the national average. This certainly reflects a fair degree of inequality, but less than where the bottom 50 percent are getting 5 percent of total income, meaning that the average income of the poorest group is a tenth of the average national income.
It’s important in general to keep in mind the great diversity of situations. If we take stock only of a country’s gross national product (GNP) or its average national income, we may completely overlook very real factors that affect the living conditions of sizable groups within that society, since in two countries with the same average income, the share distributed among the poorest 50 percent may vary by a factor of from one to five according to the income distribution model (it’s roughly 5 percent of total income in South Africa and roughly 25 percent in Sweden). Consequently, when we look at how poverty develops, we miss a great deal if we look only at average income as a whole.
It would be impossible to account for this variation in inequality on the basis of “natural” factors. The disparities cannot be attributed to differences in personal talent, native endowment, or natural temperament—and it would be very surprising for these talents to be distributed so unevenly between countries. Nor can we attribute the disparities to the countries’ natural resources—there is oil in the Middle East and oil in Norway, yet their income distribution is entirely different. All the evidence suggests that it’s the institutions chosen by these different societies, which are themselves the product of different social, cultural, political, and ideological histories, that lead to the wide disparity in levels of inequality.