NATURE AND INEQUALITY

I’d like to end this text with an examination of the interplay between nature, culture, and inequality in the context of the destruction of nature, the capital tied up in nature. I’m going to discuss data relating to climate change and carbon emissions; but we could focus on data of equal interest relating to other aspects of man’s impact on nature. The important point I’d like to make is that the challenges posed by climate and the environment are intimately linked to inequality.
No credible solution to the challenge of global warming is imaginable without a drastic reduction in inequality and without new progress toward a greater level of equality—first, because of the substantial disparities in carbon emissions between the countries of the Global North and South, and second because of the carbon emission inequalities within countries.
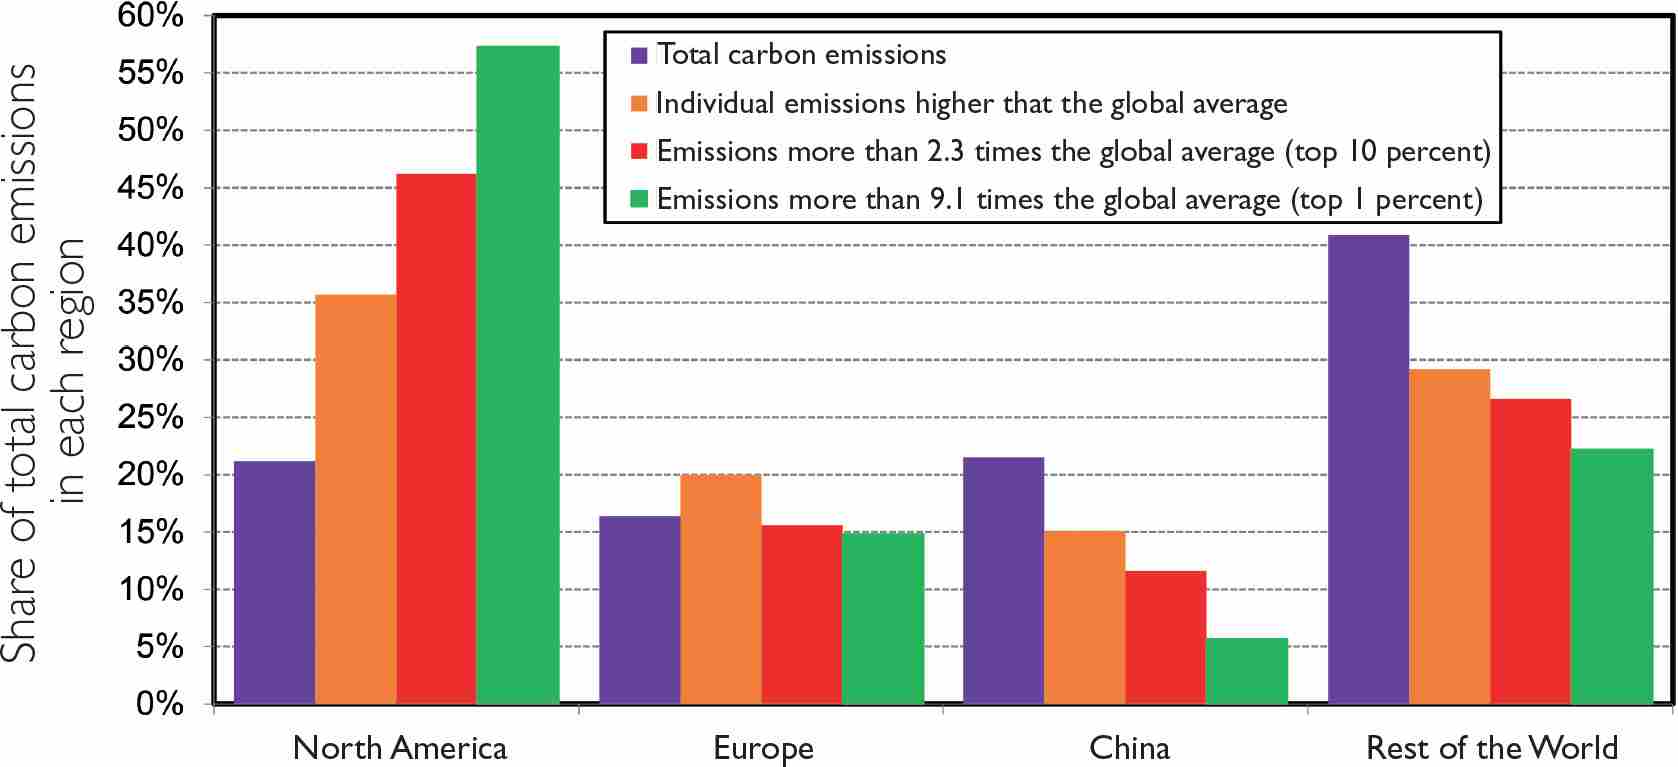
FIG. 17 Carbon emissions worldwide, 2010–18
From 2010 to 2018, North America’s share of total carbon emissions (direct and indirect) was 21 percent on average. The United States and Canada also accounted for 36 percent of individual emissions above the global average (which is 6.2 tons of CO2 per year), 46 percent of emissions greater than 2.3 times the global average (that is, the top 10 percent of individual emissions worldwide, responsible for 45 percent of total emissions, as against 13 percent for the bottom 50 percent of emitters), and 57 percent of emissions greater than 9.1 times the average (that is, the top 1 percent of individual emissions worldwide, responsible for 14 percent of total emissions). See: piketty.pse.ens.fr/egalite
The graph above (fig. 17), which focuses on disparities between countries, is based on research conducted with Lucas Chancel in our research lab on world inequality. The distribution of total carbon emissions, in the aggregate, is shown in purple: we can see that North America, Europe, and China emit carbon at roughly comparable levels. Yet their populations are very different in size and very different in their emission levels. I should point out that this data has been corrected for the emissions embedded in imports: all too often, we account only for the emissions generated domestically, ignoring emissions that are subcontracted for outside the country and are then consumed when those goods are imported. By incorporating this factor, the graph above gives a more balanced account of the situation.
But let’s turn our particular attention to the other colors. The green bar, for example, represents not the country’s share of total emissions but its share of very large carbon emitters, those whose individual emissions are more than nine times the global average. The global average for the seven billion humans on the planet is approximately six tons of carbon per year. The emissions shown in green therefore correspond to those emitted at a rate of more than fifty-four tons per person; they are equivalent to the top 1 percent of individual emissions. That 1 percent by itself has higher carbon emissions than the 50 percent of the planet’s population who produce the least emissions. More than 55 percent of these high emissions come from North America, with Europe next highest, followed by China.
The responsibility for carbon emissions is thus distributed across the globe very asymmetrically. It’s entirely imaginable that when the devastation from climate catastrophes becomes even greater than it is today, some countries will demand reparations from others and possibly revisit their trade arrangements with them. I don’t know what degree of catastrophe it will take to bring us to that point, but the truth is that the current situation is highly asymmetrical.
The second aspect concerns the disparities within given countries. This graph (fig. 18), drawn from the World Inequality Report 2022, shows carbon emission levels in tons per person, divided into the same groups we used before in graphing income and wealth, that is, comparing the bottom 50 percent (those who emit the least carbon), the top 10 percent, and the 40 percent in the middle. In Europe, the 50 percent who emit the least carbon—who more or less correspond to the bottom 50 percent economically—are at the five-ton level (four or four and half tons in France). To reach a sustainable level of carbon pollution, these emissions would have to fall to two or three tons. This group is therefore almost in sight of the official goals set for 2030 or 2040. By contrast, the top 10 percent are at twenty-nine tons, thirty tons, and even thirty-five tons per person. And if we were to look only at the top 1 percent in Europe, we would find them emitting at rates of sixty to seventy tons. In the United States, the top 10 percent are already emitting at a rate of more than seventy tons per person per year.
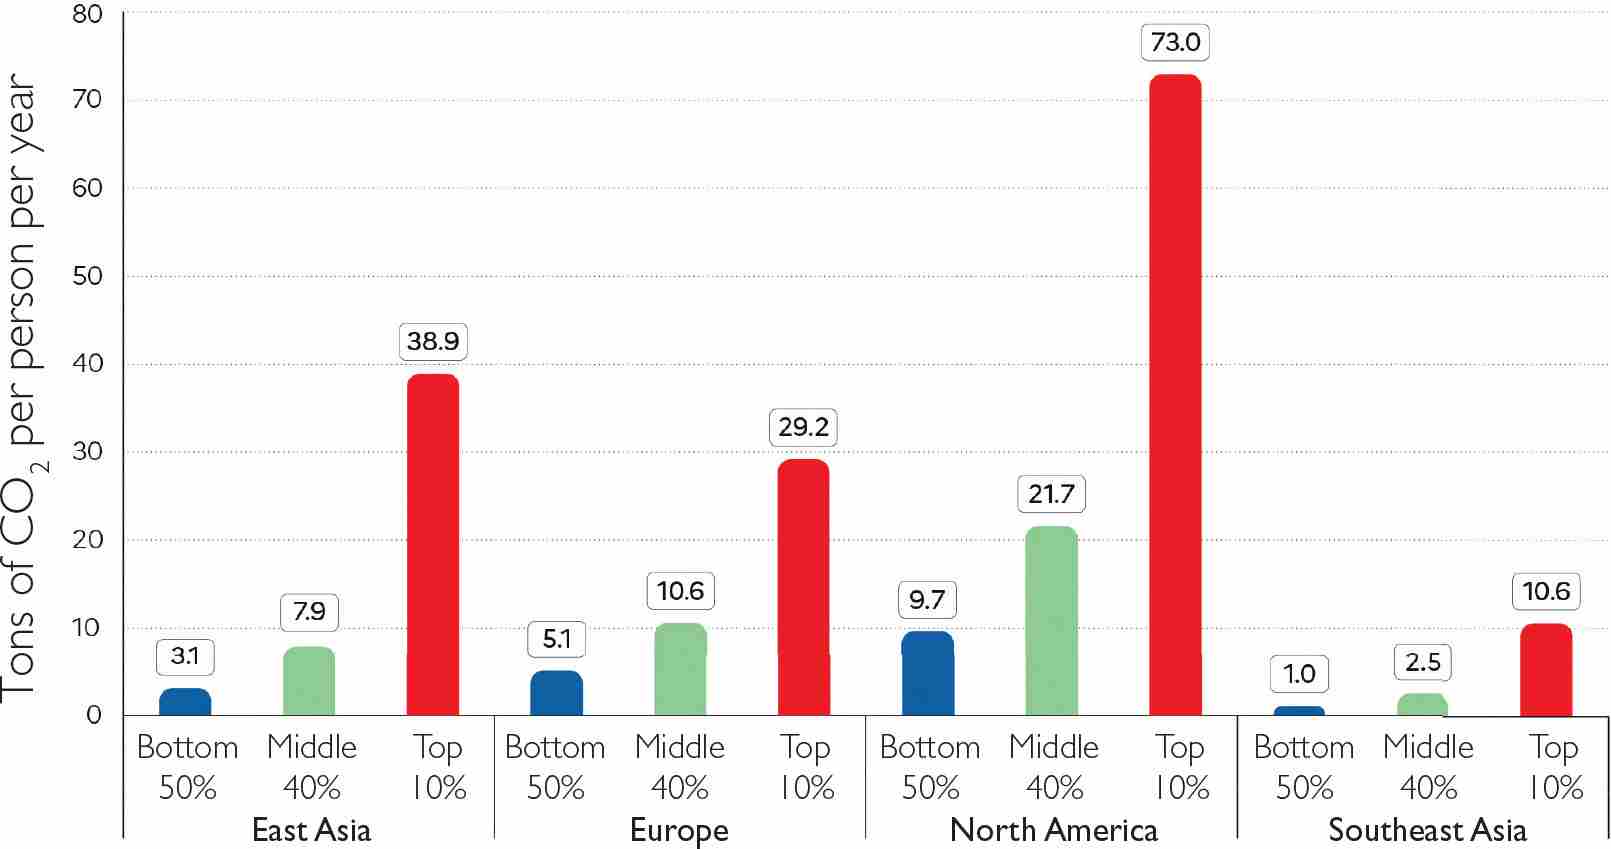
FIG. 18 Emissions per person per region across the world, 2019
An individual carbon footprint is composed of emissions from domestic consumption, public and private investments, and the net import of goods and services from other parts of the world. These estimates are based on a combination of tax data, household studies, and import-export tables. Emissions are divided equally among household members. See: wir2022.wid.world/methodology and Chancel (2021).
An emission-reduction policy, therefore, that proposed a fixed cut across the entire population would inevitably run into difficulties. It would be hard to convince people who are emitting four or five tons per year that they should reduce their emissions by the same proportion as people emitting thirty or even seventy tons. A strategy that increased energy costs at the same rate for everyone would never be accepted. On the contrary, such a policy would inevitably provoke, in the years and decades ahead, a tax revolt of the kind that the gilets jaunes (yellow vests) recently spearheaded in France. All the more so as these solutions often spare the energy consumed by the richest group—jet fuel in particular.
It’s hard to see how else to meet these challenges than by asking those whose carbon emissions are highest to make reductions that are proportionally higher. This would call for putting a whole system in place that would include such tools as a progressive carbon card. It would also call for quite a drastic reduction in the income and wealth gaps.