21.1 Introduction
Spectroscopy has been a technique of great scientific relevance, practically since its appearance. It contributed to the discovery of elements as caesium, rubidium or helium; it was used to determine the composition of the Sun and other celestial objects, to establish the structure of atoms, etc. Nowadays, its use is common in the detection of chemical substances or in the study of celestial objects, among many other applications. In addition, since the popularization of LEDs as a light source, several studies have been carried out which highlight their impact on the reconciliation of sleep, an effect that is related to the spectre of the light they emit (Gooley et al. 2011). Despite its scientific importance, our experience shows us that it is completely unknown to the general public. On the other hand, in the school and academic world, spectroscopy has an important presence due to its relationship with the atomic models studied in Physics and Chemistry at high school. However, didactic research has found that even university science students have difficulties to explain spectrum formation (Ivanjek et al. 2015; Savall et al. 2016).
At the Museo Didáctico e Interactivo de Ciencias de la Vega Baja del Segura de la Comunitat Valenciana (MUDIC-VBS-CV), we have set the objective of bringing spectroscopy closer to the general public through hands-on and STEM activities. Visitors are involved in activities in which they have to build a simple spectroscope and use it to observe and interpret the spectra of common light sources such as energy-saving bulbs, LEDs or old tungsten filament bulbs.
21.2 Project Description
Building a spectroscope is a simple task that most science professors have carried out and that has been presented in numerous publications (De Luís and Martínez 2010; Remón et al. 2016). However, the main part of the proposals is based on qualitative spectroscopes, being the quantitative spectroscopes difficult to construct due to the materials used. Our work has focused on that objective: the construction of a spectroscope with economical and easy-to-find materials that allows us to measure the wavelengths of spectral lines.
The Museo Didactico e Interactivo de Ciencias de la Vega Baja del Segura de la Comunitat Valenciana (MUDIC-VBS-CV) is mainly visited by schoolchildren (and when the accompanying teachers request it they carry out a spectroscopy workshop) as well as general public that visits the museum during open days or when offering other activities. In this workshop, visitors construct the spectroscope with the help of a museum monitor and use it to analyse the most common light sources: incandescent lamps, fluorescent lamps, LED lamps, etc.
The main aim of the workshop is that many families from the provinces of Alicante and Murcia build the spectroscope and use it to analyse the different light sources. By that, we will contribute to achieve the objectives of the MUDIC-VBS-CV, which refer to the dissemination of scientific content outside the school. Visiting teachers will also be able to borrow spectroscopes for their classrooms. The spectroscope will also be provided to teachers in the training courses organized by the MUDIC-VBS-CV, so that it can be used to deal with the curricular contents related to spectroscopy.
21.3 Methodology and Materials

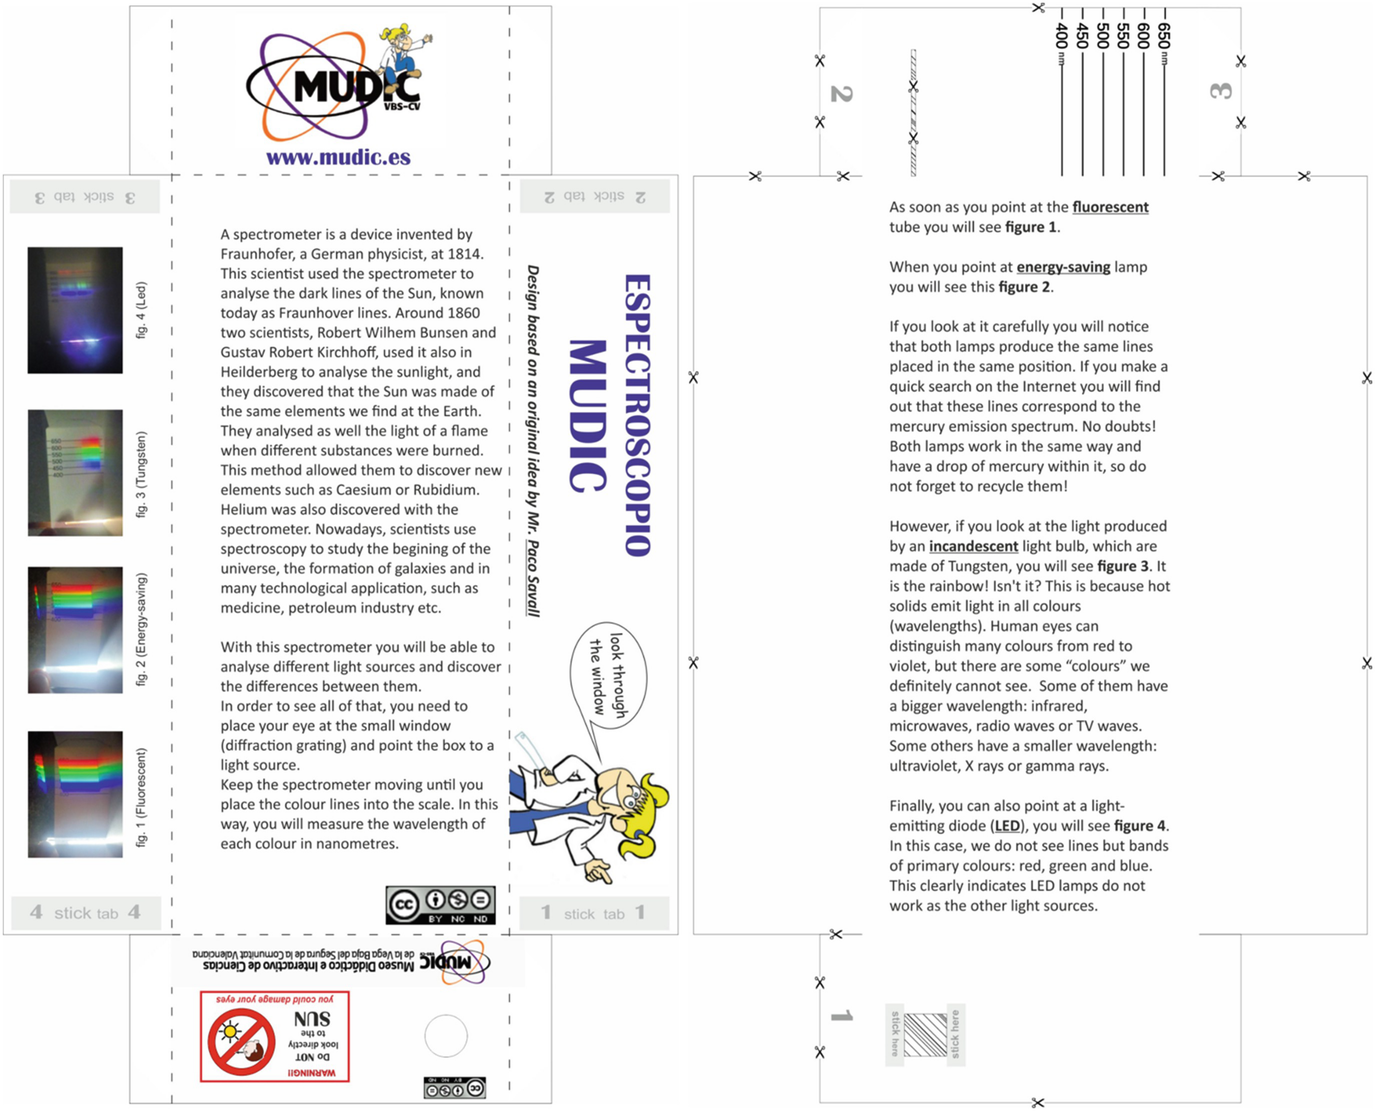
On the left it is shown the outer part of the spectroscope which includes a brief explanation of spectroscopy history. The right image shows the inner side, which includes an explanation of the mounting and use of this spectroscope. It is offered to the attendees printed and die-cutting. Its real dimensions are 18 cm × 8 cm × 4 cm
We have designed the template from other spectroscope models (see, for example, Savall et al. 2013). In this case, we have reduced the spectroscope length and we have calibrated the scale to be able to read the values of the wavelengths of the spectral lines directly, a useful improvement that allows us to read the wavelength directly avoiding the use of mathematical functions.

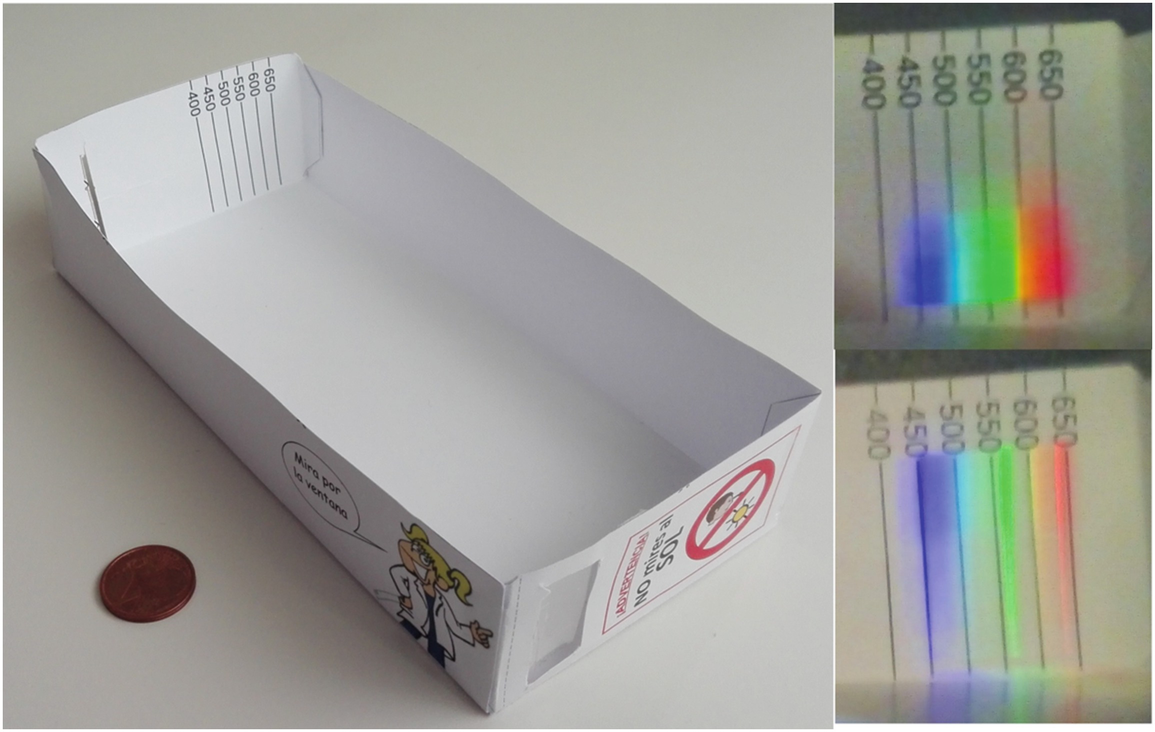
On the left it is shown the spectroscope once mounted. At the bottom we can see the slit behind which the light source is located and to the right we appreciate the calibrated scale for measuring the wavelength. On the front, we see the ocular, covered by a diffraction grid. Next to the spectroscope there is a 2-cent euro coin which serves as a reference for appreciating its small size. On the right side of the image we show two spectra, corresponding to a white light emitting LED (top) and a low-energy light bulb (bottom)

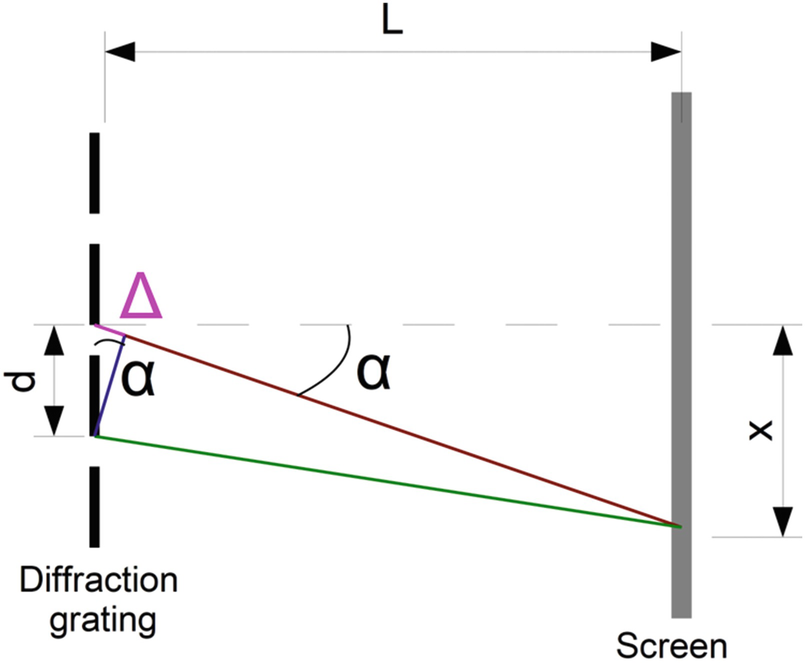
Diffraction grid containing slits at a distance d. At a distance L from the grid, we set a screen on which the light spectrum is observed. We consider an X-point where constructive interference occurs. Red and green lines represent the paths followed by the waves from two consecutive slits to X-point and Δ represents the difference in both paths’ length


Position where each spectral line is observed
λ (nm) | 400 | 450 | 500 | 550 | 600 | 650 | 700 |
x (cm) | 3,4 | 3,9 | 4,3 | 4,8 | 5,2 | 5,7 | 6,1 |
Measured wavelengths for each spectral line of the low-energy bulb and values tabulated in the literature
Line | Violet | Blue | Green | Orange | Red |
|---|---|---|---|---|---|
λmeasured (nm) | 400–450 | 500 | 550 | 600 | 650 |
λtabulated (nm) | 405 and 436 | 492 | 546 | 577 | 612 |
We have also tested the spectroscope with three laser pointers (red, green and blue) with wavelengths of 635, 532 and 405 nm, respectively. By measuring the wavelength with the spectroscope, we confirm that the wavelength measured by using the spectroscope matches the value provided by the laser devices, within the precision expected.
21.4 Teaching and Learning Sequence Developed in the Workshop
The teaching and learning sequence (TLS) is carried out with 20 attendees in two different rooms, each of which has a maximum of 10 attendees. Each group is guided by a museum monitor. The workshop is developed through an inquiry-based strategy.
At the very beginning, the TLS sets a problem and involves the attendees in a research aiming at finding an answer using their own previous knowledge and with the assistance of the monitor. In our case, the problem is “Which visible light sources do we currently have? What light do they emit?” After setting the problem, we carry out some activities to familiarize the attendees with the problem: we show the attendees some light sources (an image of a star, a flame, some different bulbs or a TV screen, among others) and we ask them to think what they have in common, whether they emit light of the same colour and what colour of light would be most useful for their purpose.
Once we have familiarized the attendees with the light sources and the colour of the light emitted by each one, we introduce the possibility of “breaking down” the light into spectra to analyse its chromatic composition. To do so, we show them an image of a natural rainbow and ask if a similar analysis of artificial light sources could be done using artificial instruments. After showing them a diffraction grid and stick it into a spectroscope that they will later mount, we use it to observe the light spectra of the different artificial sources previously introduced. We asked the audience about the similarities and differences between the observed spectra.
The assistants observe that there are light sources that have the same spectrum (the fluorescent light tube, the energy-saving bulb and the mercury Crookes tube) and associate it with the similarity between the bulbs. The monitor explains that sources with the same spectrum contain the same gas, in this case mercury. Then, we try to explain why a substance always emits the same light spectrum. We reflect on the nature of light and introduce the idea that it is a beam of photons and that changes in the energy of the atom produce these photons. Therefore, if the changes are limited (which implies that the energy in the atom is quantized) the light emitted will always be the same. By reflecting on this explanation, the assistant can explain (in a non-formal way) how the other sources emit light.
After completing this first part, the attendees move on to the other room where they will build a spectroscope (Fig. 21.2) with the help of the monitor. The spectroscope is already printed and die-cast on a cardboard sheet, so not any additional instruments to assemble it is required. While assembling it, attendees need to reflect on its structure and determine where the slit, scale and diffraction grid should be located. As attendees construct the spectroscope, they discuss the usefulness of the spectroscope in everyday life, its scientific usefulness and industrial applications. Once the spectroscope has been built, we encourage the attendees to use it to prove it by observing the spectrum of light sources in the room and to explain them qualitatively using the concepts of electronic states and electronic transition introduced in the first part of the workshop.
21.5 Conclusions
By using simple instruments and economic materials, we have been able to design and build a quantitative spectroscope that can be used both in scientific dissemination activities and in the classroom. In fact, the work carried out in the classroom with the spectroscope shows an increment of the students’ interest in this analysis method and a better learning of the academic contents. Likewise, its use in the museum has aroused the general public’s interest in light-emitting processes, their technological application and their social and economic consequences.