Event Opportunities
Lock-up expiries
When a company lists one of its subsidiaries on the market but retains a large interest (such as GUS did when it sold its stake in Burberry), it is common for there to be a lock-up arrangement over the remaining stake in an attempt to reassure potential investors that the market is not about to be flooded with cheap stock. A similar arrangement takes place in IPOs, where the original private equity backers undertake not to sell further stock for a period of time.
Lock-ups generally run for 180 days from the IPO and prohibit existing shareholders from selling, but specific details can often be found in the listing prospectus.
However, despite the existence of such lock-up agreements, it was increasingly becoming routine strategy for market participants to take advantage of the provisions by short-selling stock (often using CFDs), ahead of the lock-up expiry. In an attempt to pre-empt this, some investment banks have sought to thwart this short selling by releasing the private equity backers from their commitment early.
Lock-ups can be waived at any time
Lock-up arrangements are only a contractual agreement between a bank and a selling shareholder, which can be made void at any time.
For example, in late 2003, the market was out-foxed when a lock-up in Yell was brought forward with the agreement of the banks, and the placing in Yell by Goldman Sachs and Merrill Lynch ahead of the lock-up wrong-footed market participants expecting a flood of shares. A similar situation occurred with the waiving of Telecom Italia’s lock-up on its Telekom Austria’s stake by J.P. Morgan and Merrill Lynch.
Share price performance around lock-up expiries will often be determined by the market’s perception of where the stock has gone. Full removal of an overhang can be more beneficial to the shares than a partial removal, as there will always be uncertainty about the placing of the residual. Similarly, if the overhang is simply passed along to another short-term holder, or a failed placing leaves stock on an investment bank’s books, the share price can suffer badly.
Example: Acambis
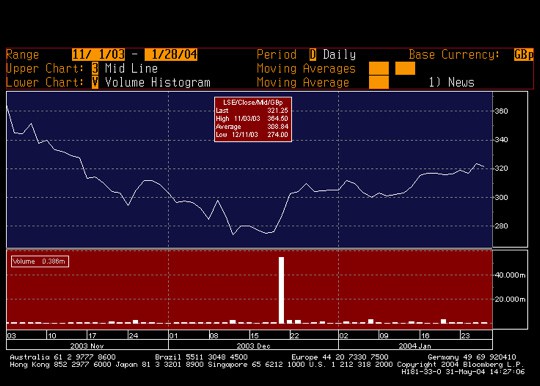
A good example of the effect on a share price of the expiry of a lock-up took place in December 2003, when a lock-up arrangement that Baxter, the US healthcare company, had over 21% of Acambis, the smallpox vaccine manufacturer, expired.
Baxter sought to place its 21% stake almost immediately on expiry of the lock-up at the beginning of December, but the market got wind of the placing after potential investors were sounded out by the investment banks involved. The stock was sold down savagely and the placing was temporarily abandoned.
A successful placing was carried out later in the month on 18 December at 245p – an 11% discount to the prevailing market price – but the chart below clearly demonstrates that the effective discount was actually much bigger, as the stock had weakened considerably during November in anticipation.
As soon as the placing was complete and the overhang cleared, the stock recovered a substantial amount of the lost ground. As is so often the case, a spike in the traded volume coincided with a turning point for the stock.
Figure 2.51: Acambis (ACM) – effect of the expiry of a lock-up
Used with permission from Bloomberg L.P.
Note: Stock placed as a result of a lock-up expiry will often be executed as a block trade or ‘bought deal’.
Index reviews, re-weightings and investability changes
Substantial stock flows can often be observed around the dates when index constituent changes are made effective.
One of the most popular strategies adopted by traders is to buy stocks that are due to enter an index and sell those that face deletion, in anticipation of buying and selling by index tracking funds on or around the date of implementation. This strategy had a great deal of success a few years ago, but has become a victim of its own success, with the arbitrage capital drawn to the trade more than compensating for any influences from tracking funds.
All trading strategies that rely on future stock flows to influence prices are reliant on limited liquidity being available on the day of implementation. If too much arbitrage capital is drawn to the situation, there will be more than sufficient liquidity to soak up any flows.
FTSE indices
In the UK, the main indices are managed by FTSE Group, an independent company that originated as a joint venture between the Financial Times and the London Stock Exchange. It has since evolved globally with more than 600 indices calculated in real time, and over $2.5tn of assets are estimated to be under management using FTSE indices.
Figure 2.52: FTSE indices

FTSE 100 & 250 Indices
A company becomes eligible for inclusion in the FTSE 100 if it rises to 90th or above in the ranking of all companies by market capitalisation. Similarly, an existing FTSE 100 company will be deleted if it falls to 111th or below at the time of the review.
In the FTSE 250, the levels are 325th and 376th respectively.
FTSE All-Share Index
The FTSE All-Share Index consists of the aggregate constituents of the FTSE 100, FTSE 250 and FTSE Small Cap Index – a total of around 687 companies. The Index aims to represent 98-99% of the full capital value of all eligible UK companies, subject to investability weightings. Securities becoming eligible for addition to the FTSE All-Share Index at the quarterly reviews must turn over a minimum of 0.5% of the shares in issue per month, in at least five of the six months prior to the review, after the application of free float restrictions. New issues need to satisfy the above criteria, as well as possessing a trading record of at least twenty days. There is also a minimum market capitalisation with a 15% band set for promotions/deletions between the Small Cap and Fledgling Indices.
FTSE Fledgling Index
The FTSE Fledgling Index consists of those companies which are too small to be included in the FTSE All-Share, but would otherwise be eligible.
In the UK most tracking funds follow either the FTSE 100 or FTSE All-Share Indices, so changes to other indices, such as the FTSE 250, are of less significance. If a company is entering all the major indices for the first time, the effect of tracking fund purchases is likely to have a greater impact than a move between indices.
Index reviews
The rules and mechanisms of constituent changes are completely transparent, and press releases regarding changes can be accessed at the FTSE website (www.ftse.com).
Index constituents are usually reviewed quarterly by the FTSE Steering Committee, which meets on the Wednesday after the first Friday in March, June, September and December, using the closing prices from the previous Tuesday.
FTSE Group publishes a Reserve List of companies, which is used in the event of an ad-hoc change occurring between scheduled index reviews, such as the result of a takeover or merger. The highest capitalised company on the reserve list when the takeover is declared wholly unconditional will then be included in the index.
The All-Share Index is fully reviewed in December. The constituent changes are implemented on the next trading day following futures and options expiry in the UK (usually the third Friday of the same month).
Understanding the effect of the reviews
A comprehensive analysis of stock price performance and volumes compared to average daily volumes around the effective dates is beyond the scope of this book, but I believe it is important for traders and investors alike to be aware of index changes that may affect stocks that they are interested in, so that they can account for unusual, if albeit temporary, price moves.
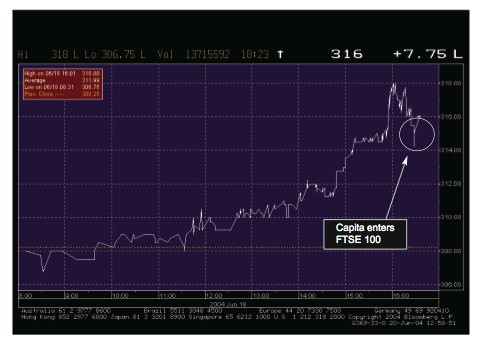
The one-day chart of Capita below, shows a clear run up in the share price leading up to the closing auction on the day before the inclusion of the company in the FTSE 100 was made effective.
Figure 2.53: Capita (CPI) – run up to inclusion in FTSE 100
Used with permission from Bloomberg L.P.
As the closing price of a stock is used to determine at what price a company enters or leaves an index, and the closing auction process in the UK usually determines the closing price, institutions can guarantee that they will track an index by dealing in the closing auction.
Unfortunately, leaving at-market orders to execute trades in the closing auction with investment banks, who also have their own internal proprietary trading desks, has been subject to some abuse. The most egregious example was the inclusion of Dimension Data in the FTSE 100 in September 2000, a few months after the SETS auction process was introduced in the UK in May 2000. The stock, which had been trading at around 670p throughout the day, was pushed up 49% to 1000p in the closing auction on the Friday before the stock was due to enter the Index, and a number of traders and hedge funds made a great deal of money shorting the stock to buying it back the following Monday at around 700p. The losers were the tracking funds. The auction process has since been refined to allow time extensions, so more liquidity can be provided by the marketplace, and the situation is unlikely to occur again.
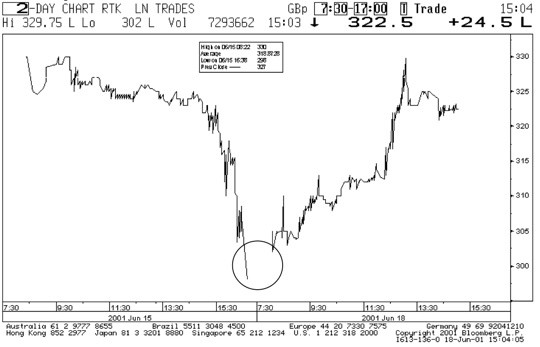
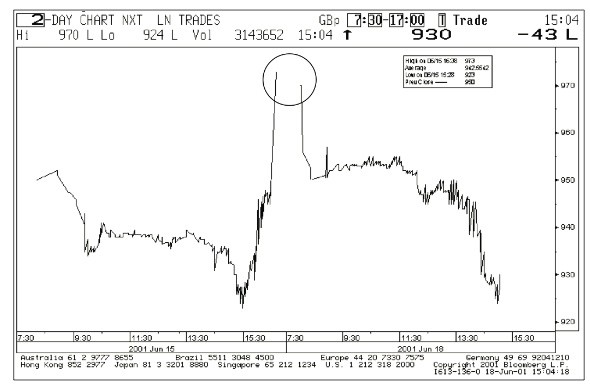
The following charts clearly identify the influence of flows from tracking funds on two stocks around implementation of the changes in the FTSE 100 Index constituents after the June 2001 index review. Here, Railtrack was removed from the FTSE 100 and Next added, with effect from the closing auction on 15 June.
Figure 2.54: Railtrack (RTK) – effect of removal from FTSE 100
Used with permission from Bloomberg L.P.
Figure 2.55: Next (NXT) – effect of addition to FTSE 100
Used with permission from Bloomberg L.P.
Investability changes
Companies with a limited free float may be included in indices, but not with their full weighting, so index funds only have to maintain a weighting proportional to the free float. Investability weightings are banded according to free float, such as 25%, 50% and 75%.
FTSE downgraded Liberty International’s investability weighting from 100% to 75% in September 2003, and the flow created by tracking funds was evident in the unusually heavy trading activity in the week leading up to the change taking effect. Average daily trading volume in the week was 3.4m shares against a long-term daily average of 1m shares. Tracking funds would have had to sell a quarter of their holdings to maintain the correct weighting.
Investability weightings are banded and to qualify for a full weighting, not less than 75% of the shares must be free float, i.e. not owned by founders, family and/or directors. The decision was reversed after an appeal by the company, and the shares appreciated significantly in the lead up to the 100% band being reinstated on 22 December.
Figure 2.56: Liberty International (LII) – investability weighting change

Used with permission from Bloomberg L.P.
MSCI changes
Morgan Stanley Capital International is the leading provider of equity, fixed income and hedge fund indices. Over $3tn of funds are believed to be benchmarked against MSCI’s global indices, with MSCI’s Europe Index consisting of around 530 companies.
Membership decisions are based on a combination of factors, including:
- • the free float of a company’s shares in issue;
- • the average daily volume;
- • market capitalisation; and
- • the existing representation of the company’s industry group and home country in the MSCI indices.
The MSCI full country index review occurs once per year around May, and is a systematic re-assessment of the various dimensions of the equity universe.
On 11 May 2004, MSCI announced that fourteen stocks would be added to the MSCI United Kingdom Index. The performance between the announcement and implementation (28 May) is detailed in the table following, with the FTSE 100 and FTSE All-Share included for comparison.
Table 2.8: MSCI UK Index changes – May 2004
| 11-May | 28-May | Change | |
| Arriva | 379 | 389.5 | 2.70% |
| Bellway | 718 | 755 | 5.20% |
| Cookson Group | 41.25 | 43.25 | 4.80% |
| HMV Group | 229 | 235.5 | 2.80% |
| ICAP | 266.5 | 283.5 | 6.40% |
| Inchcape | 1500 | 1575 | 5.00% |
| Intertek Group | 509 | 541 | 6.30% |
| London Stock Exchange | 355.25 | 376.5 | 6.00% |
| Marconi | 550 | 651.5 | 18.50% |
| Meggitt | 246 | 251.25 | 2.10% |
| National Express Group | 684 | 696.5 | 1.80% |
| Premier Farnell | 250.5 | 242 | -3.40% |
| Punch Taverns | 469.5 | 513 | 9.30% |
| Trinity Mirror | 608.5 | 620 | 1.90% |
| FTSE 100 Index | 4455 | 4431 | -0.50% |
| FTSE All-Share | 2210 | 2202 | -0.40% |
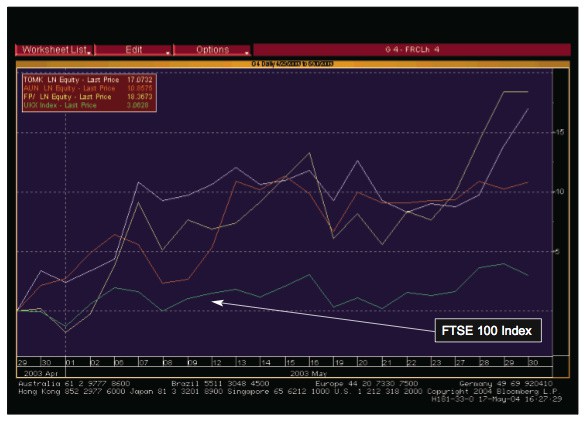
A similar theme was evident in 2003, when the five largest additions to the UK MSCI Index (with performances over the relevant period included in brackets) were:
- • Alliance Unichem (+11%)
- • EMAP (+8.6%)
- • Friends Provident (+18%)
- • Liberty International (+11.3%)
- • Tomkins (+17%)
All of the additions outperformed the FTSE 100, which rose 3% during the same period between announcement and implementation (29 April to 30 May).
Figure 2.57: Relative performance of new additions to the MSCI UK Index
Used with permission from Bloomberg L.P.
Hedge fund strategy
A strategy utilised by hedge funds and traders in the UK is to buy a basket of the stocks that are due to enter the indices a few days before the changes are effective, and to sell an appropriate number of FTSE 100 futures against the basket as a hedge. Each FTSE 100 future hedges a value equivalent to ten times the index (as the multiplier on the contract is £10), so one future sold at 4700 is equivalent to hedging £47,000 in stock. The strategy will be successful if the basket of stocks (which can be equally weighted) outperforms the relevant index over the time period. The position is usually unwound close to the effective date.
As with most strategies that involve anticipating stock moves based on significant flow from index changes, the more arbitrage capital that chases the situation, the lower the returns are likely to be. Companies reporting in that period should also be avoided. (When I put the trade on, I avoided taking a position in Premier Farnell, which was due to report the day before the final effective date, and I also delayed establishing the basket until after ICAP had reported its scheduled results.)
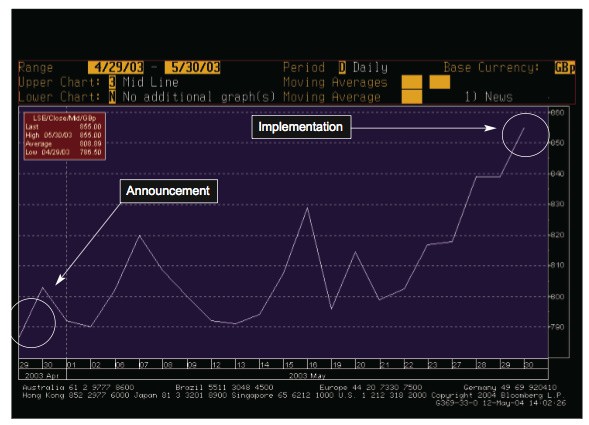
The performance of EMAP in 2003 between the announcement of its entry to the MSCI Indices and its actual inclusion can be clearly seen in the chart.
Figure 2.58: EMAP (EMA) – enters MSCI UK Index
Used with permission from Bloomberg L.P.
Sector switches and re-ratings
Stocks can sometimes be re-rated when reclassified to another sector, as different sectors generally trade on different multiples. Such reclassifications may follow disposals by the company of subsidiaries or a demerger.
Similarly, a move in a primary listing from a smaller country to a major economy, or more liquid market such as the US, where the market or sector trades on a higher multiple, may result in an upward revaluation, and where there is access to more specialist investors. Gaining a higher profile, or exiting a heavily regulated or highly taxed jurisdiction, may be another reason, although changes in primary listing may crystallise tax liabilities and induce selling by domestic funds, as they are unable to invest overseas.
In 2004 the management of News Corp, Australia’s largest company, proposed to move its domicile and primary listing to the US. Generally, a non dual-listed company cannot be double counted in indices in two markets, and the move resulted in significant stock flows as Australian tracking funds sold out and US funds bought in. Indeed, News Corp’s shares fell nearly 5% in June 2004 when Standard and Poor’s confirmed that it would exclude News Corp from its local indices, despite lobbying from investors and the Australian Stock Exchange.
In the UK, moving down to AIM may result in lower listing fees, but may incur forced selling by funds and individuals who cannot invest in AIM stocks. (Note: AIM stocks cannot be held in an ISA.)
Credit rating changes
Long-term debt is divided into investment grade and non-investment grade (junk); the differentiation between the two levels is significant.
Rating changes from the agencies are released at all times of the day and can have an effect on a share price, particularly if the company is heavily geared or the rating change has not been anticipated by the equity or bond markets. Downgrades can result in companies having to pay more interest as a result of bond covenants; upgrades may result in a reduction in the effective interest rate bill. In addition the ability of insurance companies to write certain types of general insurance is dependent on the maintenance of appropriate credit ratings from the rating agencies (one reason why RSA had a rights issue).
One measure of a company’s likely credit rating is its net debt/EBITDA ratio. Companies with a ratio higher than around 3.5 risk being downgraded to non-investment grade, although simply reducing the ratio below this level will not necessarily restore the rating; an improvement to as much as 2.5 may be needed to reverse the downgrade.
Rating changes will often be anticipated by the market
This stickiness means that the market will often be ahead of the agencies, and a change in rating may not have a dramatic effect when announced, as it has already been anticipated.
BSkyB fell to junk bond status in 2000, and although it only regained its investment grade status late in 2003, the tradeable debt spent most of that year priced as though it had already been upgraded.
Upgrades may make the debt accessible to a new pool of capital and wider range of investors, as not all investment grade managers are allowed to hold junk bonds. When a company is upgraded, it may be included in investment grade indices used as benchmarks, creating additional demand for the debt.
Moving from junk to investment grade, or the reverse, leads to the term cross-over credit. Debt fund managers will often try to anticipate the future rating of a company which is changing its capital structure. If a company is under-geared it may seek to boost shareholder returns and optimise its capital structure by taking on more debt, simultaneously moving down the credit curve and incurring a lower credit rating.
Companies may also be put on Creditwatch (S&P) or Review (Moody’s), with a negative outlook adopted (for example, previously stable) and be under review.
Rating agencies
The three most influential rating agencies are:
- • Fitch Ratings
- • Moody’s Investor Services
- • Standard & Poor’s Creditwire
Investment grade
With reference to Moody’s rating system, investment grade is rated Aaa, Aa, A or Baa. Each generic rating has a numerical modifier 1, 2, 3 for all classes from Aa though Caa: 1 ranks the debt at the higher end; 2, mid-range; and 3, lower end.
Table 2.9: Comparison of investment grade credit ratings
| Moody’s | Standard & Poor’s | Fitch |
| Aaa | AAA | AAA |
| Aa1 | AA+ | AA+ |
| Aa2 | AA | AA |
| Aa3 | AA- | AA- |
| A1 | A+ | A+ |
| A2 | A | A |
| A3 | A- | A- |
| Baa1 | BBB+ | BBB+ |
| Baa2 | BBB | BBB |
| Baa3 | BBB- | BBB- |
Table 2.10: Investment grade definitions
| Grade | Definition |
| Aaa | Rated best quality with the smallest degree of investment risk |
| Aa | High quality by all standards, and together with the Aaa group, comprise what are generally known as high-grade bonds |
| A | Possess many favourable investment attributes and are regarded as upper-medium grade |
| Baa | Medium grade, neither highly protected nor poorly secured |
Non-investment grade
Non-investment grade (junk) ranges through Ba, B, Caa, Ca and C as follows:
Table 2.11: Comparison of non-investment grade credit ratings
| Moody’s | Standard & Poor’s | Fitch |
| Ba1 | BB+ | BB+ |
| Ba2 | BB | BB |
| Ba3 | BB- | BB- |
| B1 | B+ | B+ |
| B2 | B | B |
| B3 | B- | B- |
| Caa1 | CCC+ | CCC+ |
| Caa2 | CCC | CCC |
| Caa3 | CCC- | CCC- |
| Ca | CC | CC |
| C | C | C |
Table 2.12: Non-investment grade definitions
| Ba | Speculative elements and not well safeguarded |
| B | Generally lacking characteristics of desirable investment |
| Caa | Poor standing and in danger of default |
| Ca | Speculative in a high degree and vulnerable to non-payment |
| C | Lowest rated with poor prospects of attaining investment standing |
Futures and options expiries
Expiry and triple witching
In the UK, index futures expire on the third Friday of March, June, September and December, with index options expiring monthly on the same day. Now that stock options, which have an expiry every month (although different stocks are on different cycles), have been moved from Wednesday to the following Friday as well (although stock option expiry is based on closing prices), the expiry is now a triple witching rather than a double witching. In the US, where single stock futures and options expire on the same day as index options and futures, the expiry is known as quadruple witching.
Calculation of the EDSP
The FTSE 100 Index futures contracts expire at the exchange delivery settlement price (EDSP), which, until recently, was based on the average value of the FTSE 100 Index every fifteen seconds between 10.10 and 10.30 on expiry day, which is always the third Friday of the delivery month.
In November 2004, the London Stock Exchange introduced a new procedure whereby the final EDSP was calculated using an intra-day auction, using the same concept as the closing auction, except that there is no volume check. Expiry now starts at 10.10, with the uncrossing taking place at 10.15, plus a random start time. This new procedure was introduced to concentrate expiry liquidity into a shorter period of time, and to avoid the wild swings that have occurred in the index during previous expiries.
If large index arbitrage positions exist, because the futures contracts have not been rolled over until the next quarterly month, there can be some significant moves during this expiry period.
Large positions may have built up if:
- • The futures contract has traded at a substantial premium to fair value during the life of the contract. There is then likely to be a large long stock position against short futures in the market.
- • Similarly, if the futures contract has traded at a discount, the arbitrage position is likely to be long futures, short stock.
Whichever way the position, the futures leg will cease to exist on expiry if it has not been rolled forward (which may have been difficult if the next month is not trading at an attractive level), so the arbitrageurs will need to unwind the cash position during expiry, hence the heavy level of trading.
September 2002 expiry
The 20 September 2002 expiry saw extraordinary moves rarely seen before, with the index moving in a 309 point range in twenty minutes. Some stocks had even bigger percentage moves.
There have been a number of versions of what actually happened on this day by various commentators, but what appears most likely is that an automated system to execute the stock transactions was incorrectly programmed, and accidentally submitted a basket of stocks to the SETS platform twice without any limits on the price paid. In attempting to correct the situation the program was then reversed, creating a sharp spike back downwards.
A great deal of money was both made and lost on the day by the various market participants. The investment bank that submitted the basket in error lost hundreds of millions of pounds, buying high and selling low. The winners were other member firms that bought low and sold high, sometimes several times over in the same stock within minutes; also benefiting were individual traders with direct access.
As one can imagine, this unnatural market created problems for spread betting and CFD firms over the triggering of stop loss orders left by clients.
Figure 2.59: Gyrations during September 2002 index futures expiry

Used with permission from Bloomberg L.P.