three
The Economics of Equalization
Introduction
The economic rationale for equalization payments from a national level of government to subnational jurisdictions in a decentralized federation framework stems primarily from the desire to realize the benefits from decentralization, without suffering the potential negative consequences. There are good economic reasons that a decentralized form of government such as federalism is desirable, but there are also potential negative side effects, such as inefficient migration as well as vertical and horizontal fiscal gaps. Before this chapter describes the economic rationale for equalization payments, it is thus useful to present the economic rationale for fiscal decentralization.
Following the presentation of the economic rationales for a decentralized federation and, in this context, the economic basis for equalization payments, we discuss some potential negative economic effects of equalization payments. We turn then to some descriptive statistics regarding equalization payments to the provinces and examine whether key relationships are consistent with expectations arising from theoretical considerations. The final section notes outstanding and ongoing issues related to the federal equalization program in Canada.
The economic logic of decentralized federations
A key rationale for decentralization lies in the possible efficiency gains in the provision of public goods and services, reflected in Oates’s (1972) “decentralization theorem.” The principle is that, unless tastes and preferences are completely homogenous across a country, there are benefits to having decentralized government institutions. It is argued that subnational (in Canada, provincial) governments can be more attuned to local priorities, can be better held accountable to their local populations, and will have lower information costs in discerning local needs and the means of meeting them than would a more remote national government. The decentralization theorem thus posits that decentralization results in more efficient public goods provision at the subnational level, compared with all public goods being provided at the national level. These public goods are goods and services that are provided either inefficiently or not at all by the market, due to their characteristics.1 Generally, they can be used or consumed jointly without one person’s use affecting that of others, such as a lighthouse, public art, public safety services, or provincial parks.
Oates (2005) credits the development of the decentralization theorem, central to what he calls first generation fiscal federalism, to the Arrow-Musgrave-Samuelson (AMS) perspective of public economics of the 1950s and 1960s. This perspective is the result of two papers published by Paul Samuelson in 1954 and 1955 on the nature of public goods (Samuelson 1954, 1955), the 1969 conceptualization by Kenneth Arrow of the roles of the public and private sectors (Arrow 1969), and Richard Musgrave’s case for public finance with an active role for government in correcting market failure, achieving an equitable income distribution, and stabilizing the macroeconomy (Musgrave 1959).
The underlying assumption of the decentralization theorem is that governments seek to maximize the social welfare of their constituents, not in the least because of electoral pressures in a democracy (Oates 2005; Vo 2010). Public goods vary in the geographic scope over which their benefits accrue and in the economies of scale in their production. A “perfect mapping” of government level and public goods provision is one in which the jurisdiction of a level of government corresponds to the area over which the benefits of the public goods are realized (Oates 2005). Spillovers and overlapping benefit areas can be addressed through the use of intergovernmental transfers. The geographic mobility of individuals, also known as “Tiebout sorting,” will facilitate the matching of individuals’ public goods preferences with the various public goods bundles available across subnational jurisdictions (Tiebout 1956). Households are likely to be heterogeneous in their preferences with respect to bundles of public goods (at a constant tax price), and thus they will be able to sort themselves into the locations that match their preferences (Tiebout 1956). Households, then, will be better off than if public services (and associated taxes) were the same in every jurisdiction. This idea must be qualified by the consideration of economies of size and scale. If the subnational jurisdiction is too “small” (in geographic or population size) to realize economies of size for a particular good or service, then the cost per person of providing that good or service at that particular level is higher than it would otherwise be.
A second main economic advantage of decentralization is the resulting competition among subnational governments (Hamlin 1991; Qian and Roland 1998; Winer and Hettich 2010). If one subnational government is inefficient in its provision of public goods in terms of their tax costs relative to a neighbouring jurisdiction, then its population may relocate in the direction of greater efficiency. Individuals will “vote with their feet,” a variation of the Tiebout sorting already described above. The threat of inter-jurisdictional migration is an important mechanism for holding subnational governments accountable for their policies. Subnational governments, it is argued, will be motivated to provide public goods efficiently because of the threat of losing their constituents.
An emerging “second-generation theory of fiscal federalism” relies more on public choice and political economy models (Oates 2005, 349; Vo 2010). Political actors pursue their own objectives, a behaviour that is constrained in a decentralized government setting. Subnational governments pursuing their own objectives might consist of them maximizing their budgets, power, and influence (Brennan and Buchanan 1980). Where there are subnational governments that must compete to retain and attract population, this behaviour is constrained. If a subnational government does not provide good government at a competitive tax price, it faces the threat or reality of population out-migration. The more decentralized governments are disciplined by competition, the less likely they are to pursue their own objectives at the expense of their citizens. Nevertheless, as in the decentralization theorem, differences across subnational units and government functions can have benefits that extend beyond the particular jurisdiction being targeted. The presence and size of the spillovers of benefits or costs from one jurisdiction into others are still important considerations in assessing the relative merits of centralized and decentralized governments (Besley and Coate 2003). Where government functions have significant benefits (or costs) in neighbouring jurisdictions, or nationally, the benefits of decentralizing these functions are reduced.
The economic justification for a decentralized government is thus well established. However, as suggested in Chapter 1, it is equally acknowledged that decentralization introduces challenges, including vertical and horizontal fiscal gaps between levels of government (Bird and Tarasov 2004). Horizontal gaps refer to differences in either tax bases or costs of providing public services across subnational units. They can result in varying net fiscal benefits (NFB) across jurisdictions. That is, the quantity or quality of public services provided to residents, per own tax dollar, can be different across subnational units (Boadway and Flatters 1982a; Vaillancourt and Bird 2004). Vertical gaps occur, as described in Chapter 1, when “the federal government’s tax sources are much greater than its expenditure responsibilities whereas, in the provinces, precisely the opposite is the case” (Atkinson et al. 2013, 62).
The economic rationale for equalization payments
The economic rationale for equalization payments in the decentralized federations to be discussed here arises mainly from two main concerns—fiscally induced migration and horizontal inequity.2 In both cases, the theoretical bases are strong and warrant serious and continuing consideration, even though empirical evidence remains mixed. These concepts underlie the design and commitment to equalization programs in most decentralized countries, and should thus be well understood. The absence of conclusive empirical “proof ” of the nature of the influence of these concepts does not negate their value and importance in understanding equalization programs, pointing instead to the need for continuing and improved empirical investigation.
Fiscally induced migration
Fiscally induced migration, which may be one of the unintended negative effects of a decentralized government, is a result of the fiscal horizontal gaps that decentralization generates. Fiscally induced migration is a result not of fiscal policy but rather of underlying differences in the fiscal capacity of subnational units. The basic assumption is that many individuals are at least somewhat mobile, and they make choices regarding where they live and whether or not they are prepared to move from where they live to another location or province. These choices will include comparing expectations of, among other things, employment prospects, income levels, climate, culture, housing costs, family connections, and the available public services relative to the tax cost of living in that province. Migration in expectation of better wages or employment prospects is considered efficient migration, as explained below. If, however, the migration is the result of moving to higher net fiscal benefits, it is considered inefficient. Net fiscal benefits (NFBs) is a term referring to the gap between the public services provided and the taxes due. NFBs may be different across provinces because of differences in tax revenue bases. Interprovincial differences in NFBs can result in fiscally induced migration—migration in response to better public services per tax dollar paid (Boadway and Flatters 1982a, 1982b). Federal equalization grants for the purpose of reducing or avoiding fiscally induced migration will increase efficiency.
To understand what is meant by fiscally induced migration, why it might be a concern, and why equalization payments may be intended to avoid or reduce it, we need to first understand what efficient, or economically desirable, interprovincial migration consists of. Efficient interprovincial migration requires labour to move in the direction of higher productivity, measured by the value of the output produced. If labour productivity is higher in one location than another, then the total value of national production, the size of the national “pie,” as it were, will be increased if labour moves into the higher productivity location. This labour productivity, or more precisely the productivity of the incremental or last worker, is known as the value of the marginal product (VMP). This is simply the value of the contribution that the marginal (the last or the next) worker makes to the total value of production in that location.
As labour moves from lower VMP to higher VMP locations, the productivity levels in both the origin and destination will change. This is the fundamental principle of diminishing marginal productivity. If all else is constant, an increase in the number of workers (a supply shift to the right in the text box, Labour Market Equilibrium, on next page) will lead to a gradual reduction in the value of the VMP that an additional worker contributes. Similarly, as the supply of labour decreases in a region due to out-migration, that region’s VMP increases. The process of migration, then, while increasing the total value of national production, will continue until the VMP in the two locations is equal and there is no longer any employment-related incentive to move. This is efficient migration because it increases the total value of production in the nation.
Labour Market Equilibrium
The graphs below illustrate how labour market equilibrium is achieved across province A and B. Initially, the wages are higher in province A (WA) than in province B (WB). The higher wages (reflecting higher VMP in A) result in labour migration from B to A. As labour moves, the labour supply in B decreases and that in province A increases, denoted in the graphs by the shift of the supply curves. In province B, the shift is from SB1 to SBe. In province A, the increase in labour supply as workers move from B to A results in the labour supply shift there from SA1 to SAe. The supply shift continues until the resulting wage, the outcome of supply and demand (VMP), is equalized across provinces (We). The amount of labour migration from province B to province A = (QB1−QBe) = (QAe−QA1).
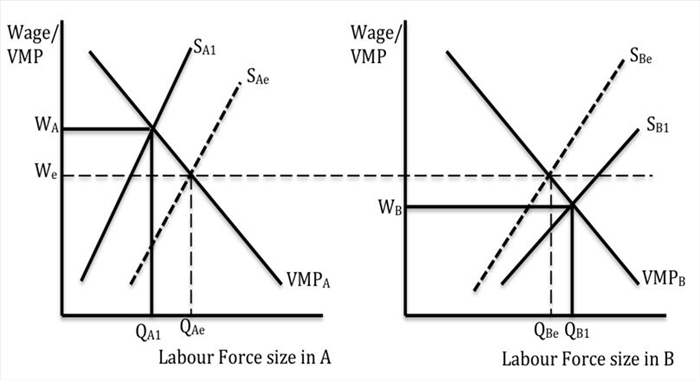
While workers are not likely aware of the details of their VMP, they will know the wage, or income, in their current employment (as well as the local unemployment rate), and they will have some expectations regarding what is likely in terms of wages and employment in a competing location. Wages are generally a reasonable representation of VMP; wage differences are likely important signals that individuals respond to in their location and migration decisions. Firms will pay their employees no more than what they contribute in value to the activity of the enterprise, and if they pay them less, they risk losing employees because they could migrate to a place that will pay them their VMP. So we treat VMP and wages as being very closely related.
What is described above and illustrated in the text box is a highly stylized version of the migration process. There are costs associated with migration, both monetary and personal, that will also be considered, as well as the stability or security of employment (income earning opportunities) in both origin and destination locations. In reality, there may thus be considerable “stickiness” to labour movements.
In the public finance literature, Buchanan (1950) was the first to advance the argument in favour of central government transfers to subnational units for the purpose of equalizing the fiscal capacities of jurisdictions to avoid inefficient labour mobility due to differences in net fiscal benefits (fiscally induced migration). He argued that the different fiscal capacities of subnational units might result in different public services per tax dollar across jurisdictions. In Canada, for example, wealthier provinces may provide more or better health or education services per tax dollar, thus attracting migrants because of lower costing public services rather than higher productivity (reflected in higher wages). The inefficiency that is created when migration occurs in response to differences in the cost of public services, rather than productivity differences, leads to an overall reduction in social welfare (Buchanan 1950; Bucovetsky 1998). Regions with higher labour productivity may then experience labour shortages, as labour is instead attracted to places with lower costing public services, reducing national output by the production not realized by migration to the high productivity region. Equalization payments may be made both to achieve greater equity across jurisdictions and to correct for the economically inefficient migration that would otherwise occur (Bergvall et al. 2006; Boadway and Flatters 1982a, 1982b; Bucovetsky 1998; Flatters, Henderson, and Mieszkowski 1974; Hercowitz and Pines 1991; Martinez-Vazquez and Boex 2001; Mieszkowski and Toder 1983).
Horizontal equity
The second part of the economic rationale for equalization payments from national to subnational jurisdictions is achieving some measure of horizontal equity. Dahlby (2005) argues that, in the Canadian context, horizontal fiscal equity is an important but not a paramount goal, otherwise a unitary form of government would have been chosen. However, horizontal equity has been a concern in Canada from Canada’s inception, as have measures to achieve this equity. In a decentralized country, horizontal equity means, conceptually, that otherwise identical persons should be treated equally in terms of the tax price of public services regardless of where they reside (Boadway 2004). The particular extent to which horizontal equity is desired is not readily determined. In a country as large and heterogeneous as Canada, even though improving horizontal equity may be an ongoing commitment, absolute equity is not likely to be realized.
Boadway (2012) describes horizontal equity as a condition of social citizenship. He argues that, without perfect mobility of the population, residents of rich provinces will have more services per tax dollar than those in poor provinces, violating basic social citizenship equality. Because mobility is less than perfect and the costs of moving (involving both monetary and information acquisition) may be significant, inequality in access to public goods and services is especially concerning. Equalization payments are then intended, in part, to address horizontal inequity because of the imperfect mobility of the population.
Equalization payments for the purposes of addressing horizontal inequities in public services across jurisdictions may take the form of equalizing the revenue capacity of subnational units, rather than equalizing the services directly, especially when there are restrictions on the national government’s activities, as is the case in Canada. As described in Chapter 1, the Canadian constitutional basis for equalization payments refers specifically to the “reasonably comparable revenues” to provide “reasonably comparable services.” Equalization payments are unconditional grants in that it is entirely up to the provinces to decide how the equalization payments will be used in their respective jurisdictions. There is no requirement that the provincial governments use the transfers actually to provide services that are comparable across provinces. To realize the advantages of a decentralized form of government, the Canadian federation has sacrificed perfect equality in the type, quantity, and quality of public services across provinces.
In response to heterogeneous populations, provincial governments will provide different bundles of public services. In addition to the existence of heterogeneous populations, the constitutional division of powers also precludes the federal government from interfering with how the provinces carry out their obligations in their areas of jurisdiction. The grants can thus only be permissive in promoting horizontal equity in public services and taxation.
Included in considerations of improved horizontal equity as a rationale for equalization payments is the insurance that such payments afford against the occasional shocks that disproportionately affect some provinces (Boadway 2012). Equalization payments funded by the federal government can provide the advantage of pooling risks and of delivering better access to capital markets to improve horizontal equity.
Potential negative effects of equalization payments
Although an economic case can be made for equalization payments in Canada, there is considerable debate about the effectiveness of these payments. There is some evidence that equalization payments may not be needed to equalize provincial fiscal capacities, that they may have an effect but not the desired one, or even that they do harm. Understanding these potential challenges is important when assessing Canada’s equalization program.
First, we address the question of whether the payments are needed. It is possible that regional differences in fiscal capacity (often closely related to economic outcomes in a region or province) may be fully capitalized into wages, rents, and prices so that there is “nothing to equalize” (Courchene 2005). If larger tax bases in wealthier regions, for example, coincide with higher wages and higher costs of providing public services, then the higher revenue in a wealthy province does not translate into higher purchasing power or the ability to provide superior services. That is, fiscal capacity differences are capitalized into differences in wages, rents, and prices—thus there is no equalization required. Courchene (2005) points out that the Canadian equalization formula assumes that there is no capitalization. It assumes that an increase in a province’s per capita revenue allows that province to provide proportionally more public goods and services to its residents. But to the extent that prices of public goods and services change with higher per capita revenue, this does not follow. Courchene (2005) provides empirical evidence about the extent to which wage levels in the provinces are positively related to revenues, such that the purchasing power (in terms of public goods provided) of higher revenues is reduced. Though it is unlikely that revenue differences are fully capitalized into higher prices, assuming there is no capitalization (as the Canadian program does) is probably also unrealistic. If the capitalization were accounted for, we would have a better idea of what revenues really represent in terms of the public goods and services they can buy.
Investigations of the direct effects of equalization payments on the distribution of well-being are also informative. Tarroux (2012) revealed that, for most empirical scenarios, equalization payments in Canada have an ambiguous impact on the distribution of the well-being that they are intended to address and that, under some scenarios, equalization payments can actually worsen the inequity of well-being across provinces. Watson (1986) also estimates that the implied welfare gains of equalization payments are very small in Canada.
At the heart of evaluating the effectiveness of equalization payments in preventing or reducing fiscally induced migration is the questions of whether interprovincial migration is at all sensitive to provincial differences in government spending or taxation. If not, then there would be no need for policies and programs (such as equalization) to avert it. The theoretical literature discussed above (Boadway 2004; Buchanan 1950, Bucovetsky 1998; Shah 1997) points to the conditions under which this fiscally induced migration may occur.
In spite of concerted efforts and some rigorous empirical analyses that provide valuable evidence of key relationships, the empirical evidence to support the presence of fiscally induced migration is mixed. On the one hand, weak or non-existent policy-induced interprovincial migration in Canada is reported by Day and Winer (2006), Shaw (1986), and Winer and Gauthier (1982). Mieszkowski and Toder (1983) also estimate that the inefficiencies resulting from a fiscally induced out-migration of capital and labour to natural resource endowed states in the United States would be very small. Bakhshi, Shakeri, Olfert, Partridge, and Weseen (2009) investigate the influence of equalization payments on interprovincial migration from 1982 to 2004, controlling for the persistent relative attributes of the provinces. They find that, at the margin, federal transfers in the form of equalization payments have virtually no impact on net migration patterns. Thus, there is a body of empirical analysis that calls into question the presence of the migration effects of government policy, including equalization payments.
However, researchers using different data and model construction have found empirical evidence that provincial spending does affect migration. Based on the estimation of a model of Canadian interprovincial migration using 1962–81 tax data, Day (1992) finds that migration is influenced by provincial government spending, transfers to persons, and average tax rates. Wilson (2003) shows that migratory flows do respond, albeit sluggishly, to changes in equalization payments, thus leading to welfare gains from Canadian equalization. Shaw (1986) concurs, finding that social security type programs offset “natural” incentives to migrate from low income to high income regions in Canada. Considering overall empirical findings both supporting and refuting the migration effects of government spending, we find weak empirical evidence that interprovincial migration flows respond to either government revenue or expenditure differences. That is, it has not been definitively established that equalization payments are effective in mitigating (questionably existent) fiscally induced migration, though there is reason for vigilance and further investigation.
If equalization payments are not needed or are ineffective but are nevertheless undertaken at considerable public expense, then this use of public funds cannot be defended on efficiency grounds. The relevant question is whether transfer revenue would likely have had a higher return if used for other purposes.
A more sinister outcome is that the equalization payments do have an impact—but not the positive one for which they are designed. There are several potential and unintended negative side effects of federal transfers to provinces, effects that introduce inefficiencies. These may be categorized under the “flypaper effect” or the creation of a “welfare trap.”
In general terms, the “flypaper effect” refers to a specific consequence of subnational governments receiving unconditional grants from a central government in a fiscal federation. Conceptually, it is relatively straightforward to demonstrate that such grants are likely to be spent rather than being passed on to citizens in the form of tax cuts (Dahlby 2011; Gramlich 1977; Hall 2008; Hines and Thaler 1995; Rosen, Wen, and Snoddon 2012). That is, total spending by the subnational government is higher than it would have been if revenues had been raised locally rather than having been received as a grant. In other words, the grant “sticks where it lands”; namely, it stays with the provincial government rather than being passed on to residents. This “sticking where it lands” has spawned the label “flypaper effect.” However, one cannot infer that there is a flypaper effect by looking at per capita spending alone. Empirical evidence of a flypaper effect related to equalization payments, that is, a causal link between higher equalization payments and higher per capita government expenditure, requires that all other factors be held constant. Nevertheless, there is considerable empirical evidence that is consistent with the presence of a flypaper effect (Dahlby and Ferede 2016; Grossman 1990; Hamilton 1986; Hines and Thaler 1995; Inman 2008; Kneebone 2012; Logan 1986, Turnbull 1998; Winer 1983).
Research into the flypaper effect in the context of the effects of equalization payments in Canada ranges from studies positing simple suggestive relationships to rigorous empirical investigations (Courchene 1970; Crowley and O’Keefe 2006a, 2006b; Dahlby and Ferede 2016; Ferede 2014; Kneebone 2012; Shah 1997). The argument is as follows. The arrival of transfers from the federal government directly to residents of the provinces would be just like any other increase in income. We would expect to see the residents’ use of the income (the expenditure distribution between private goods and public goods) to be similar to already existing public/private expenditure proportions (Bradford and Oates 1971; Hines and Thaler 1995). When the provincial governments (rather than residents) receive the transfers from the central government, there may be other outcomes. If provincial governments, as a result of receiving federal transfers, increase public spending so that the public/private spending proportion increases, a flypaper effect may be suspected. However, to establish a cause-effect relationship empirically requires a rigorous analysis well beyond simply comparing per capita government spending. In the case of Canada’s equalization payments, Ferede (2014) finds evidence of a flypaper effect specifically for health spending in Canada, though not for other provincial spending. Similarly, Kneebone (2012) finds empirical evidence that provincial government spending in Canada is greater when the revenue arrives in the form of equalization transfers rather than when it is the result of local taxation—evidence of a flypaper effect. The implied inefficiency is due to the fact that the spending patterns that result from the equalization grant being paid to provincial governments are different from those desired by residents (as reflected in residents’ spending patterns if they received the transfer payments directly).
The creation of a “welfare trap” is a second category of the possible negative side effects of equalization payments in Canada. The welfare trap discussion concerns itself with the potential interference of equalization payments in efficient interprovincial migration—migration in the direction of higher productivity (Courchene 1970, 2005). Persistently below average incomes in some regions may be an unintended side effect of federal transfers if receipt of these transfers inadvertently provides incentives for provincial governments to make decisions that maximize transfer receipts at the expense of decisions focused on long-run growth, leading to a greater dependency on such payments. The long-run effect is that the recipient region becomes less and less attractive as a place of residence and investment because of the indirect and unintended fiscal consequences of federal transfers (Dahlby 2002; Glaeser, Kolko, and Saiz 2001; Myers 1990; Polèse and Shearmur 2006).
In the regional economics literature, inadvertently interfering with productivity-enhancing migration is a strong argument against policies that target locations, or “places,” rather than people. When transfers are attached to places, they create a barrier to mobility—individuals considering migration could be discouraged from doing so because they would not be able to take the benefits of the place-specific subsidy with them (Bolton 1992; Olfert et al. 2014; Partridge and Rickman 2008). People-based transfers would not interfere with mobility because individuals who are mobile can take the benefits of the transfer with them.
In summary, the empirical evidence in the literature regarding the effects of equalization payments from the federal to the provincial governments in Canada is mixed. This is at least in part because it is difficult to construct the counterfactual situation—what would interprovincial migration, productivity, public goods provision, and inequality have been like in the absence of equalization payments? To a large extent there has always been horizontal fiscal redistribution in Canada. It emerged long before the creation of the equalization program in 1957 (Courchene 1984). Further, the various unintended effects (if present) could be offsetting, such that, for example, equalization payments could both result in distortionary provincial spending and also help to stem fiscally induced migration. Horizontal equity may be achieved at the expense of reduced national productivity because of created barriers to migration, though migration effects are likely different for different age, education, and income cohorts. Although the precise effects of equalization payments are difficult to disentangle, it is important to be aware of what problems these transfers are intended to address, and what are their potential and unintended side effects.
Descriptive statistics on regional inequality and equalization payment effects
This section turns to some simple descriptive data concerning equalization payments in Canada from 1980–81 to 2015–163 fiscal year, including payment amounts, the conditions triggering payments, and possible effects. These simple statistics cannot be the basis of conclusions regarding the previously described theoretical or potential effects of equalization payments. That task is well beyond the scope of this chapter. However, they can be instructive by showing whether the descriptive statistics are or are not consistent with expectations arising from the theoretical literature and past empirical findings.
Beginning with aggregate and per capita equalization payment amounts, we next offer a descriptive overview of regional heterogeneity among the Canadian provinces using several economic indicators. This overview is of interest both to illustrate inequality among the 10 provinces and to examine whether there may be convergence over time, as may be expected if migration is efficient. Third, a description of interprovincial migration and international immigration is offered to address the issue of the mobility of labour in response to differential economic opportunities. Fourth, the per capita revenues and expenditures of provincial governments are provided as evidence of the provincial governments’ differing fiscal capacities and the possible relationships of these capacities with migration patterns. The chapter concludes with a brief discussion of ongoing and outstanding issues.
Equalization payments4 in Canada, 1980–81 to 2015–16
Although per capita equalization payments (see Appendix Table A.2) provide a more accurate understanding of equalization payment in Canada, an overview of total equalization payments by destination province is presented in Figure 3.1.5 In both of the years shown, 1980 and 2015, about half of total payments have gone to Québec (QC). Over the 1980–81 to 2015–16 time period, the smallest percentage going to QC was 38 per cent in 2004–05, and the largest was 60 per cent in 2008–09. However, most years fall into a narrow band of 45–55 per cent. The percentage of total equalization payments going to any province will, of course, reflect not only conditions in that province but also conditions in the other provinces, as well as the size of the province. As other provinces move into or out of the recipient and non-recipient categories, the remaining provinces’ proportions are also affected. The low 2004–05 percentage for QC was also the year that Saskatchewan (SK) moved from being a non-recipient province in the preceding year to being a recipient province, capturing 7 per cent of aggregate equalization payments in that year. In 2008–09, when QC received 60 per cent of equalization payments, Newfoundland and Labrador (NL), SK, and British Columbia (BC) had all moved into non-recipient status.
Figure 3.1 Percentage distribution of equalization payments in Canada, 1980–81 and 2015–16
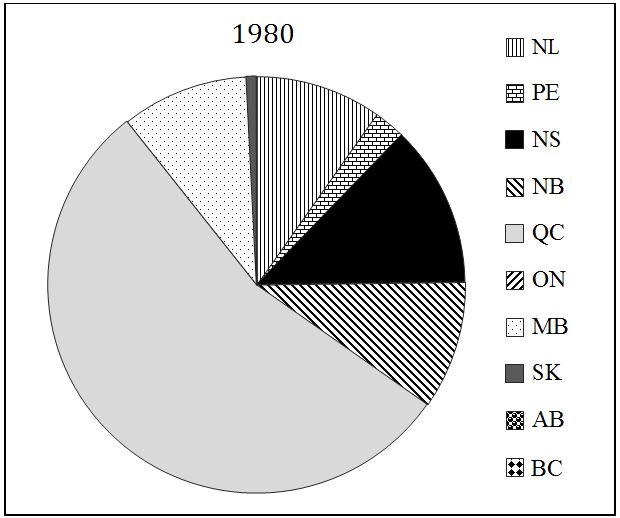
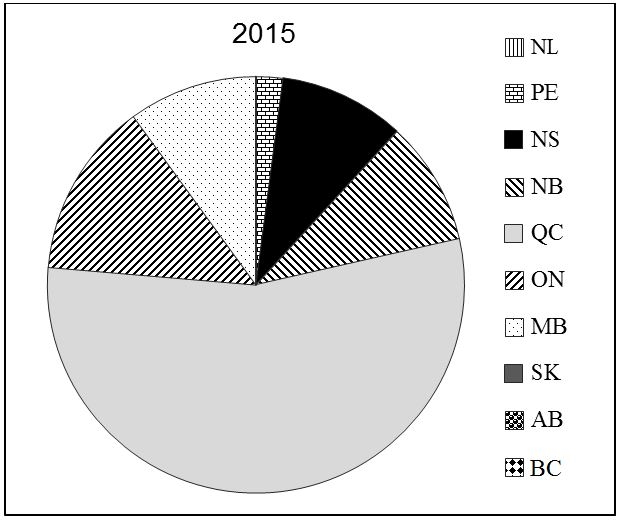
Source: Department of Finance Canada (2015, 2016) by request. An earlier version also appears in Olfert (2016).
Provinces that have received equalization payments in each of the 36 years represented in these data include Prince Edward Island (PE), Nova Scotia (NS), New Brunswick (NB), QC, and Manitoba (MB), as shown in Appendix Table A.1. NL received equalization payments continually from 1980–81 to 2007–08, but it has been a non-recipient province since then. Alberta (AB) has never received equalization payments over this period, and Ontario had never been a recipient until 2009–10. SK has received payments in 22 of the 36 years under review, and BC in only 7 of the 36 years.
The percentage distribution of payments shown in Figure 3.1 and Appendix Table A.1 are, however, somewhat deceiving because they reflect not just the economic conditions and fiscal capacity of provincial governments but also the population sizes of the provinces. QC, for example, accounts for close to one-quarter of Canada’s population, so revenue shortfalls in that province would elicit much larger aggregate payments than they would in a small province such as PE, which has less than one-half of 1 per cent of the national population. Per capita payments, rather than absolute amounts, are thus a more meaningful representation of the amount of equalization payments going to the provinces. Figure 3.2 and Appendix Table A.2 show that the recipients of the highest levels of per capita equalization payments have always been either PE or NL. PE placed first from 1980–81 to 1984–85 and again from 2002–03 to the present. In between, from 1985–86 to 2001–02, NL was the highest per capita recipient. In the most recent year, 2015–16, the per capita equalization payment was $2,465 in PE, followed by $2,214 in NB, $1,792 in NS, and $1,344 in MB. QC’s per capita equalization payments were relatively low at only $1,152. Historically, QC’s per capita payments have been less than half those of the highest provincial amounts, and always less than the per capita payments to PE, NB, and NS. Also, except for five early years (1982–83 to 1986–87), QC’s per capita payments have been below those of MB.
Figure 3.2 Per capita equalization payments, constant dollars, 1980–81 to 2015–16
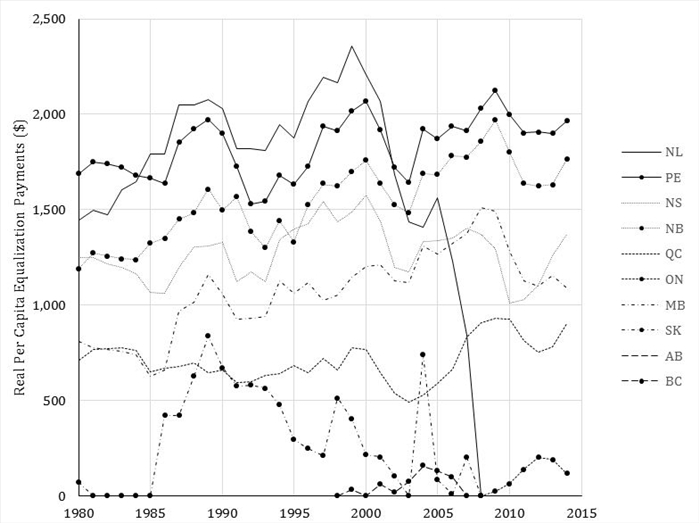
Source: Department of Finance Canada; Statistics Canada CANSIM, Table: 051–0001 Estimates of Population. An earlier version also appears in Olfert (2016).
Only recently a recipient of equalization, ON received very small per capita payments ranging from $27 per capita in 2009–10 to $243 in 2012–13. However, with well over one-third of Canada’s population, even those low per capita payments translate into a large budgetary commitment for the federal government, as shown in Figure 3.1. Like ON, BC, when it did receive payments in 7 of the 36 years, was provided small per capita payments, ranging from $17 in 2002–03 to $164 in 2004–05.
Inequalities in provincial economic conditions
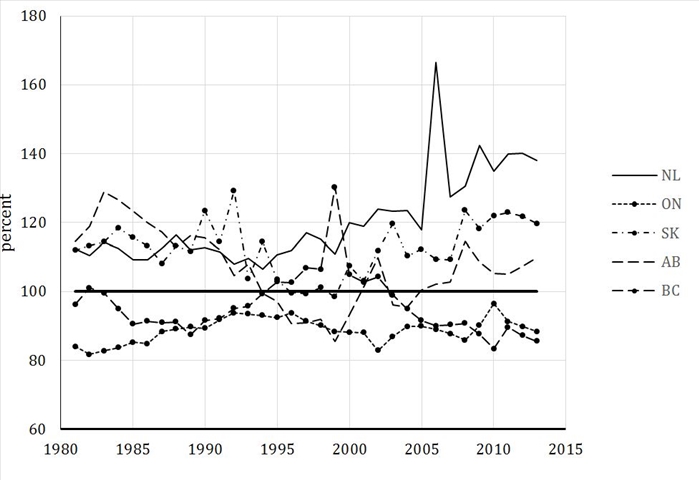
The horizontal equity basis for equalization payments may be approximated by several indicators. Gross domestic product (GDP) per capita, the broadest measure of a jurisdiction’s economy, varied from $35,071 (in 2007 dollars) in PE to $77,680 in AB in the most recent year for which information was available (see Appendix Table A.3). In fact, AB’s GDP per capita was more than twice that of PE for every year under review, and it was as high as 2.7 times the PE value in 1980–81. Figure 3.3 shows provincial GDP per capita indexed to the 10-province average in each year.
Figure 3.3 Provincial real GDP per capita, indexed to Canada, 1980–81 to 2014–15
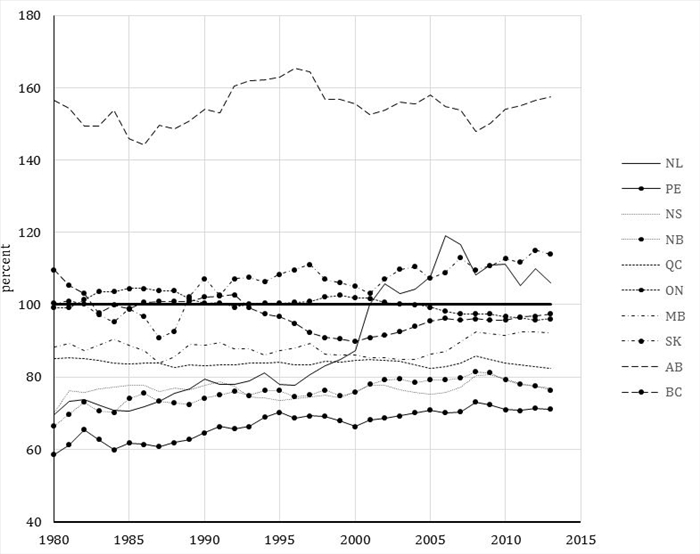
Source: Statistics Canada CANSIM, Table 384–0038: Gross Domestic Product, Expenditure-Based, Provincial and Territorial, Annual (dollars x 1,000,000); Table 051–0001: Estimates of Population. An earlier version also appears in Olfert (2016).
The positions of the provinces in terms of their relative GDP per capita are remarkably stable over time. AB’s per capita GDP is 150 per cent or more of the 10-province average in every year. PE has the lowest per capita GDP in every year, at about 60–70 per cent of the average, with NS and NB just slightly higher. QC’s per capita GDP hovers between 82 and 85 per cent of the average. ON strongly influences the national average because of its dominance in the national economy, and its per capita GDP is thus very close to the average, as is BC’s.
Two exceptions to this pattern of stability are NL and SK. NL is the major “success story” starting at 70 per cent of the 10-province average and rising to 119 per cent in 2007–08, though falling back to 106 per cent by 2014–15. SK exhibits more modest relative growth over this interval, with per capita GDP at the national average in 1980–81, rising to 114 per cent by 2014–15. Both of these provinces have experienced growth due to high oil prices since about 2000. Both provinces’ relative strength was negatively affected by the steep fall in oil prices that began in late 2014.
In spite of this high degree of stability in per capita GDP relative to the national average for provinces other than NL and SK, careful observation suggests very modest convergence over time for PE, NS, NB, and MB. Comparing the 1980–81 and 2013–14 end points, the gap between their per capita GDP levels and the 10-province average is, in most years, closing very slowly over time. This stands in contrast to QC, where there is minor divergence from the average over time, with QC beginning at 85 per cent of the national average in 1981 and falling to 82 per cent in 2014.
Another and perhaps more accurate indicator of economic well-being is household disposable income, that is, income to persons remaining after taxes and including transfers. Disposable income reflects what is actually received as net income by residents, rather than just the value of production, some of which may flow to government and out of the country.6 Figure 3.4 shows relative per capita household disposable income relationships among the provinces, as was done for the GDP in Figure 3.3. The Canadian average is used as the base to which each of the provinces is indexed to reveal relative values over time.
Figure 3.4 Provincial household disposable income per capita, indexed to Canada, 1980–81 to 2014–15
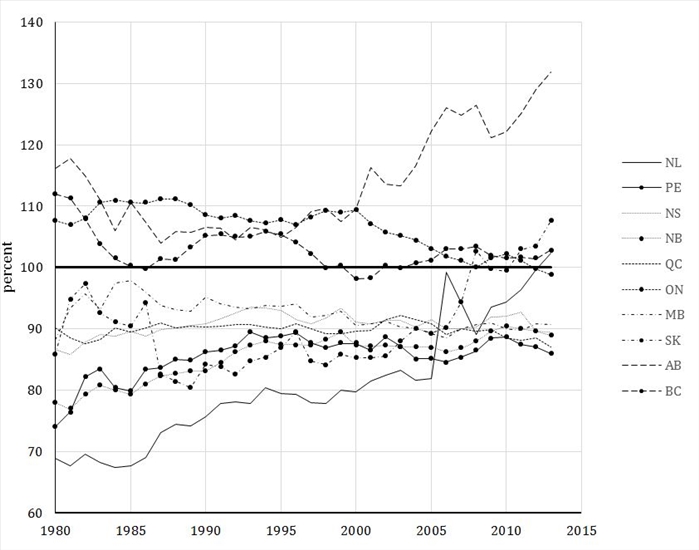
Source: Statistics Canada CANSIM, Table 384–5000: Data on Long-Run Provincial and Territorial Economic Performance, Annual. An earlier version also appears in Olfert (2016).
With the exception of AB, there has been considerable convergence over time toward the Canadian average. Excluding AB, the range of indexed values varied from 68 (NL) to 112 (BC) in 1980–81 and decreased to a range between 86 (PE) and 108 (SK) in 2013–14. The equalizing effects of taxes and transfers reduced inequality among provinces overall, although since about 2000, AB diverged sharply from the average driven by the combination of its high GDP per capita and low tax rates. By 2013, AB’s indexed per capita household disposable income was 132, or 32 per cent above the national average. In that last year, per capita household disposable income in SK was 8 per cent above the national average.
The third major oil producing province, NL has had a somewhat different experience. NL had the lowest per capita disposable income of all the provinces from 1980–81 to 2005–06, ranging from 68 per cent of the national average to 82 per cent, even though its GDP per capita exceeded the national average as early as 2001–02. Only in the last year shown here, 2013–14, did NL’s per capita disposable income exceed the national average. Viewed over the entire period, 1980–81 to 2013–14, NL’s per capita disposable income increased dramatically from 68 per cent to 102 per cent of the national average. The oil-based economic boom translated into increases in disposable income in NL, SK, and AB, though the levels are somewhat different due to differences in provincial government financial commitments and obligations.
To the extent that relative economic conditions among the provinces translate into differences in provincial government revenues, a substantial degree of horizontal inequity is present, especially in terms of GDP. Viewed from the perspective of household disposable income, however, this inequity is mostly decreasing. Possible exceptions to the convergence are AB and, since about 1995, QC and the Maritime provinces, where, in both cases, per capita incomes have stabilized at about 90 per cent of the Canadian average.
Migration responses to regional economic differences
Both interprovincial migration and international immigration would be expected to reflect the decisions of individuals to move to locations with higher (real) wages, lower unemployment rates, better weather, and better public services, all else being constant. To the extent that migration does occur in response to economic incentives, migration is efficient and would contribute to the equalizing of employment and incomes among the provinces over time.
Moving to better economic opportunity would be consistent with moving to AB and, more recently, to SK and NL. Based on the economic indicators presented above, we would expect net out-migration from the Atlantic provinces (except NL after 2002), QC, and MB. In the case of QC, the language difference may pose a barrier to mobility not present elsewhere (Bakhshi et al. 2009). If moving to better weather is a factor, then we might see net positive migration to BC even though its economic indicators are very near the national average.
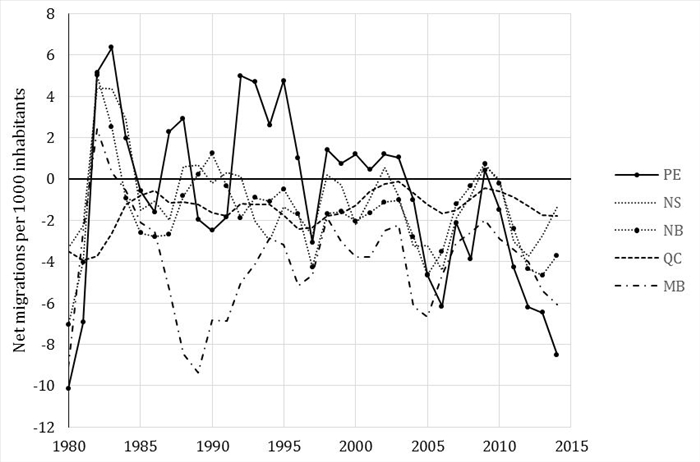
Figure 3.5 and Appendix Table A.5 show the net interprovincial migration per 1,000 inhabitants over our study period. Because of the high volatility and similarity of net interprovincial migration rates, the data are presented in two panels, a and b. Panel 3.5a includes those provinces where we might expect positive net migration rates if migrants flow to better economic opportunities (based on the most recent year). Included are NL, ON, SK, AB, and BC, even though NL’s experience is positive relative to the national average only after 2000. This first group represents currently non-recipient provinces in terms of equalization payments, though NL has been a part of this category only since 2008. Panel 3.5b shows those provinces where we would expect more or less consistently negative net interprovincial migration, that is PE, NS, NB, QC, and MB, those provinces with relatively low disposable incomes and also provinces that consistently receive equalization payments.
Figure 3.5 Interprovincial migration per 1,000 inhabitants, 1980–81 to 2014–15
a. Provinces NL, ON, SK, AB, and BC
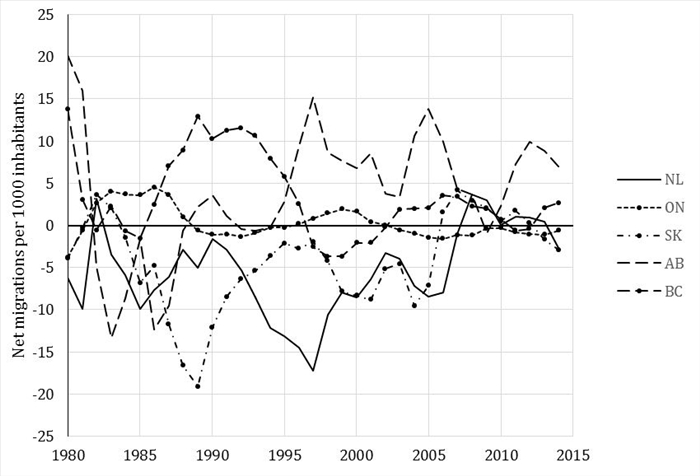
b. Provinces PE, NS, NB, QC, and MB
Source: Statistics Canada CANSIM, Table 051–0004, Components of Population Growth. An earlier version also appears in Olfert (2016).
From Figure 3.5a, it is clear that AB does indeed have positive net interprovincial migration for most of the years since the mid-1990s. However, it is also clear that, during the previous collapse in oil prices (1982–83 to 1988–89) and again during the 2009 recession, net interprovincial migration to AB was negative. Just as booms bring in-migrants on net, the subsequent collapse results in out-migration. Clearly, the relationship between net migration patterns bears a closer positive relationship to per capita disposable income differences than it does to relative GDP per capita. This is as expected because not all of the GDP becomes disposable income. GDP shows the value of production in that jurisdiction, not the incomes received in that province. Owners of capital, for example, may be located in other provinces and countries where they receive their profits and returns to capital. Labour (and population) migration, however, will be more sensitive to after-tax incomes, represented by disposable income.7
NL experienced negative out-migration over virtually the entire time period, which is consistent with NL’s relative disposable income levels until about 2005. NL’s net migration was positive between 2008 and 2013. A similar pattern is seen for SK, where, except for the 2007–12 period, interprovincial net migration has been negative. ON has experienced both positive and negative migration, though overall it is more often positive than negative. The same is true for BC, where high positive net migration rates from 1987 to 1995 were followed by out-migration from 1997 to 2002 before becoming positive again. Though the BC pattern is generally consistent with relative disposable income levels, a milder climate in BC is likely also a factor for in-migration. Based on consideration of relative disposable income alone, the ON net in-migration rate might have been expected to be positive more often.
Turning to the provinces that have generally had relatively poor economic performance, as represented by relative per capita GDP and disposable income levels, most of the net interprovincial migration rates are negative, as expected (see Figure 3.5b). PE has positive rates more often than might be expected. However, the very small population base likely distorts the apparent magnitude of the migration flows. The other consideration is that, in some cases, return migration may be an important factor. There is typically out-migration to areas of better opportunity (AB, for example) during a boom in the destination provinces, but when there is a downturn in the migration destination, return migration occurs. MB has the worst out-migration performance in most years, though it does not have the lowest disposable income levels. QC is consistently negative, though the out-migration rates are low, likely due to language barriers as well as economic conditions (Coulombe 2006).
As is apparent from these figures, net migration patterns are strongly related to relative disposable income levels, though relative income is certainly not the only determinant. As already discussed, climate may be an important consideration, especially for the population outside the employment cohorts. Return migration and considerations such as the size and complexity of the local economy will also affect migration flows.
In addition to interprovincial migration, the destination of international migration will also reflect the relative economic conditions across provinces. The data show, however, that immigration flows are likely less sensitive to interprovincial differences in GDP or disposable income and more sensitive to the size and diversity of the existing populations. ON had the highest number of immigrants per 1,000 inhabitants for most years up to 2007–08, closely followed by BC (see Appendix Table A.6). AB was usually in third place, though often it was matched, and sometimes surpassed, by QC.
The combination of the recession beginning in 2008 and the high price of oil up until the fall of 2014 modified international immigration patterns during the 2008–14 period. AB and SK matched or exceeded ON and BC during these years. It remains to be seen how lower oil prices since 2015 will affect immigration patterns and other socio-economic indicators. Perhaps most surprising, in light of the economic indicators already discussed, is MB’s performance in terms of immigration. From 2008–09 to 2014–15, MB had the highest number of immigrants per 1,000 inhabitants. Deliberate provincial-level immigration policies and programs are likely responsible for this performance.
Provincial government revenues
Canada’s equalization program is, of course, focused on the fiscal capacity of the provinces, not on GDP or disposable income differences, though government revenue is certainly related to major economic indicators. Figure 3.6 shows provincial government per capita revenues over the 1980–81 to 2015–16 period for the two groups of provinces shown above, which roughly represent recipient and non-recipient provinces. To the extent that economic conditions, as reflected in GDP per capita, will be positively correlated with government revenues, we would expect relative per capita government revenues to reflect relative per capita GDP patterns closely.
Figure 3.6 Per capita provincial government revenue (excluding equalization payments), indexed to the 10-province aggregate level, 1981–82 to 2013–14
a. Provinces NL, ON, SK, AB, and BC
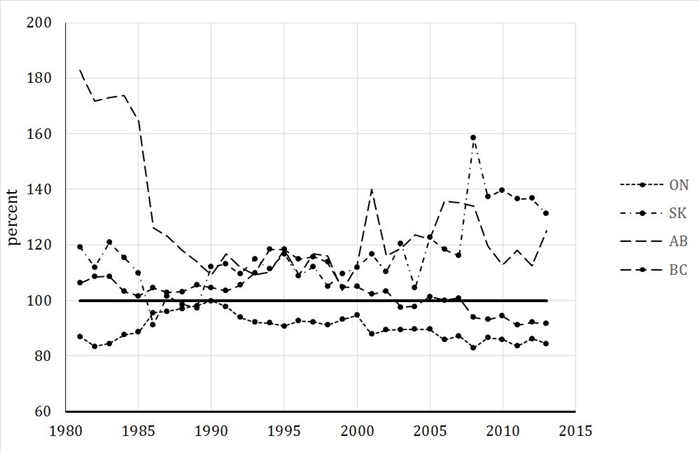
b. Provinces PE, NS, NB, QC, and MB
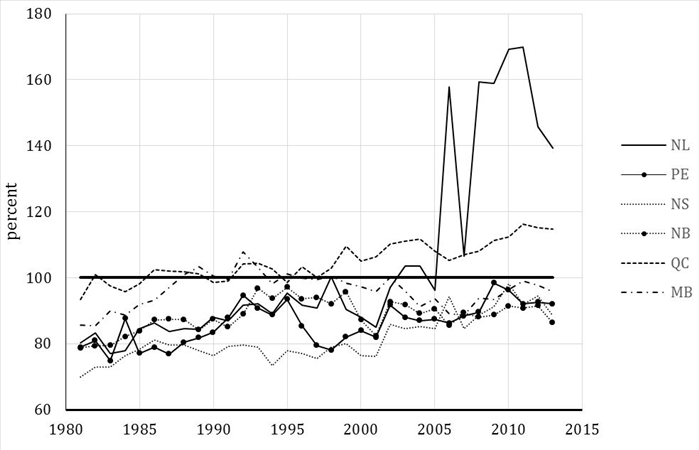
Source: For 1981–88, Statistics Canada CANSIM, Table 384–0004: Government Sector Revenue and Expenditure, Provincial Economic Accounts, Annual (dollars); for 1989–2009, Statistics Canada CANSIM, Table 385–0002: Federal, Provincial and Territorial General Government Revenue and Expenditures; and for 2007–13, Statistics Canada CANSIM, Table 385–0034: Canadian Government Finance Statistics (CGFS).
Indexed per capita provincial government revenues (excluding equalization payments) are shown in Figure 3.6 and in Appendix Table A.7. For ease of presentation, as with Figure 3.5 showing interprovincial migration, Figure 3.6a includes provinces that have been largely non-recipients (ON, SK, AB, BC, and NL because of its recent ascent to the non-recipient category), and Figure 3.6b shows PE, NS, NB, QC, and MB, the consistently recipient provinces. In all cases, each province’s revenue is indexed to the 10-province aggregate. It should be noted that these data depict actual revenues, as per the provincial accounts, not revenue capacity as measured in the equalization formula. The revenues shown here are the result of applying actual provincial tax rates to their tax bases. In the equalization formula, average national tax rates are applied to the provincial tax base to arrive at revenue capacity.
Per capita provincial government revenues in Figure 3.6a show that AB did indeed have per capita revenues above the national average, ranging from 109 to 183 per cent of the national average. NL’s recent change in fortune is very evident, though its revenue also exceeded the national average in 2003 and it remained an equalization recipient province until 2008. In 2011, NL’s per capita provincial government revenue was 170 per cent that of the national average. Somewhat surprising is that, except for 1986, 1988, and 1989, SK’s per capita provincial government revenue exceeded the national average even though this province was a recipient province continuously from 1986 to 2007, except for one of those 22 years. Surprising, in light of its predominantly non-recipient status, ON’s per capita provincial government revenue is below the 10-province aggregate in every year shown here, falling to as low as 84 per cent of the national average. BC’s per capita provincial government revenue is above the national average in most years, remaining fairly close to the average even when it falls slightly below.
Figure 3.6b shows the per capita provincial government revenues for those provinces that have consistently received equalization payments. For the most part, their per capita revenues are indeed below the national average, with NS being among the lowest, often less than 80 per cent of the national average. Perhaps somewhat surprising is the fact that QC’s per capita revenue is above the national average in most years, even though it has always been a recipient province. This circumstance likely reflects the fact that QC has chosen to have a bigger government sector, with higher tax rates, than most of the other provinces. MB’s per capita revenue remains close to the national average, though slightly below.
There is clearly some difference between a province’s relative position in terms of per capita government revenue and whether it received equalization payments or not. This difference is a reflection of differing tax policies among the provinces, variations in the tax bases that are included in the calculation over time, differences in costs, and formula changes that have occurred over time in terms of the provinces included in the standard of comparison.
Returning to the issue of the feared fiscally induced migration, we can usefully consider whether the provinces with above average economic outcomes are also those that attract interprovincial migrants. This consideration is not by way of identifying cause and effect, as there will be many influences. However, it is useful to examine the descriptive data to see whether the direction of migration is consistent with what we would expect if there were indeed fiscally induced migration. Using per capita government revenue as an imperfect representation of fiscal capacity, there is, with some exceptions, weak support for the case that provinces with relatively high per capita government revenues are more likely to have positive interprovincial migration, and vice versa. For example, AB has both high revenues and mostly positive interprovincial migration. NS, NB, and MB have below average revenues and mostly negative net migration. On the other hand, SK has mostly above average revenues and for the most part uniformly negative net migration; QC has mostly above average revenue and consistently negative net migration. Rigorous empirical analysis, which is beyond the scope of this book, would be required to sort out the underlying cause-effect relationships.
Provincial government per capita expenditures
Although revenue capacity is targeted directly in the equalization formula, the stated purpose of equalization is, of course, to enable provinces to provide roughly equivalent levels of service for their constituents. Though the “level of services” will be difficult to measure and compare, perhaps some impression of this factor can be discerned from the provincial per capita expenditures, again indexed to the national average. It is acknowledged that per capita expenditures are a very crude first approximation; needs and costs of providing services will also be important in assessing the adequacy of the revenues. Nevertheless, they are a useful starting point for further investigation.
Because revenues are not fully “equalized,” one might expect a lesser ability to provide services on the part of the recipient provinces than the non-recipient provinces, even though the expenditures observed include the use of equalization payments. If, however, expenditures are higher in non-recipient provinces than in recipient provinces, all else being constant, this would confirm the horizontal inequities that would result in lower costing service provision in the non-recipient provinces (and inefficient migration). On the other hand, if per capita expenditures are higher in recipient provinces, there may be cause to consider the reasons for this, including potential issues such as the flypaper effect or the inefficient use of public funds, though a cause-effect inference would require a rigorous analysis well beyond simple descriptive statistics.
Figure 3.7 and Appendix Table A.8 show per capita provincial government expenditures, again for the same two groups of provinces identified above. Figure 3.7a shows per capita provincial government expenditures for the five provinces that have mostly or recently been non-recipients—NL, ON, SK, AB, and BC—while Figure 3.7b shows per capita expenditures for those provinces that have consistently been recipients of equalization payments—PE, NS, NB, QC, and MB.
Figure 3.7 Provincial government per capita expenditures, indexed to the 10-province aggregate level, 1981–82 to 2013–14
a. Provinces NL, ON, SK, AB, and BC
b. Provinces PE, NS, NB, QC, and MB

Source: For 1981–88, Statistics Canada CANSIM, Table 384–0004: Government Sector Revenue and Expenditure, Provincial Economic Accounts, Annual (dollars); for 1989–2009, Statistics Canada CANSIM, Table 385–0002: Federal, Provincial and Territorial General Government Revenue and Expenditures; and for 2007–13, Statistics Canada CANSIM, Table 385–0034: Canadian Government Finance Statistics (CGFS).
The non-recipient provinces might be expected to have higher per capita expenditures, as they are better able to provide services. Figure 3.7a, however, shows that ON has always had per capita expenditures below the national average, ranging from 82 to 96 per cent of the national average. BC has had expenditures below the national levels for 23 of the 33 years, and when these expenditures were above the national average, they were only slightly higher. AB has had higher per capita expenditures for 25 of the 33 years, and SK for 31 years, including the years when SK was a recipient province. NL has always had above average per capita expenditures, more markedly during the latter years when it became a non-recipient. Overall, ON and BC do not exhibit higher than average per capita expenditures, as might be expected if higher revenue capacity was the primary driver. Per capita provincial government expenditure is above average in AB, SK, and NL, including during the years when the latter two provinces were equalization recipients.
The empirical investigation required to establish the reasons for the relative per capita expenditures is well beyond the scope of this book. A rigorous empirical analysis that held all other factors equal, such as economies of size and scale, the cost of providing services in each jurisdiction, and the preferences of the population, would be required to investigate the possible presence of a flypaper effect. The potential negative impact on interprovincial migration, which might indicate a welfare trap, also bears further consideration, but likewise would require a rigorous analysis. Again, the required investigation is well beyond the scope of this book. However, relatively high rates of net out-migration from recipient provinces suggest that people are, in fact, moving to higher employment and income opportunities. Whether the out-migration is muted because of transfers is not clear. With efficient migration in the direction of better economic opportunities, we would expect economic conditions to become more similar across provinces over time. The fact that per capita disposable income is showing some convergence over time is encouraging, though the rate of convergence is slow.
However, interpreting the above expenditure patterns requires consideration of several factors other than economic conditions and revenues, including the sizes of the provinces, both geographically and demographically. Per unit costs of service delivery are undoubtedly higher in large geographic areas with dispersed small populations (e.g., SK). Similarly, a small population, even when it is fairly concentrated, will reduce the ability to realize economies of size and scale in the service facilities as well as in their delivery. In addition, economic booms that drive up labour costs in the private sector will also drive up that component of public expenditures. Some of the per capita expenditure differences are likely the result of differences in the scale and cost of services. In addition, as already noted, a fundamental reason for a federal form of government is to accommodate differences in the preferences of populations across jurisdictions, for example, to accommodate the possibility that residents in some subnational jurisdictions will choose to reside in jurisdictions with larger public sectors.
Outstanding and ongoing issues
Several conceptual as well as practical issues remain unresolved. On the conceptual front, in spite of decades of information about equalization payments and the economic performance of the provinces, it is not clear that fiscally induced migration occurs or, if it does, whether it is serious enough to warrant intervention. Interprovincial migration rates are relatively high and, for the most part, in a direction consistent with movement to higher productivity. Where migration occurs in the direction of greater fiscal capacity, this migration might happen because greater fiscal capacity is correlated with better economic opportunities.
The question of horizontal equity is equally difficult to answer. Clearly, there are inequities in GDP, in disposable income, and in government revenues and expenditures. The fact that there appears to be some convergence in disposable income per capita is encouraging, though this convergence is also partly due to labour mobility in the direction of higher productivity, as well as (possibly) being the effect of government policies such as equalization payments. There is no apparent convergence in per capita provincial government revenues (either before or after equalization) or in per capita expenditures. Concerns that equalization payments might have a flypaper effect or the potential for creating a welfare trap require vigilance and further empirical research.
Historically, virtually all of the changes to the equalization program have been in response to practical budgetary considerations or for political reasons. These practical issues will continue to be important. Although provincial and federal policymakers seem somewhat committed to the 10-province standard, it is currently eclipsed by the federal government’s fixed-pool approach; the standard, however, still underlies the calculations. As economic conditions change, especially in relation to oil prices, the 10-province standard could again become the binding constraint. Questions such as which revenue sources to include, to what extent, and whether to use revenue capacity or actual revenue also seem mostly resolved, though, with the recent return to volatility in resource prices, these issues may resurface. When resource prices are low, there is less pressure to remove non-renewable resource revenues because their inclusion is less consequential. The distinction between revenues from renewable (hydro) and non-renewable (oil) natural resources will likely be open to debate from time to time.
The three-year moving average assessment of revenues, installed to provide stability and predictability, is currently being questioned. Although, in principle, the provision of stable and predictable equalization payments has merit, there is a trade-off between this security and the speed with which equalization payments can respond to downturns in the provincial economies, such as those SK and NL faced in 2016. Special cases and ad hoc exceptions have been made in the past for political reasons, and though they cannot be ruled out in the future, there is some resistance to launching more of these.
The overriding driver of change to the equalization program has been, and will likely continue to be, the federal budgetary implications. If Ontario’s economy and its revenue sources do not recover relative to the average, its continued inclusion as a recipient province will lead to major changes in the equalization formula simply because of the budgetary impact. However, the gradual recovery of Ontario’s manufacturing sector, due, in part, to the lower value of the dollar occasioned by the drop in oil prices may avert this problem; coincidentally, lower oil prices will also result in a lower 10-province standard. Although economic efficiency arguments may underlie the design of the equalization payments program and the empirical investigation of its effects and effectiveness, expediency is likely to continue to be the driver of program design.
References
Arrow, Kenneth J. 1969. “The Organization of Economic Activity: Issues Pertinent to the Choice of Market versus Non-market Allocation.” In The Analysis and Evaluation of Public Expenditures: The PPB-System, edited by the Joint Economic Committee, 91st Cong., 1st sess., 1: 47–66. Washington, DC: United States Government Printing Office.
Atkinson, Michael M., Daniel Béland, Gregory P. Marchildon, Kathleen McNutt, Peter W.B. Phillips, and Ken Rasmussen. 2013. Governance and Public Policy in Canada: A View from the Provinces. Toronto: University of Toronto Press.
Bakhshi, Samira, Mohammad Shakeri, M. Rose Olfert, Mark D. Partridge, and Simon Weseen. 2009. “Do Local Residents Value Federal Transfers: Evidence from Interprovincial Migration in Canada.” Public Finance Review 37 (3): 235–68. http://dx.doi.org/10.1177/1091142109331638.
Bergvall, Daniel, Claire Charbit, Dirk-Jan Kraan, and Olaf Merk. 2006. “Intergovernmental Transfers and Decentralised Public Spending.” OECD Journal on Budgeting 5 (4): 111–58. http://dx.doi.org/10.1787/budget-v5-art24-en.
Besley, Timothy, and Stephen Coate. 2003. “Centralized versus Decentralized Provision of Local Public Goods: A Political Economy Approach.” Journal of Public Economics 87 (12): 2611–37. http://dx.doi.org/10.1016/S0047-2727(02)00141-X.
Bird, Richard M., and Andrey V. Tarasov. 2004. “Closing the Gap: Fiscal Imbalances and Intergovernmental Transfers in Developed Federations.” Environment and Planning C: Government and Policy 22 (1): 77–102. http://dx.doi.org/10.1068/c0328.
Boadway, Robin. 2004. “The Theory and Practice of Equalization.” CESifo Economic Studies 50 (1): 211–54. http://dx.doi.org/10.1093/cesifo/50.1.211.
Boadway, Robin. 2012. “International Lessons in Fiscal Federalism Design.” eJournal of Tax Research 10 (1): 21–48. https://www.business.unsw.edu.au/research-site/publications-site/ejournaloftaxresearch-site/Documents/paper3_v10n1_Boadway.pdf.
Boadway, Robin, and Frank Flatters. 1982a. “Efficiency and Equalization Payments in a Federal System of Government: A Synthesis and Extension of Recent Results.” Canadian Journal of Economics / Revue canadienne d’Economique 15 (4): 613–33. http://dx.doi.org/10.2307/134918.
Boadway, Robin, and Frank Flatters. 1982b. Equalization in a Federal State: An Economic Analysis. Ottawa: Economic Council of Canada.
Bolton, Roger. 1992. “‘Place Prosperity vs. People Prosperity’ Revisited: An Old Issue with a New Angle.” Urban Studies 29 (2): 185–203. http://dx.doi.org/10.1080/00420989220080261.
Bradford, David F., and Wallace E. Oates. 1971. “Towards a Predictive Theory of Intergovernmental Grants.” American Economic Review 61 (2): 440–48.
Brennan, Geoffrey, and James M. Buchanan. 1980. The Power to Tax: Analytical Foundations of a Fiscal Constitution. Cambridge: Cambridge University Press.
Buchanan, James M. 1950. “Federalism and Fiscal Equity.” American Economic Review 40 (4): 583–99.
Bucovetsky, Sam. 1998. “Federalism, Equalization and Risk Aversion.” Journal of Public Economics 67 (3): 301–28.
Coulombe, Serge. 2006. “Internal Migration, Asymmetric Shocks, and Interprovincial Economics Adjustments in Canada.” International Regional Science Review 29 (2): 199–223. http://dx.doi.org/10.1177/0160017606286357.
Courchene, Thomas J. 1970. “Interprovincial Migration and Economic Adjustment.” Canadian Journal of Economics / Revue canadienne d’Economique 3 (4): 550–76. http://dx.doi.org/10.2307/133598.
Courchene, Thomas J. 1984. “The Political Economy of Canadian Constitution-Making: The Canadian Economic-Union Issue.” Public Choice 44 (1): 201–49. http://dx.doi.org/10.1007/BF00124824.
Courchene, Thomas J. 2005. Resource Revenues and Equalization: Five-Province vs. National-Average Standards, Alternatives to the Representative Tax System, and Revenue-Sharing Pools. Working Paper No. 2005–04. Montréal: Institute for Research on Public Policy.
Crowley, Brian Lee, and Bobby O’Keefe. 2006a. Why Some Provinces Are More Equal Than Others. AIMS Special Equalization Commentary Series No. 1. Halifax: Atlantic Institute for Market Studies. http://www.aims.ca/site/media/aims/Equalization1.pdf.
Crowley, Brian Lee, and Bobby O’Keefe. 2006b. The Flypaper Effect. AIMS Special Equalization Commentary Series No. 2. Halifax: Atlantic Institute for Market Studies. http://aims.wpengine.com/site/media/aims/Equalization2.pdf.
Dahlby, Bev. 2002. “The Incentive Effects of Fiscal Equalization Grants.” Paper presented at the AIMS/MEI/FCPP conference, Equalization: Welfare Trap or Helping Hand? Montréal, Quebec, October 25. http://www.iedm.org/files/011025dahlbypaper.pdf.
Dahlby, Bev. 2005. “Review of the Canadian Equalization and Territorial Funding System.” Paper prepared for the Expert Panel on Equalization and Territorial Formula Financing. http://citeseerx.ist.psu.edu/viewdoc/download?doi=10.1.1.500.5208&rep=rep1&type=pdf.
Dahlby, Bev. 2011. “The Marginal Cost of Public Funds and the Flypaper Effect.” International Tax and Public Finance 18 (3): 304–21. http://dx.doi.org/10.1007/s10797-010-9160-x.
Dahlby, Bev, and Ergete Ferede. 2016. “The Stimulative Effects of Intergovernmental Grants and the Marginal Cost of Public Funds.” International Tax and Public Finance 23 (1): 114–39. http://dx.doi.org/10.1007/s10797-015-9352-5.
Day, Kathleen M. 1992. “Interprovincial Migration and Local Public Goods.” Canadian Journal of Economics / Revue canadienne d’Economique 25 (1): 123–44. http://dx.doi.org/10.2307/135714.
Day, Kathleen M., and Stanley L. Winer. 2006. “Policy-Induced Internal Migration: An Empirical Investigation of the Canadian Case.” International Tax and Public Finance 13 (5): 535–64. http://dx.doi.org/10.1007/s10797-006-6038-z.
Department of Finance Canada. 2015. Federal Support to Provinces and Territories. Retrieved October 2015 from http://www.fin.gc.ca/fedprov/mtp-eng.asp.
Department of Finance Canada. 2016. Federal Support to the Provinces and Territories. Retrieved December 2016 from https://www.fin.gc.ca/fedprov/mtp-eng.asp.
Ferede, Ergete. 2014. The Incentive Effects of Equalization Grants on Fiscal Policy. SPP Research Papers No. 7 (23). Alberta: The School of Public Policy, University of Calgary. https://www.policyschool.ca/wp-content/uploads/2016/03/ferede-equalization.pdf.
Flatters, Frank, Vernon Henderson, and Peter Mieszkowski. 1974. “Public Goods, Efficiency, and Regional Fiscal Equalization.” Journal of Public Economics 3 (2): 99–112. http://dx.doi.org/10.1016/0047-2727(74)90028-0.
Glaeser, Edward L., Jed Kolko, and Albert Saiz. 2001. “Consumer City.” Journal of Economic Geography 1 (1): 27–50. http://dx.doi.org/10.1093/jeg/1.1.27.
Gramlich, Edward M. 1977. “Intergovernmental Grants: A Review of the Empirical Literature.” In The Political Economy of Fiscal Federalism, edited by Wallace Oates, 219–39. Lexington: D.C. Heath.
Grossman, Philip J. 1990. “The Impact of Federal and State Grants on Local Government Spending: A Test of the Fiscal Illusion Hypothesis.” Public Finance Quarterly 18 (3): 313–27. http://dx.doi.org/10.1177/109114219001800304.
Hall, Jeremy L. 2008. “The Changing Federal Grant Structure and Its Potential Effects on State and Local Community Development Efforts.” Journal of Public Budgeting, Accounting and Financial Management 20 (1): 46–71.
Hamilton, Jonathan H. 1986. “The Flypaper Effect and the Deadweight Loss from Taxation.” Journal of Urban Economics 19 (2): 148–55. http://dx.doi.org/10.1016/0094-1190(86)90036-7.
Hamlin, Alan P. 1991. “Decentralization, Competition and the Efficiency of Federalism.” Economic Record 67 (3): 193–204. http://dx.doi.org/10.1111/j.1475-4932.1991.tb02546.x.
Hercowitz, Zvi, and David Pines. 1991. “Migration with Fiscal Externalities.” Journal of Public Economics 46 (2): 163–80. http://dx.doi.org/10.1016/0047-2727(91)90002-J.
Hines, James R., Jr., and Richard H. Thaler. 1995. “Anomalies: The Flypaper Effect.” Journal of Economic Perspectives 9 (4): 217–26. http://www.jstor.org/stable/2138399.
Inman, Robert P. 2008. The Flypaper Effect. National Bureau of Economic Research Working Paper 14579. Cambridge, MA: National Bureau of Economic Research. http://dx.doi.org/10.3386/w14579.
Kneebone, Ronald D. 2012. How You Pay Determines What You Get: Alternative Financing Options as a Determinant of Publicly Funded Health Care in Canada. SPP Research Paper No. 12 (21). Alberta: The School of Public Policy, University of Calgary. http://dx.doi.org/10.2139/ssrn.2099844.
Logan, Robert R. 1986. “Fiscal Illusion and the Grantor Government.” Journal of Political Economy 94 (6): 1304–18. http://dx.doi.org/10.1086/261434.
Martinez-Vazquez, Jorge, and Jameson Boex. 2001. The Design of Equalization Grants: Theory and Applications. Washington, DC: World Bank. https://www.researchgate.net/publication/265142703_The_design_of_equalization_grants_Theory_and_applications.
Mieszkowski, Peter M., and Eric Toder. 1983. “Taxation of Energy Resources.” In Fiscal Federalism and the Taxation of Natural Resources, edited by Charles E. McLure and Peter M. Mieszkowski, 65–91. Northampton, MA: Lexington Books.
Musgrave, Richard A. 1959. The Theory of Public Finance. New York: McGraw-Hill.
Myers, Gordon M. 1990. “Optimality, Free Mobility, and Regional Authority in a Federation.” Journal of Public Economics 43 (1): 107–21. http://dx.doi.org/10.1016/0047-2727(90)90053-K.
Oates, Wallace E. 1972. Fiscal Federalism. New York: Harcourt Brace Janovich.
Oates, Wallace E. 2005. “Toward a Second-Generation Theory of Fiscal Federalism.” International Tax and Public Finance 12 (4): 349–73. http://dx.doi.org/10.1007/s10797-005-1619-9.
Olfert, M. Rose. 2016. “Regional Inequality and Decentralized Governance: Canada’s Provinces.” Review of Regional Studies 46 (3): 201–22.
Olfert, M. Rose, Mark D. Partridge, Julio Berdegué, Javier Escobal, Benjamin Jara, and Felis Modrego. 2014. “Places for Place-Based Policy.” Development Policy Review 32 (1): 5–32. http://dx.doi.org/10.1111/dpr.12041.
Partridge, Mark D., and Dan S. Rickman. 2008. “Place-Based Policy and Rural Poverty: Insights from the Urban Spatial Mismatch Literature.” Cambridge Journal of Regions, Economy and Society 1 (1): 131–56. http://dx.doi.org/10.1093/cjres/rsm005.
Polèse, Mario, and Richard Shearmur. 2006. “Why Some Regions Will Decline: A Canadian Case Study with Thoughts on Local Development Strategies.” Papers in Regional Science 85 (1): 23–46. http://dx.doi.org/10.1111/j.1435-5957.2006.00024.x.
Qian, Yingyi, and Gérard Roland. 1998. “Federalism and the Soft Budget Constraint.” American Economic Review 88 (5): 1143–62.
Rosen, Harvey S., Jean-François Wen, and Tracy Snoddon. 2012. Public Finance in Canada. 4th ed. Whitby, ON: McGraw-Hill Ryerson.
Samuelson, Paul A. 1954. “The Pure Theory of Public Expenditure.” Review of Economics and Statistics 36 (4): 387–89. http://dx.doi.org/10.2307/1925895.
Samuelson, Paul A. 1955. “Diagrammatic Exposition of a Theory of Public Expenditure.” Review of Economics and Statistics 37 (4): 350–56. http://dx.doi.org/10.2307/1925849.
Shah, Anwar. 1997. Fiscal Federalism and Macroeconomic Governance: For Better or for Worse? World Bank Working Paper No. 2005. Washington, DC: World Bank. http://dx.doi.org/10.1596/1813-9450-2005.
Shaw, R. Paul. 1986. “Fiscal versus Traditional Market Variables in Canadian Migration.” Journal of Political Economy 94 (3, Part 1): 648–66. http://dx.doi.org/10.1086/261394.
Tarroux, Benoît. 2012. “Are Equalization Payments Making Canadians Better Off? A Two-Dimensional Dominance Answer.” Journal of Economic Inequality 10 (1): 19–44. http://dx.doi.org/10.1007/s10888-010-9152-1.
Tiebout, Charles M. 1956. “A Pure Theory of Local Expenditures.” Journal of Political Economy 64 (5): 416–24. http://dx.doi.org/10.1086/257839.
Turnbull, Geoffrey K. 1998. “The Overspending and Flypaper Effects of Fiscal Illusion: Theory and Empirical Evidence.” Journal of Urban Economics 44 (1): 1–26. http://dx.doi.org/10.1006/juec.1997.2056.
Vaillancourt, Francois, and Richard M. Bird. 2004. Expenditure-Based Equalization Transfers. International Studies Working Paper 04–10. Atlanta: Andrew Young School of Public Policy, Georgia State University.
Vo, Duc Hong. 2010. “The Economics of Fiscal Decentralization.” Journal of Economic Surveys 24 (4): 657–79. http://dx.doi.org/10.1111/j.1467-6419.2009.00600.x.
Watson, William G. 1986. “An Estimate of the Welfare Gains from Fiscal Equalization.” Canadian Journal of Economics / Revue canadienne d’Economique 19 (2): 298–08. http://dx.doi.org/10.2307/135286.
Wilson, L. S. 2003. “Equalization, Efficiency and Migration: Watson Revisited.” Canadian Public Policy 29 (4): 385–96. http://dx.doi.org/10.2307/3552177.
Winer, Stanley L. 1983. “Some Evidence on the Effect of the Separation of Spending and Taxing Decisions.” Journal of Political Economy 91 (1): 126–40. http://dx.doi.org/10.1086/261131.
Winer, Stanley L., and Denis Gauthier. 1982. Internal Migration and Fiscal Structure: An Econometric Study of the Determinants of Interprovincial Migration in Canada. Ottawa: Economic Council of Canada.
Winer, Stanley L., and Walter Hettich. 2010. “Vertical Imbalance in the Canadian Federation.” Paper available from School of Public Policy, Carleton University, Ottawa. http://http-server.carleton.ca/~winers/papers/VFI-Revised-July2-10.pdf.
Footnotes
1 For a more complete definition of public goods, see Rosen, Wen, and Snoddon (2012, 50). Return to text.
2 Dahlby (2005, 2011) quite correctly identifies a third economic justification for equalization in a federal system, namely the potential to design equalization payments in order to equalize the marginal cost of public funds across subnational governments. This third justification will not be discussed here due to the complexity of the argument. Return to text.
3 Although equalization payments date back to the 1957–58 period, the text of this chapter and the figures imbedded in it reflect the 1980–81 to 2015–16 period, due to data limitations. For completeness, the Appendix also includes equalization entitlements, the percentage distribution among provinces, and per capita equalization payments back to 1957–58, as well as data for the most recent 2016–17 period. Return to text.
4 The term, “equalization payments” in this chapter refers to equalization entitlements as calculated by the Department of Finance Canada. Return to text.
5 For more detailed information about the determination of equalization payments, see https://www.fin.gc.ca/fedprov/eqp-eng.asp. Return to text.
6 Appendix Table A.4 shows household per capita income indexed to the national average. Return to text.
7 The relationship between GDP and disposable income is as follows: GDP – depreciation – indirect taxes – retained earnings – corporate income taxes – personal income taxes + transfers to persons = disposable income. Another way to think about this is that GDP is the total value of production occurring in that jurisdiction, while disposable income is what ultimately becomes the discretionary income of individuals, which can then be either spent or saved. Return to text.