ON CORRELATIONS: If a correlation were perfect—for example, if all port cities had Christian congregations before any inland city did—then the correlation between these two variables would be 1.0. If there were no correlation between the two—that is, if they varied randomly with respect to one another—then the correlation would be 0.0. Hence, the closer to 1.0, the stronger the correlation. However, in the real world, correlations of 1.0 are rare. When working with data such as these, a correlation of 0.4 is quite respectable.
|
Table 3-1: Travel and Christianization |
|
|
| ||
|
|
Port cities |
Inland cities |
| ||
|
Had a church by 100 CE |
164% |
124% |
| ||
|
Had a church by 180 CE |
122% |
141% |
| ||
|
No church by 180 CE |
114% |
135% |
| ||
|
|
100% |
100% |
| ||
|
|
n =(14) |
(17) |
| ||
|
r = .430** V = .413* ? = .598** |
|
|
By comparing across the first row of the table we can see that most port cities (64 percent) had a church by the end of the first century, while few inland cities (24 percent) had a church that soon. Or, reading across the bottom row, we see that only 14 percent of port cities still lacked a church in 180, while many inland cities (35 percent) still were without a church by that year. These are very substantial differences.
Now look at the correlation coefficients, shown at the bottom of the table. There are many ways to calculate correlations, and specialists disagree as to which is best for what sort of data. To forestall such concerns, the three most appropriate measures are reported here. The first, known as Pearson’s product-moment correlation (r), is an extremely robust but conservative measure. The second is Cramer’s V. Many experts recommend V because it does not assume the data are ordinal—in other words, that the cases can be ordered on each variable. The variables used in this book meet minimum standards of ordinality (some cities were Christianized sooner than others, for example, while ports had more travelers than did inland cities). But, rather than endlessly pursue the matter, it is sufficient to provide the coefficients for V, except when the analysis involves 2 × 2 tables, one in which each of two variables has two values. In such cases r and V produce precisely the same value. The third measure is gamma (? ). It is a less conservative measure than either r or V, but it has valuable properties when data have limited variability—that is, when they take only a few values. Gamma tends to yield coefficients that are far higher than either r or V, and on 2 × 2 tables it will go to unity (1.000) whenever there is one empty cell.
As shown below the table, all three of these correlations strongly support the hypothesis. Port cities did tend to be Christianized sooner than inland cities. Notice that the correlation as measured by r (.430) and the correlation as measured by ? (.598) both carry two asterisks, while the correlation as measured by V carries only one. The asterisks indicate statistical significance: the odds that a correlation this large, and based on this number of cases, could not have occurred by random chance. One asterisk means the odds against a chance finding are at least 20 to 1, known as the .05 level of significance. Two asterisks means the odds are at least 100 to 1, or the .01 level of significance. It is not possible, even when analyzing the same set of data, to determine a threshold of significance from one table to the next. Thus, for example, a V of .413 is significant in the table above but would not be significant on some others—since significance has to do with the distribution of cases as well as the value of a correlation. It also is the case that gamma tends to require a much higher coefficient in order to achieve significance.
There is a technical dispute among statisticians as to whether significance is meaningful when the data are not based on random samples. These 31 cities were not selected randomly from among all Greco-Roman cities; rather, the set consists of all cities above 30,000 population. Even so, an excellent case has been made for using significance as a guide to whether or not a correlation is sufficiently large to be meaningful, and that is how significance is to be interpreted here.1 Correlations falling short of the .05 standard (one asterisk) will be dismissed as trivial.
|
Table 3-2: Distance and Christianization |
|
|
| ||
|
|
Within 1,000 miles of Jerusalem |
More than 1,000 miles from Jerusalem |
| ||
|
Had a church by 100 CE |
71% |
7% |
| ||
|
Had a church by 180 CE |
29% |
36% |
| ||
|
No church by 180 CE |
0% |
57% |
| ||
|
|
100% |
100% |
| ||
|
|
n =(17) |
(14) |
| ||
|
r = .744** V = .744 ** ? = .950** |
|
|
|
Table 3-3: Hellenism and Christianization |
|
|
| ||
|
|
Very Hellenic cities |
Less Hellenic cities |
| ||
|
Had a church by 100 CE |
63% |
8% |
| ||
|
Had a church by 180 CE |
37% |
25% |
| ||
|
No church by 180 CE |
0% |
67% |
| ||
|
|
100% |
100% |
| ||
|
|
n =(19) |
(12) |
| ||
|
r = .733** V = .767** ? = .928** |
|
|
|
Table 3-4: City-Size and Christianization |
|
|
| ||
|
|
Larger cities |
Smaller cities |
| ||
|
Had a church by 100 CE |
75% |
30% |
| ||
|
Had a church by 180 CE |
25% |
35% |
| ||
|
No church by 180 CE |
0% |
35% |
| ||
|
|
100% |
100% |
| ||
|
|
n =(8) |
(23) |
| ||
|
r = .430* V = .431* ? = .778** |
|
|

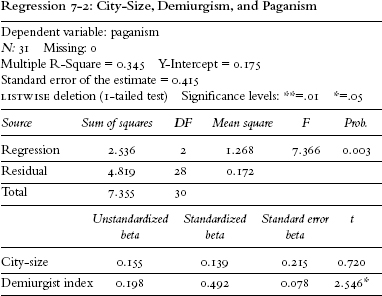
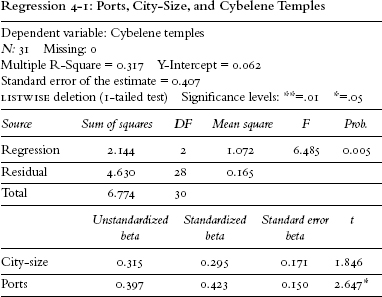
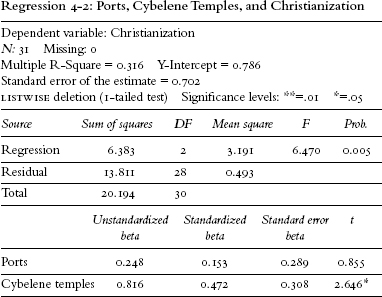
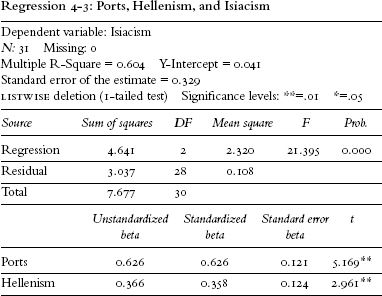
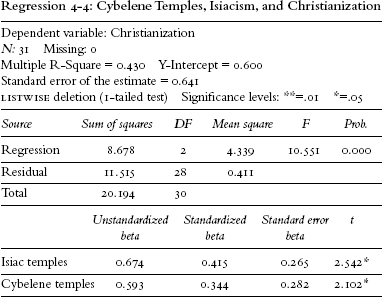
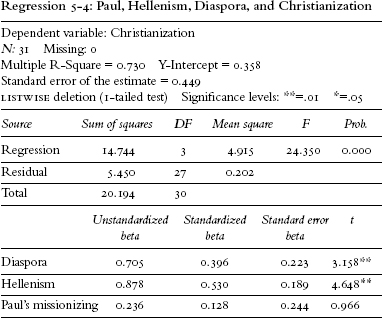
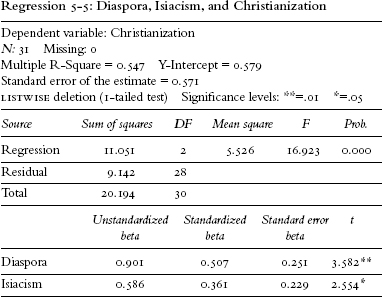
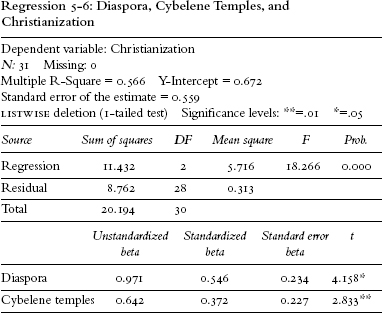
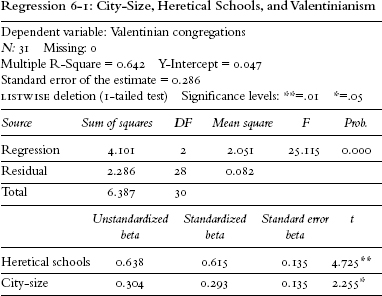
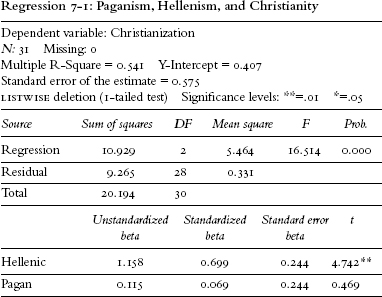
There are only a few numbers of interest in a regression analysis; the others are there for concerned specialists. Among these are the standardized betas. These are somewhat like correlations, except they reflect the effect of each variable independent of the other. That is, .681 represents the impact of Hellenism on Christianization with the effect of city-size removed, and .317 shows the impact of city-size on Christianization with the effect of Hellenism removed. While Hellenism has the greater effect, both variables have a significant independent effect. To see if a particular beta is significant, look to see if the t value is marked by asterisks. The other number of importance is the Multiple R-Square. This is the joint effect of Hellenism and city-size on Christianization: their combined effect. In this example, there is a very large effect (.635), and together these two variables account for 40 percent of the variation in Christianization (.635 × .635 = .403).
Some might suggest the use of dummy variables here on grounds that city-size and Hellenism are not ordinal variables. But surely city-size is ordinal, even if it takes only two values (larger and smaller). Hellenism too is a matter of degree: there was a significant amount of Hellenic influence in all Greco-Roman cities, but some had much more than others. Given the small number of cases (thirty-one) involved here, I usually limit use of regression analysis to three variables; in several instances I use four variables, but only with extreme care and caution. For those readers with specialized statistical concerns, be assured that use of logistic regression did not alter any outcomes.
|
Table 4-1: Ports and Cybelene Temples |
|
|
| ||
|
|
Port cities |
Inland cities |
| ||
|
Had a Cybelene temple |
57% |
12% |
| ||
|
No Cybelene temple |
43% |
88% |
| ||
|
|
100% |
100% |
| ||
|
|
n =(14) |
(17) |
| ||
|
r = .483** ? = .818** |
|
|
|
Table 4-2: City-Size and Cybelene Temples |
|
|
| ||
|
|
Larger cities |
Smaller cities |
| ||
|
Had a Cybelene temple |
63% |
22% |
| ||
|
No Cybelene temple |
37% |
78% |
| ||
|
|
100% |
100% |
| ||
|
|
n =(8) |
(23) |
| ||
|
r = .382* ? = .714 |
|
|
|
Table 4-3: Cybelene Temples and Christianization |
|
|
| ||
|
|
Cybelene temple |
No Cybelene temple |
| ||
|
Had a church by 100 CE |
80% |
24% |
| ||
|
Had a church by 180 CE |
20% |
38% |
| ||
|
No church by 180 CE |
0% |
38% |
| ||
|
|
100% |
100% |
| ||
|
|
n =(10) |
(21) |
| ||
|
r = .546** V = .556** ? = .875** |
|
|
|
Table 4-4: Hellenism and Isiac Temples |
|
|
| ||
|
|
Very Hellenic cities |
Less Hellenic cities |
| ||
|
Had an Isiac temple by 100 CE |
74% |
25% |
| ||
|
No Isiac temple by 100 CE |
26% |
75% |
| ||
|
|
100% |
100% |
| ||
|
|
n =(19) |
(12) |
| ||
|
r = .477** ? = .787** |
|
|
|
Table 4-5 : Ports and Isiac Temples |
|
|
| ||
|
|
Port cities |
Inland cities |
| ||
|
Had an Isiac temple by 100 CE |
93% |
24% |
| ||
|
No Isiac temple by 100 CE |
7% |
76% |
| ||
|
|
100% |
100% |
| ||
|
|
n =(14) |
(17) |
| ||
|
r = .693** ? = .954** |
|
|
|
Table 4-6: City-Size and Isiac Temples |
|
|
| ||
|
|
Larger cities |
Smaller cities |
| ||
|
Had an Isiac temple by 100 CE |
75% |
48% |
| ||
|
No Isiac temple by 100 CE |
25% |
52% |
| ||
|
|
100% |
100% |
| ||
|
|
n =(8) |
(23) |
| ||
|
r = .239 ? = .532 |
|
|
|
Table 4-7: Isiac Temples and Christianization |
|
|
| ||
|
|
Had an Isiac temple by 100 CE |
No Isiac temple by 100 CE |
| ||
|
Had a church by 100 CE |
65% |
14% |
| ||
|
Had a church by 180 CE |
29% |
36% |
| ||
|
No church by 180 CE |
6% |
50% |
| ||
|
|
100% |
100% |
| ||
|
|
n =(17) |
(14) |
| ||
|
r = .583** V = .583** ? = .815** |
|
|
|
Table 4-8: Temples to Cybele and Isis |
|
|
| ||
|
Had a temple to Cybele |
No temple to Cybele |
|
| ||
|
Had an Isiac temple by 100 CE |
90% |
38% |
| ||
|
No Isiac temple by 100 CE |
10% |
62% |
| ||
|
|
100% |
100% |
| ||
|
|
n =(21) |
(10) |
| ||
|
r = .488** ? = .872** |
|
|
|
Table 5-1: Distance and the Diaspora |
|
|
| ||
|
|
Within 1,000 miles of Jerusalem |
More than 1,000 miles from Jerusalem |
| ||
|
Had a significant Jewish community |
47% |
7% |
| ||
|
No significant Jewish community |
53% |
93% |
| ||
|
|
100% |
100% |
| ||
|
|
n =(17) |
(14) |
| ||
|
r = .438** ? = .841** |
|
|
|
Table 5-2: Ports and the Diaspora |
|
|
| ||
|
|
Port cities |
Inland cities |
| ||
|
Had a significant Jewish community |
50% |
12% |
| ||
|
No significant Jewish community |
50% |
88% |
| ||
|
|
100% |
100% |
| ||
|
|
n =(14) |
(17) |
| ||
|
r = .419** ? = .765** |
|
|
|
Table 5-3: City-Size and Diasporan Jewish Communities |
|
|
| ||
|
|
Larger cities |
Smaller cities |
| ||
|
Had a significant Jewish community |
50% |
22% |
| ||
|
No significant Jewish community |
50% |
78% |
| ||
|
100% |
100% |
|
| ||
|
|
n =(8) |
(23) |
| ||
|
r = .272 ? = .565 |
|
|
|
Table 5-4: Hellenism and Paul’s Visits |
|
|
| ||
|
|
Very Hellenic cities |
Less Hellenic cities |
| ||
|
Missionized by Paul |
42% |
0% |
| ||
|
Not missionized by Paul |
58% |
100% |
| ||
|
|
100% |
100% |
| ||
|
|
n =(19) |
(12) |
| ||
|
r = .469** ? = 1.000** |
|
|
|
Table 5-5: Ports and Paul’s Missions |
|
|
| ||
|
|
Port cities |
Inland cities |
| ||
|
Missionized by Paul |
43% |
12% |
| ||
|
Not missionized by Paul |
57% |
88% |
| ||
|
|
100% |
100% |
| ||
|
|
n =(14) |
(17) |
| ||
|
r = .354* ? = .678* |
|
|
|
Table 5-6: The Diaspora and Paul’s Missions |
|
|
| ||
|
|
Had a significant Jewish community |
No significant Jewish community |
| ||
|
Missionized by Paul |
67% |
9% |
| ||
|
Not missionized by Paul |
33% |
91% |
| ||
|
|
100% |
100% |
| ||
|
|
n = (9) |
(22) |
| ||
|
r = .597** ? = .905** |
|
|
|
Table 5-7: Paul and Christianization |
|
|
| ||
|
|
Missionized by Paul |
Not missionized by Paul |
| ||
|
Had a church by 100 CE |
100% |
23% |
| ||
|
Had a church by 180 CE |
0% |
41% |
| ||
|
No church by 180 CE |
0% |
36% |
| ||
|
|
100% |
100% |
| ||
|
|
n =(9) |
(22) |
| ||
|
r = 577** V = .614** ? = .933** |
|
|
|
Table 5-8: The Diaspora and Christianization |
|
|
| ||
|
|
Had a significant Jewish community |
Had no significant Jewish community |
| ||
|
Had a church by 100 CE |
100% |
18% |
| ||
|
Had a church by 180 CE |
0% |
46% |
| ||
|
No church by 180 CE |
0% |
36% |
| ||
|
|
100% |
100% |
| ||
|
|
n =(9) |
(22) |
| ||
|
r = .665** V = .753** ? = 1.000** |
|
|
|
Table 6-1: Ports and Heretical Schools |
|
|
| ||
|
|
Port cities |
Inland cities |
| ||
|
Had a heretical school |
29% |
24% |
| ||
|
No heretical school |
71% |
76% |
| ||
|
|
100% |
100% |
| ||
|
|
n =(14) |
(17) |
| ||
|
r = .057 ? = .130 |
|
|
|
Table 6-2: City-Size and Heretical Schools |
|
|
|
| |||
|
|
Larger cities |
Smaller cities |
|
| |||
|
Had a heretical school |
63% |
13% |
|
| |||
|
No heretical school |
37% |
87% |
|
| |||
|
|
100% |
100% |
|
| |||
|
|
n =(8) |
(23) |
|
| |||
|
r = .495** ? = .835** |
|
|
|
|
Table 6-3: Diasporan Communities and Heretical Schools |
|
|
| ||
|
|
Significant Jewish community |
No significant Jewish community |
| ||
|
Had a heretical school |
33% |
23% |
| ||
|
No heretical school |
67% |
77% |
| ||
|
|
100% |
100% |
| ||
|
|
n =(9) |
(22) |
| ||
|
r = .110 ? = .259 |
|
|
|
Table 6-4: Christianization and Heretical Schools |
|
|
|
| |||
|
|
Had a church by 100 CE |
Had a church by 180 CE |
No church by 180 CE |
| |||
|
Had a heretical school |
23% |
50% |
0% |
| |||
|
No heretical school |
77% |
50% |
100% |
| |||
|
|
100% |
100% |
100% |
| |||
|
|
n =(13) |
(10) |
(8) |
| |||
|
r = .156 V = .436 ? = .225 |
|
|
|
|
Table 6-5: Heretical Schools and Marcionite Congregations |
|
|
| ||
|
|
Had a heretical school |
No heretical school |
| ||
|
Had a Marcionite congregation |
62% |
38% |
| ||
|
No Marcionite congregation |
38% |
62% |
| ||
|
100% |
100% |
|
| ||
|
|
n =(8) |
(23) |
| ||
|
r = .205 ? = .443 |
|
|
|
Table 6-6: Diasporan Communities and Marcionism |
|
|
| ||
|
|
Had a significant Jewish community |
No significant Jewish community |
| ||
|
Had a Marcionite congregation |
89% |
27% |
| ||
|
No Marcionite congregation |
11% |
73% |
| ||
|
|
100% |
100% |
| ||
|
|
n =(9) |
(22) |
| ||
|
r = .562** ? = .910** |
|
|
|
Table 6-7: Heretical Schools and Valentinian Congregations |
|
|
| ||
|
|
Had a heretical school |
No heretical school |
| ||
|
Had a Valentinian congregation |
88% |
9% |
| ||
|
No Valentinian congregation |
12% |
91% |
| ||
|
|
100% |
100% |
| ||
|
|
n =(8) |
(23) |
| ||
|
r = .760** ? = .973** |
|
|
|
Table 6-8: City-Size and Valentinian Congregations |
|
|
| ||
|
|
Larger cities |
Smaller cities |
| ||
|
Had a Valentinian congregation |
75% |
13% |
| ||
|
No Valentinian congregation |
25% |
87% |
| ||
|
|
100% |
100% |
| ||
|
|
n =(8) |
(23) |
| ||
|
r = .597** ? = .905** |
|
|
|
Table 6-9: Heretical Schools and Montanist Congregations |
|
|
| ||
|
|
Had a heretical school |
No heretical school |
| ||
|
Had a Montanist congregation |
88% |
65% |
| ||
|
No Montanist congregation |
12% |
35% |
| ||
|
|
100% |
100% |
| ||
|
|
n =(8) |
(23) |
| ||
|
r = .215 ? = .577 |
|
|
|
Table 6-10: City-Size and Montanist Congregations |
|
|
| ||
|
|
Larger cities |
Smaller cities |
| ||
|
Had a Montanist congregation |
100% |
61% |
| ||
|
No Montanist congregation |
0% |
39% |
| ||
|
|
100% |
100% |
| ||
|
|
n =(8) |
(23) |
| ||
|
r = .377* ? = 1.000** |
|
|
|
Table 6-11: Heretical Schools and Manichaeist Congregations |
|
|
| ||
|
|
Had a heretical school |
No heretical school |
| ||
|
Had a Manichaeist congregation |
88% |
13% |
| ||
|
No Manichaeist congregation |
12% |
87% |
| ||
|
|
100% |
100% |
| ||
|
|
n =(8) |
(23) |
| ||
|
r = .697** ? = .958** |
|
|
|
Table 6-12: City-Size and Manichaeist Congregations |
|
|
| ||
|
|
Larger cities |
Smaller cities |
| ||
|
Had a Manichaeist congregation |
75% |
17% |
| ||
|
No Manichaeist congregation |
25% |
83% |
| ||
|
|
100% |
100% |
| ||
|
|
n =(8) |
(23) |
| ||
|
r = .539** ? = .869** |
|
|
|
Correlations 6-1 |
|
|
| ||
|
|
Heretical schools (r) |
|
| ||
|
Valentinians |
.760** |
|
|
Manichaeism |
.697** |
|
| ||
|
Montanism |
.215 |
|
| ||
|
Marcionism |
.205 |
|
|
Correlations 6-2 |
|
|
| ||
|
|
Demiurgism (r) |
|
| ||
|
Christianization |
.186 |
|
| ||
|
Diaspora |
.127 |
|
| ||
|
Hellenism |
.134 |
|
| ||
|
Ports |
.097 |
|
| ||
|
City-size |
.611** |
|
|
Table 7-1: Correlations* |
|
|
| ||
|
|
Mithraism (r) |
|
| ||
|
City-size |
.019 |
|
| ||
|
Ports |
.029 |
|
| ||
|
Christians |
.046 |
|
| ||
|
Hellenized |
-.158 |
|
| ||
|
Diaspora |
-.193 |
|
| ||
|
Isiac temples |
.230 |
|
| ||
|
Cybelene temples |
.022 |
|
| ||
|
Heretical schools |
.167 |
|
| ||
|
Marcionism |
-.100 |
|
| ||
|
Valentinianism |
.092 |
|
| ||
|
Montanism |
-.092 |
|
| ||
|
Manichaeism |
.160 |
|
| ||
|
Demiurgism |
.156 |
|
*The presence of Mithraism in a city is based on the work of Manfred Clauss (2000).
|
Table 7-2: Ports and Paganism |
|
|
| ||
|
|
Port cities |
Inland cities |
| ||
|
Substantial paganism |
50% |
29% |
| ||
|
Little paganism |
50% |
71% |
| ||
|
|
100% |
100% |
| ||
|
|
n =(14) |
(17) |
| ||
|
r = .210 ? = .412 |
||
|
Table 7-3: City-Size and Paganism |
|
|
| ||
|
|
Larger cities |
Smaller cities |
| ||
|
Substantial paganism |
75% |
26% |
| ||
|
Little paganism |
25% |
74% |
| ||
|
|
100% |
100% |
| ||
|
|
n =(8) |
(23) |
| ||
|
r = .439* ? = .789* |
|
|
|
Table 7-4: Hellenism and Paganism |
|
|
| ||
|
|
Very Hellenic cities |
Less Hellenic cities |
| ||
|
Substantial paganism |
58% |
8% |
| ||
|
Little paganism |
42% |
92% |
| ||
|
|
100% |
100% |
| ||
|
|
n =(19) |
(12) |
| ||
|
r = .496** ? = .876** |
|
|
|
Table 7-6: Heretical Schools and Paganism |
|
|
| ||
|
|
Had a heretical school |
No heretical school |
| ||
|
Substantial paganism |
88% |
22% |
| ||
|
Little paganism |
12% |
78% |
| ||
|
|
100% |
100% |
| ||
|
|
n =(8) |
(23) |
| ||
|
r = .591** ? = .924** |
|
|
|
Table 7-6: Demiurgism and Paganism |
|
|
|
| |||
|
Demiurgism: |
High |
Medium |
None |
| |||
|
Substantial paganism |
86% |
50% |
17% |
| |||
|
Little paganism |
14% |
50% |
83% |
| |||
|
|
100% |
100% |
100% |
| |||
|
|
n =(7) |
(6) |
(18) |
| |||
|
r = .583** ? = .821** |
|
|
|