Chapter 3
Analysis of Worldwide Community Economies for Sustainable Local Development
Sviatlana Hlebik
Introduction
There exist some contemporary forms of social and solidarity-based economies, a growing area of practice that is highly relevant to sustainable consumption studies. This chapter presents an analysis of worldwide community economies for sustainable local development that, on the one hand can benefit businesses, and on the other, can promote local welfare services, influencing governance and society groups. An empirical analysis has been conducted to assess the possible relationship between community currency systems and the countries’ levels of social and economic development, as well as monetary indicators and macroeconomic, environmental, and financial features.
The increasing number of communities that are developing and using alternative currencies as a form of monetary exchange with their own means of payment explains the growing research interest and policy attention. These will empower local communities by helping them to increase their economic self-sufficiency and enhance their financial autonomy. Blanc (2011) has established that a local currency focuses on territorial activities and actors, principally in order to strengthen and build local resilience in a specific territory. A community currency achieves this by developing its social exchanges and reciprocity in a particular community. According to Blanc (2011), complementary currency is therefore governed by market exchange principles and aims at developing economic activities.
First, this chapter introduces some existing scientific foundations explaining why the variety of business models and economic tools discussed in this work can make the economy more sustainable.
Considering the multiplicity of a community’s economies, it is important to examine several classifications. There are two different approaches proposed in this chapter. The first one describes its historical evolution and development. The second focuses on the typology of currencies, their purposes, and their functions.
Since the instruments analyzed in the present chapter are different from our mental framework, some examples of complementary economic tools have been introduced for the purpose of better understanding their functionality.
There are multiple types of community currencies (CCs) and among them is the Commercial Credit Circuit (C3) model, a professionally run business-to-business (B2B) complementary currency based on the model of the WIR system. This currency has been successfully operational in Switzerland, involving a quarter of all the business units in that country. Formal econometric analysis and other research methods have proven that the WIR acts as a significant counter-cyclical stabilizing factor that explains the proverbial long-standing stability of the Swiss economy.
Current consideration of the aims and types of CCs discovered that these reach beyond common forms of barter exchange, rethinking the role of money and implementing instruments to promote social values and sustainable local development. As Derudder (2011) noted: “Common motivations and core objectives of such initiatives revolve around strengthening solidarity and sharing in communities, developing local employment and galvanizing the economy.”
This work is organized as follows: Part 1 presents a conceptual framework on how the operation of business models and economic tools of diverse types enables the development of structural benefits, making the economy more sustainable. Part 2.1 introduces classifications of the typology of currencies and the historical evolution of the generations approach to community currencies. Some examples presented in Part 2.2 allow for a much better understanding of their functioning mechanisms. Part 2.3 aims to present some statistical evidence on world system distribution, in terms of type, purpose, and medium of exchange. Data was collected by the Complementary Currency Resource Center. Lastly, Part 3 is dedicated to the empirical analysis on how these worldwide economic tools are related to country-level economic, social, and environmental factors, and also to the different aspects of the financial sector and money.
Part 1: Conceptual framework
Kash et al. (2007) demonstrated how characteristics of agents in a system can be inferred from the equilibrium distribution of money. The authors provided analysis for optimizing scrip systems and tolls for “computing equilibria by showing that the model exhibits strategic complementarities, which implies that there exist equilibria in pure strategies that can be computed efficiently.”
Goerner et al. (2009) provided a solid empirical/mathematical basis for a quantitative measure of sustainability for a complex flow system. According to some ecological economists (e.g. Herman Edward Daly, Robert E. Ulanowicz), a flow system’s long-term sustainability depends on reasonable equilibrium, size and internal structure (development). In ecosystems as in economies, size is measured as the total volume of system throughput: e.g. gross domestic product (GDP) in economies. Consequently, the flow-network sustainability can be reasonably defined as the optimal balance of efficiency and resilience as determined by nature.
Efficiency can be defined as “the network’s capacity to perform in a sufficiently organized and efficient manner as to maintain its integrity over time” (May 1972), while resilience is defined as a “reserve of flexible fall-back positions and diversity of actions that can be used to meet the exigencies of novel disturbances and the novelty needed for on-going development and evolution” (Holling 1986). Both concepts are related to the levels of diversity and connectivity found in the network, but in opposite directions. A multiplicity of connections and variety plays a positive role in resilience. Representing economies as flow systems links directly into money’s primary function as a medium of exchange.
According to Lietaer et al. (2010) “in economies, as in living organisms, the health of the whole depends heavily on the structure by which the catalyzing medium, in this case, money, circulates among businesses and individuals. Money must continue to circulate in sufficiency to all corners of the whole because poor circulation will strangle either the supply side or the demand side of the economy, or both.”
Applying the complex flow framework to financial and monetary systems, it is possible to “predict that excessive focus on efficiency would tend to create exactly the kind of bubble economy which we have been able to observe repeatedly in every boom and bust cycle in history” (May 1972).
Enforcing a monopoly of a single currency that is maintained and tightly regulated within each country improves the efficiency of price formation and exchanges in national markets. The mathematical foundation is that there exists only a single maximum for any given network system. It is curious to note that the optimal sustainability is situated slightly toward the resilience side, suggesting that resilience plays a greater role in optimal sustainability than does efficiency.
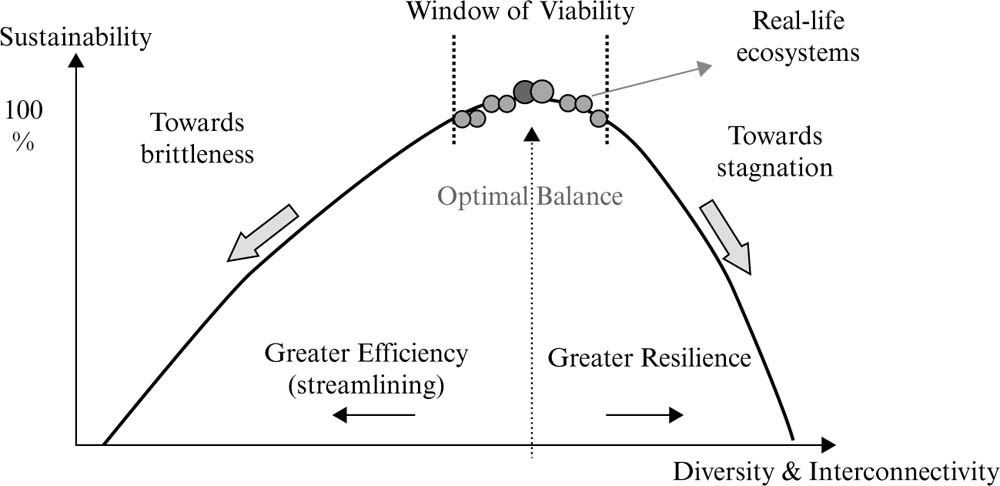
Figure 3.1: Window of viability
Source: Lietaer et al. (2010)
Figure 3.1 graphically illustrates Zorach and Ulanowicz’s (2003) “Window of viability” in which all sustainable systems operate within a rather narrow range of health situated around peak sustainability that delimits long-term viability in the systems.
Many researchers such as De Long et al. (1990), De Bondt and Thaler (1987), Thaler (1999), etc., have observed market anomalies that are not explained by the arguments of the efficient market hypothesis. Nevertheless, the efficient market hypothesis is still the dominant paradigm for organizing and ruling the markets.
The global monetary system is becoming more fragile because a general belief prevails that all improvements need to go further in the same direction (thick downward arrow in figure 3.2) of increasing growth and efficiency. Based on efficiency of price formation and exchanges, the global monoculture of bank-debt money and floating exchanges were justified because they are “more efficient.”
Figure 3.3 shows that since efficiency is the criterion considered most relevant, the overly efficient system can lead to system crashes and collapse. The main idea is that money circulates in our global economic network and is kept as a monopoly of a single type of currency – bank-debt money, created with interest.
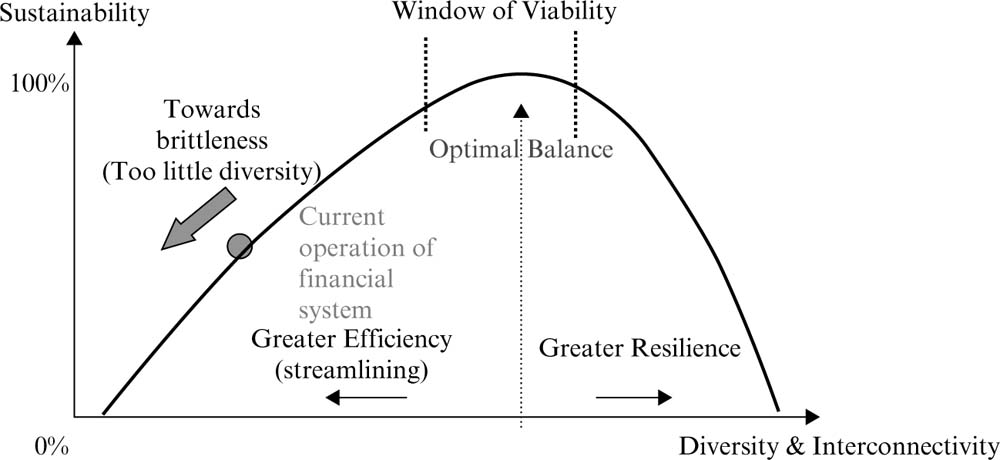
Figure 3.2: Monetary ecosystem
Source: Lietaer et al. (2010)
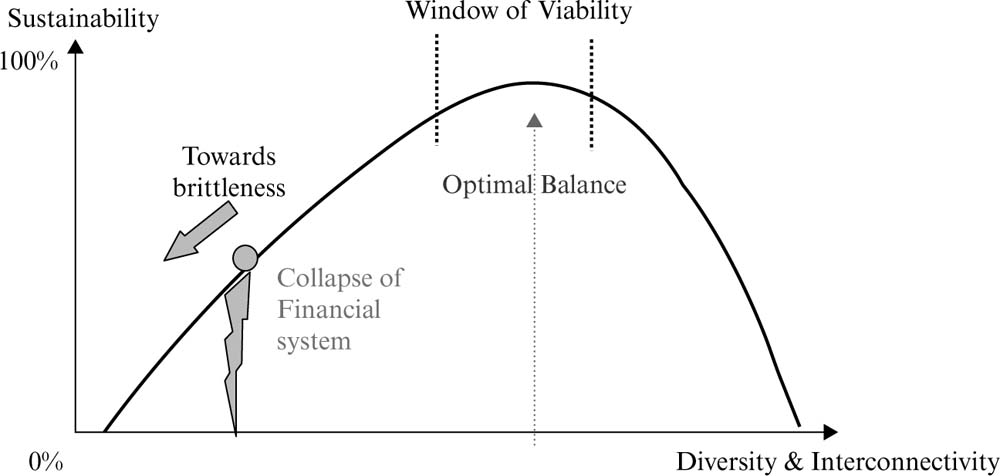
Figure 3.3: Systemic financial collapse
Source: Lietaer et al. (2010)
Different types of business models, instruments that can be used and accepted as a medium of exchange, facilitate the sale, purchase or trade of goods between parties. Many authors in modern economics literature use the “currencies” term in reference to “medium of exchange” because the implementation of these kinds of tools allows for a variety of “currencies” to circulate among private people and enterprises to facilitate their exchanges.
The thick upward arrow in figure 3.4 shows how the operation of Source: Lietaer et al. (2010) complementary currencies of diverse types enables reduced efficiency and increasing structural resilience, leading the economy back toward sustainability. This multiple form of “currencies” is frequently called “complementary” or complementary community currency (CCC) because they are operating as complements to conventional national moneys.
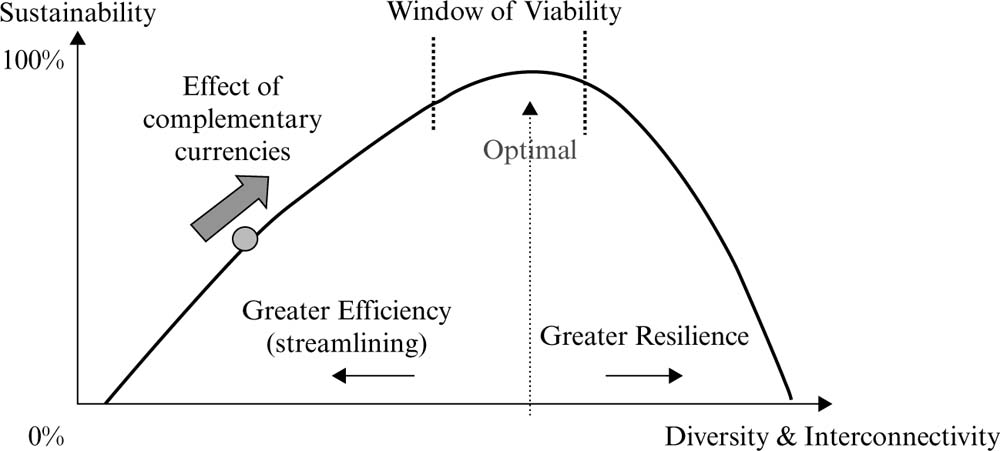
Figure 3.4: The effect of diverse complementary currencies
Source: Lietaer et al. (2010)
Part 2.1: An overview of typologies and classifications
There are wide-ranging socio-economic tools covering the economic, social, and environmental dimensions, and different classifications or typologies have only been introduced fairly recently (Schroeder et al. 2011).
Some of those classifications focus more on the technical and operational design features while others also integrate their different objectives, purposes, and visions (Martignoni 2012).
Here we briefly summarize two schemes:
- according to the historical evolution of the generations approach to community currencies by Jérôme Blanc;
- according to the typology of currencies after Kennedy and Lietaer (2004).
The scheme proposed in figure 3.5 distinguishes four generations. These generations are characterized by a “specific monetary organization and specific relationships with the socio-economic world and with governments (local or central) as well” (Blanc 2011).

Figure 3.5: Historical evolution of the generations of community currencies
Source: Blanc (2011)
A first generation of CC schemes refers to the LETSystem (see figure 3.6 for a map of global LET systems). The LETS or LETS model is a local exchange trading system: “local employment and trading system or local energy transfer system is a locally initiated, democratically organized, not-for-profit community enterprise that provides a community information service and records transactions of members exchanging goods and services by using the currency of locally created LETS Credits” (Western Australia Government 1990).
The LETS program was founded by Michael Linton in the early 1980s on Vancouver Island in Canada and has been replicated in various countries and intensified, creating large networks, particularly since the second half of the 1990s. LETS networks used interest-free local credit that empowered members to issue their own line of credit at the point of purchase, creating a self-regulated mechanism.
The second generation appears with the time dollar schemes at the end of the 1980s in the US, since when they have been exported to various countries. The time dollar is the unit of exchange in a time bank. This kind of tool is a pattern of reciprocal service exchange based on trust and cooperation. Unlike traditional time banks, where the unit of exchange is the person-hour, time dollar schemes are earned for providing services and are spent receiving services. As the systems “providing help to people with social programmes they frequently develop partnerships with local governments and socially oriented foundations” (Blanc 2011).
Third generation schemes derive from the LETS model, generally implemented by non-profit organizations and sometimes with the participation of a community bank or local cooperative. This category with economic purpose increased significantly in the 2000s and is represented by German regio schemes, Brazilian community banks and US BerkShare. “They aim at dynamizing local economic activity by re-localizing a series of daily consumption expenses. The success of those schemes requires thus the inclusion of small local enterprises and shops, and sometimes bigger ones” (Blanc 2011).
The fourth generation is a new generation that is represented by multiplex projects in which local governments play a fundamental role. The implementation requires the combination of several objectives with particular focus on environmental issues. This type is aimed at encouraging sustainable behaviors, for example Rotterdam’s NU (2002–3) local or organic product consumption, fair trade, and waste recycling; and the French SOL program, which combines a loyalty card for sustainable consumption close to commercial loyalty schemes.
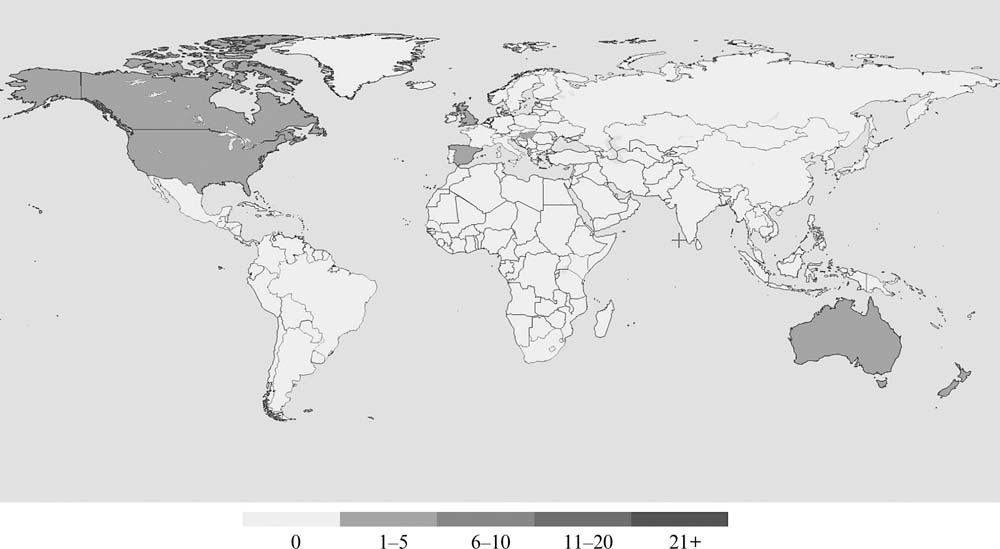
Figure 3.6: World map of LET systems
Source: Database of Complementary Currencies Worldwide: http://www.complementarycurrency.org
Figure 3.7 illustrates the classification made by Margrit Kennedy and Bernard Lietaer (2004) that allows us to better understand the great variety of currencies, distinguishing their concepts, purposes, and functions. This typology aims to establish a scheme for classifying all forms of currency, differentiated as legal tender (“commercial” or for “social purposes”), medium of exchange, means of payment, cost recovery, etc.
Part 2.2: How it works (some examples)
In this section we are going to present some examples of complementary economic (monetary) tools that are designed to circulate within a specific zone, bringing wealth for those in the community, increasing liquidity, and consequently raising purchasing power in a local area.
We start with one of the oldest and most important complementary currencies presently in circulation: the WIR bank (Wirtschaftsring-Genossenschaft), formerly known as the Swiss Economic Circle. The WIR credit clearing association was founded in 1934 by businessmen Werner Zimmerman and Paul Enz in direct response to the Great Depression and has been operating in Switzerland for 80 years. It is now called the WIR Bank and provides conventional banking services. Its statutes enounce: “The WIR Cooperative is a self-help organization made up of trading, manufacturing, and service-providing companies. Its purpose is to encourage participating members to put their buying power at each other’s disposal and keep it circulating within their ranks, thereby providing members with additional sales volume” (WIR Bank 1934).
The system works in the following way: a businessman who wishes to join as a WIR participant declares his intention to accept WIR booking orders as partial or total payment in any transaction with other participants. A WIR representative makes a preliminary examination of business acumen and reputation, subscribes to a credit bureau and submits the application to an admissions committee of three members: “Each participant has a set of booking order forms, similar to the conventional bank checks, with the imprint of name, address, and account number. In making purchases from another participating member, the buyer will give to the seller such a booking order after having written in the amount for whatever the seller has obligated himself to accept” (WIR Bank 1934).
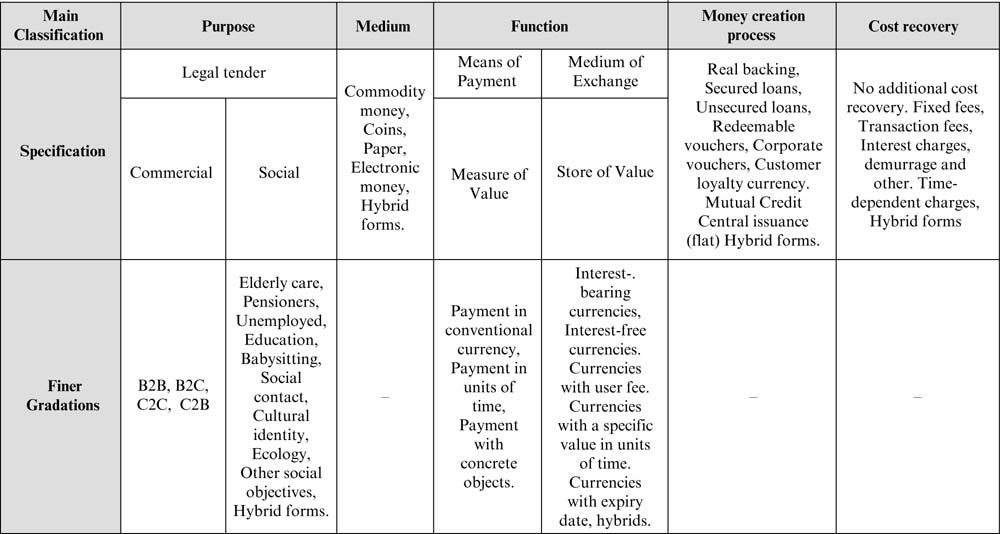
Figure 3.7: Typology of currencies after Kennedy and Lietaer (2004): Regionalwährungen, p. 268f., translated from German into English
Source: Martignoni (2012)
This mechanism stimulates rapid circulation of the money in order to generate increased sales among the members, stimulating spending account balances quickly. A main characteristic is no interest is paid on account balances, so the money is interest-free.
According to Thomas Greco (1994), WIR is an important case for monetary reformers and free exchange advocates to study: “While there may yet be some deficiencies in its operating policies, WIR has proven over a long period of time the effectiveness of direct clearing of credits between buyers and sellers as an alternative to conventional bank-created debt-money.”
Let’s take a look at another example of complementary economic (monetary) tools: liquidity networks as local trading systems using debt-free electronic currency schemes. Since a liquidity network seeks to fulfill one of the most important functions of many – that is it acts as a means of exchange – these kinds of tools address the liquidity constraint, that affect the ability of economic agents to exchange their assets and existing wealth for goods and services.
The Liquidity Network (http://theliquiditynetwork.org) was designed for Ireland but could be applied to any country during the downward spiral period, where there is increasing unemployment, high national debt, and the deterioration of loan quality induced by the recession and credit constraints:
The aim of the Liquidity Network is to address the current liquidity problem – the slowdown in economic activity triggered by the credit crunch. Currently virtually all economic activity is powered by debt based credit – individuals and businesses borrow in order to finance their activities. Using the credit released by these loans they employ or do business with other individuals/businesses who in turn do business with their suppliers and so on. When the “seed” credit from banks dries up, as in the current crisis, the multiplier effect which normally helps to create liquidity efficiently acts in the reverse way and removes liquidity quickly. Liquidity Network aims to address this problem by creating an alternative “liquidity stream” which is not based on debt. (http://theliquiditynetwork.org)
The Liquidity Network uses a unit called the Quid. All trading is carried out electronically by mobile phone or over the Internet; it doesn’t use notes and coins. The mechanism was devised by Richard Douthwaite and set up in Feasta, the Foundation for the Economics of Sustainability. It works as follows: businesses and every citizen with a National Insurance number can sign up for an account in which will be allocated Q1,000, which roughly equals €1,000. Every account holder can perform buy/sell operations exchanging Quid (Q); however, accounts must be kept roughly in balance and the system does not allow them to go into deficit. Businesses that experience high turnover and balanced buy/sell exchanges would be allocated extra Q. In this way the system automatically provides liquidity.
Part 2.3: Statistical data overview
This section is aimed at presenting some statistical evidence collected by the Complementary Currency Resource Center ccDatabase. Graphical representation allows us to gain a much better understanding of annual growth of different types of systems and regional distributions of CCC across the world. Most complementary currencies have multiple purposes and/or are intended to address multiple issues.
Figure 3.8 represents the worldwide distribution of CC systems, showing that Europe, North America, and the Asia/Pacific zones are the regions with most experience of community currencies.
It is curious that in Europe, LETS is the most popular, followed by the Mutual Credit System, then the Commercial Exchange System (Database of Complementary Currencies Worldwide 2014), whereas in North America the Mutual Credit System and the Time Bank System prevail, and in the Asia/Pacific region, the Internet-based trading network Community Exchange System (CES) is more prevalent.
Relative distribution highlights the prevalence of LETS at 17 percent, followed by the Mutual Credit System at 10.7 percent, and the Community Exchange System at 14 percent. In terms of frequency, LETS in Europe and the Community Exchange System in Europe and North America are the most prevalent. As for South America, the “Sistema de Trueke” in Venezuela is very popular.
Most complementary currencies have multiple purposes, though nevertheless it is interesting to examine some types of patterns. North America and the Asia/Pacific region is frequently guided by “community development” aims, while Europe is more sensitive to the objectives of “contributing towards a sustainable society,” “enhancing members’ quality of life,” “activating the local market,” and also sharpening the importance of the “micro/small/medium enterprise development” mission. The data show the growth of complementary currency systems around the world. We can note that complementary currency systems have grown considerably, particularly since 2008 (see details in Appendix 1).
Alternative currencies encourage consumers to make purchases within their communities rather than elsewhere in the country or abroad. “Buying local” circulates wealth in the region, reduces unnecessary imports, and helps avoid higher unemployment levels, supporters say.
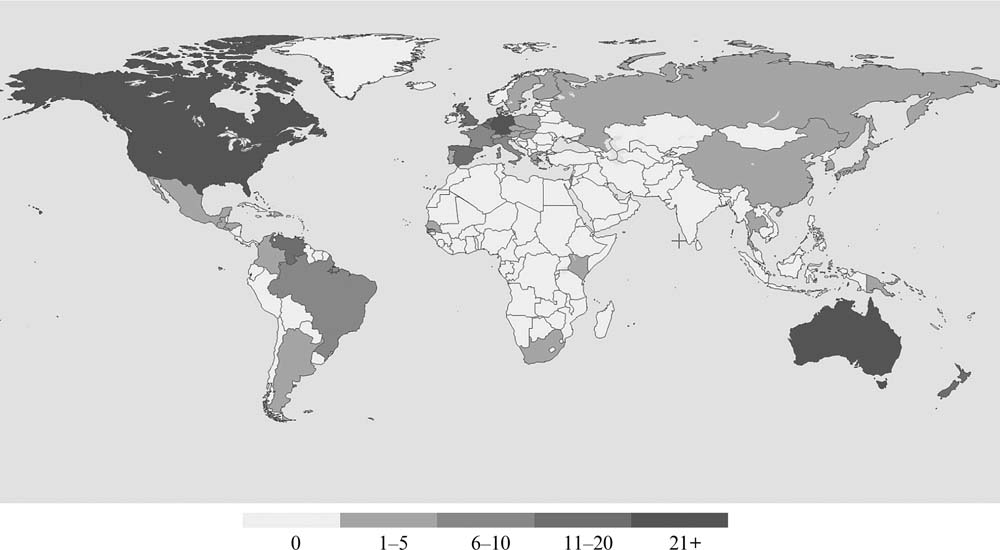
Figure 3.8: World map of complementary currency systems
Source: Database of Complementary Currencies Worldwide: http://www.complementarycurrency.org
Part 3: Relationship between the community currency systems and the country’s level of social and economic development, different aspects of the financial sector and money
In order to examine this relationship, the Worldwide Database of Complementary Currency Systems has been used. This database, which contains all types of complementary currency systems in use in the world today, allows us to have information on the number of Community Currency Systems per single country and year; more precisely, it covers the period from 2006 to 2012 for 35 countries across the world. We also collected more than 200 variables from various sources. The information on the economic data series and the financial services were taken from the International Monetary Fund (IMF)/The World Economic Outlook (WEO) database, whereas the data relative to social, environmental, and education factors were selected from World Development Indicators.
As for the methodology, a generalized linear model (GLM) was used. (See Appendix 2 and Appendix 3 for details on the statistical model and description of the data.)1
Main empirical findings
Below we describe “highly significant” results obtained from empirical analysis. They have been grouped into different fields for clarity:
Macroeconomic features
- (−) GDP growth (annual %) T−1. The Complementary Community Currency (CCC) are negatively related with lagged GDP growth (annual %).
- (+) Log general government gross debt. The number of complementary practices is higher in countries and years with high government gross debt.
- (+) Risk premium on lending (lending rate minus treasury bill rate, %). Community currency systems are positively related with risk premium on lending.
- (+) Government total expenditure as % of GDP. The community tools are more used in countries and years with high government total expenditure as % of GDP.
These findings are crucial as they confirm widespread statements and convictions by founders and community members that CCCs are vitally useful and flourish during an economic recession.
Finance
- (−) Domestic credit to private sector (% of GDP). This is an indicator of the movement of domestic credit to the private sector in contrast to CCC development. This result is fully consistent with the evidence discussed in this work. There are multiple types of CCs based on a mutual credit system that are activated especially during credit constraints. LETS networks used interest-free local credit where the participants issued their own line of credit, but there are also more evolved forms based on the successful model of the WIR system.
- (−) Bank nonperforming loans to total gross loans (%) T–1. Complementary currencies have an inverse relationship with bank non-performing loans ratios. A bad quality loan has a higher probability of becoming a non-performing loan with no return. This result confirms the complementary function of community currencies because this means that a low level of this indicator, which shows the good quality of the banking portfolio, has a positive relationship with the development of CCCs.
Socio-demographic characteristics: population, education, gender
- (+) Log population (total). A positive relation with CCC is discovered. In countries with a high population, it is more likely to find people, who for reasons of proactivity, ideological sensitivity, or economic needs, are inclined to experiment and implement complementary community tools.
- (+) Tertiary education, teachers (% female). The positive relationship with the share of female academic staff in tertiary education evidences a positive influence for the diffusion of CCC.
- (−) Social contributions (% of revenue). This indicator is negatively related to CCC. Social contributions include social security contributions by employees, employers, and self-employed individuals, and contributions to social insurance schemes operated by governments. Therefore this outcome is quite a logical explanation that these tools we are looking at are more stimulating where there are less social insurance benefits.
Monetary indicators
- (+) Money and quasi money (M2) as % of GDP. Money and quasi money comprise the sum of currency outside banks, demand deposits other than those of the central government, and the time, savings, and foreign currency deposits of resident sectors other than the central government. This evidence is consistent with the claim that the CCC do not have a replace function and are not intended as an alternative to the national currency, but rather are complementary.
Internet and communication
- (+) Secure Internet servers. Because electronic transactions are a dominant medium of exchange in CCC, it is obvious that there has to be a positive relationship with Internet technologies (see Appendix 1).
Entrepreneurship
- (+) New business density (new registrations per 1,000 people aged 15–64). The indicators of new businesses registered positively with CCC experiences. It follows that in countries where there are people with an entrepreneurial mindset and the desire to work, but above all a climate more favorable for doing business (i.e. less bureaucracy, lower taxes, etc.), there is also an environment conducive to the development of CCC.
Climate and environment
- (+) CO2 emissions (metric tons per capita). Positive relations with carbon dioxide emissions are those stemming from the burning of fossil fuels and the manufacture of cement. As illustrated in Appendix 1, one of the purposes of the system is environmental conservation. Community currencies can play a role in better valuation of environmental resources (e.g. the Belgian e-Portemonnee that encourages businesses to adopt more environmentally sound practices). Increasing CO2 emissions are blamed for global climate change. The positive and optimistic results of the analysis showed that there is higher sensitivity for incentivizing more sustainable behavior where the CO2 emissions are elevated.
Conclusion
The global monetary system is becoming more fragile because of increasing growth and efficiency. Different types of business models, instruments that can be used and accepted as mediums of exchange, facilitate the sale, purchase, or trade of goods between parties.
Then, as a wide range of socio-economic instruments exist, covering the economic, social, and environmental dimension, we thought it useful to overview the classifications, following two approaches. The first helps us to understand the historical evolution, i.e. how they were developed. The second focuses on the typology of currencies, their purposes and functions.
Before proceeding with empirical analysis, with the aim of showing how different types of systems are distributed across different regions in the world, which type of exchange system and purpose of the system prevail the most, and which are less common, graphical statistical overview and data were entered (the main results of this description are shown in Appendix 1). Finally, using the Worldwide Database of Complementary Currency Systems, a statistical analysis was carried out to determine:
- whether the theoretical beliefs, sometimes the basis of the debate, are consistent with the quantitative approach; and
- because CCC is constantly growing, the existence of the possible relationship between Community Currency Systems and the country-level economic, social, and environmental factors, as well as the different aspects of the financial sector and money.
The outcome of this analysis is consistent with the existing affirmation that complementary currencies are particularly useful and a great help to people and businesses in times of crisis. In fact, many communities are implementing their own “complementary” currencies in the current economic crisis in an attempt to keep wealth in their area.
In the last few years, with the collapse of the global economy, there has been a revival of interest in the local economy and locally produced goods, with the United States and the United Kingdom showing particular enthusiasm, e.g. Berkshire Bank.2 This is also true for many European countries: alternative currencies are on the rise as the Eurozone crisis worsens. As the Eurozone crisis has worsened, the use of alternative tools has risen, for example in Greece where the deepening financial crisis has given rise to alternative trading mechanisms and developed a situation where several instruments could become more and more popular.
Economists have kept an eye on the WIR, the Swiss complementary currency, since it started in 1934. When there is an economic upturn, the turnover in WIR goes down. When business people are unable to sell their goods in Swiss Francs, they go into the WIR, and in the present economic climate, people are much keener on these types of solutions. Similar projects comparable to the WIR are ongoing in Germany, France, and other countries.
Regarding socio-demographic characteristics, empirical analysis shows that CCCs tend to prevail in countries with a high population and a poor social welfare system. In countries with a high population, they are more likely to be adopted by people for reasons of proactivity, ideological sensitivity, or economic needs inclined to experiment and implement complementary community tools. In addition, larger countries have more needs, which means more businesses, more consultation, more transactions, more people looking for credit, etc. As regards the outcome on the social welfare system, it is quite logical that these tools we are looking at are more stimulating where there are less social insurance benefits.
The indicators of new businesses registered positively with CCC experiences. It follows that the positive relationship of CCC experiences with indicators of new business density shows that encouraging environmental factors (i.e. less bureaucracy, lower taxes, etc.) promotes the development of CCC.
Community currencies can also play a role in better assessment of environmental resources (e.g. the Belgian e-Portemonnee that encourages businesses to adopt more environmentally friendly practices). Increasing CO2 emissions are blamed for global climate change. The positive and optimistic results of the analysis showed that there is a higher incentive to create something that encourages sustainable behavior where there are CO2 emissions.
It is shown in Appendix 1 that electronic transactions are a dominant medium of exchange in CCC, to which the expected result of a positive relationship with CCC Internet technologies was confirmed by the empirical analysis.
Interesting results were derived also in relation to monetary indicators and finance, i.e. the indicator of domestic credit to private sector move in contrast to CCC development. This result is fully consistent with the evidence discussed in this work. There are multiple types of CCCs based on a mutual credit system that are activated especially during credit constraints. An example of a business-to-business system is the Commercial Credit Circuit (C3) network. This is a technology that provides substantial liquidity at very low cost into the entire SME network. In this way the model provides transmission inside of networks from clients to suppliers and businesses increase their access to short-term credit as needed to improve their working capital and the use of their productive capacity. Since the liquidity, cash, and working capital are keys to the survival and growth of any company, it is essential that suppliers are paid immediately, injecting a considerable amount of liquidity at a very low cost in the SME network.
Finally, the evidence on money and quasi money indicators, consistent with the conceptual framework described in Part 1, confirm that these tools are “complementary” because they are operating as complements to conventional national currencies.
Financial globalization suggests that during non-crisis times, it is more convenient for market participants to use flat money rather than alternative means. Meanwhile, the community tools are an excellent remedy during economic recession. They support local business cycles and create social wealth.
Appendix 1
The initial design was as a local moneyless not-for-profit exchange which had similarity with the Local Exchange Trading System (LETS) that evolved into a more complex Internet-based trading global network, allowing its promoters to extend it to other regions/continents. In fact, the Community Exchange System is one of the main typologies present in South Africa, Australia, New Zealand, and Poland. Figure 3.9 shows the worldwide growth of complementary currency systems.
“Venezuela’s barter systems are unique among contemporary CCC in that the initiative for their creation was taken at the highest political level by President Chávez himself” Dittmer (2011) noted. Chávez (2005) said: “[barter currencies] will be in the hands and soul of the people with its good judgment; they will be the system, the communities.”
Observing the medium of exchange distribution, we can note that communities use the advantages of new information technologies, giving preference to “electronic transaction” (see figure 3.10). It is more evident for the United States, Canada, Belgium, and Australia and conversely for Germany, where “Notes/Bills” are the most frequent medium of exchange.
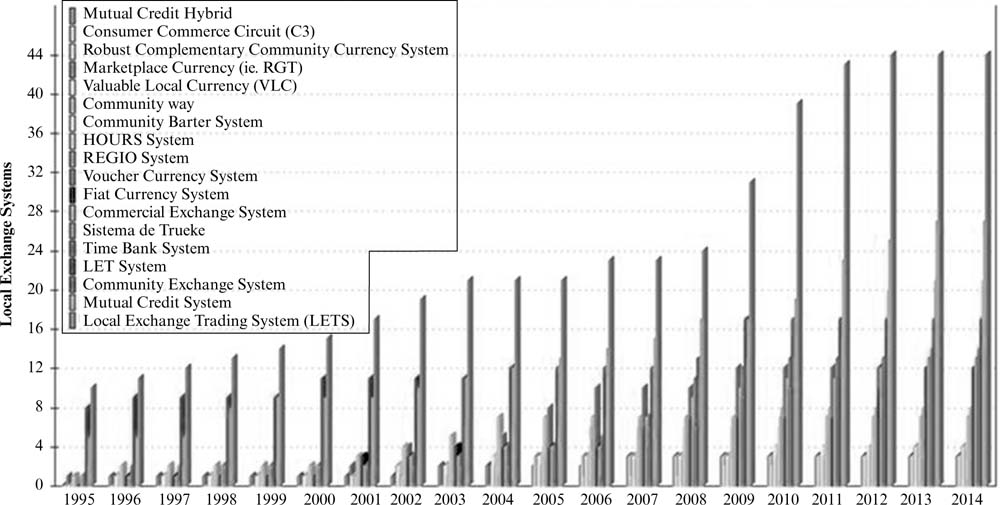
Figure 3.9: Type of exchange system, annual growth
Source: Database of Complementary Currencies Worldwide: http://www.complementarycurrency.org
Figure 3.11 shows that in relative terms “medium of exchange” has the following distribution: Electronic transaction, 19.5%; Notes/Bills, 15.2%; Accounts, 10.5%, Electronic transaction using CES software, 7%; Accounts + Notes, 5.1%.
As for the variety of purposes and the relative world distribution of the most important of them – cooperation, poverty alleviation, environmental conservation, promoting a stable and sustainable economy, economic justice, create a new market, etc. – the multiple category “all reasons” makes up 49.4 percent, “contributing towards a sustainable society” 12 percent, “community development” 8 percent, and “activating the local market” 5.6 percent.

Figure 3.10: Type of exchange system (relative distribution)
Source: Database of Complementary Currencies Worldwide: http://www.complementarycurrency.org
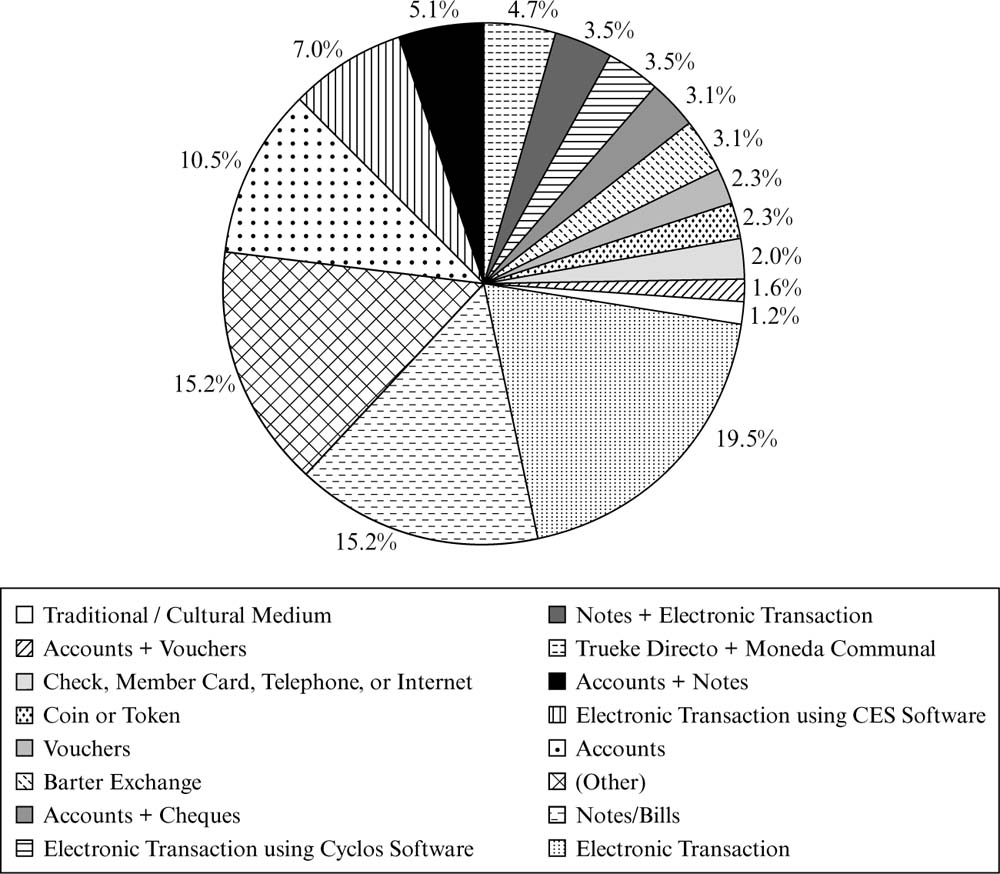
Figure 3.11: Medium of exchange (relative distribution)
Source: Database of Complementary Currencies Worldwide: http://www.complementarycurrency.org
Appendix 2: Methodology
This model extends the linear modeling framework to variables that are not normally distributed. Poisson regression is often used for modeling count data. The GLM generalizes linear regression and allows the linear model to be related to the response variable via a link function. The log link function was applied for the Poisson regression. The model is:
log(μ) = β0 + β1x1 + . . . + βpxp,
where μ is the count and log( ) defines the link function. This model also allows the magnitude of the variance of each measurement to be a function of its predicted value. Appendix 3 contains more detailed statistical information. There it is possible to consult: a list of goodness of fit statistics, Poisson regression coefficients for each of the variables along with standard errors, Wald χ2 statistics and intervals, and p-values for the coefficients, etc. In addition, according to a test of the model form we provided to check if the Poisson model form fit our data, we demonstrate that the model fits reasonably well.
Description of the data
After an analysis was performed, we found very interesting significant variables. Tables 3.1 and 3.2 show summary statistics (Mean, Std Dev, Sum, Minimum, Maximum).
The variables were grouped together because they should be seen together. As debt levels rise, risk premia begin to rise sharply, faced with highly indebted governments. As Reinhart and Rogoff (2009) highlight, countries that choose to rely excessively on short-term borrowing to fund growing debt levels are particularly vulnerable to crises.
Table 3.1 Summary statistics
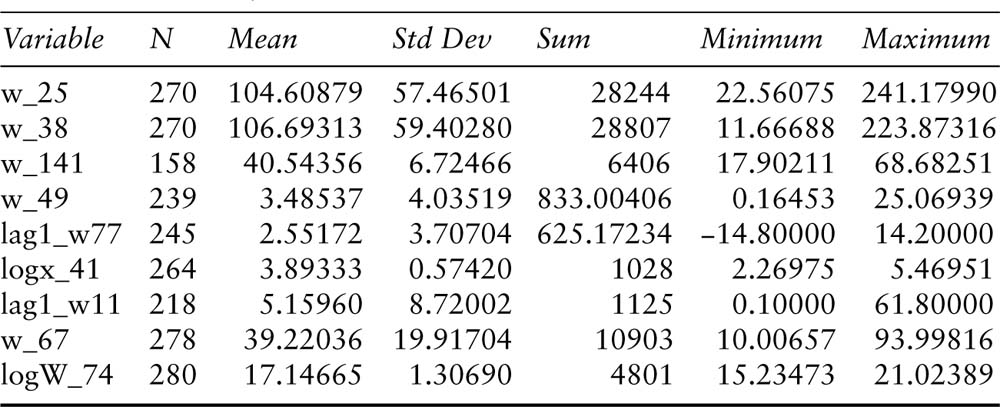
| Variable | Definition |
| w_25 | Money and quasi money (M2) as % of GDP |
| w_38 | Domestic credit to private sector (% of GDP) |
| w_141 | Tertiary education, teachers (% female) |
| w_49 | New business density (new registrations per 1,000 people ages 15–64) |
| lag1_w77 | LOG GDP growth (annual %) T–1 |
| logx_41 | Log General government gross debt |
| lag1_w11 | Bank nonperforming loans to total gross loans (%) T–1 |
| w_67 | Exports of goods and services (% of GDP) |
| logW_74 | LOG Population (Total) |
Table 3.2 Summary statistics

| Variable | Definition |
| w_36 | Risk premium on lending (lending rate minus treasury bill rate, %) |
| w_118 | CO2 emissions (metric tons per capita) |
| w_131 | Social contributions (% of revenue) |
| w_64 | Secure Internet servers |
| x_31 | Government total expenditure% GDP |
| x_33 | Government net lending/borrowing |
Appendix 3: Statistical analysis
In this work, the generalized linear model has been applied. The Poisson distributions are a discrete family with a probability function indexed by the rate parameter μ > 0: if it takes integer values y = 0, 1, 2,. . . y! The expectation and variance of a Poisson random variable are both equal to μ. The Poisson distribution is useful for modeling count data. As μ increases, the Poisson distribution grows more symmetric and is eventually well approximated by a normal distribution.
On the class statement we have two categorical variables: year and country (year key_code). We use the type3 option in the model statement as it is used to get the multi-degree-of-freedom test of the categorical variables listed (year key_code).
To help assess the fit of the model, we use the χ2 goodness-of-fit test. This assumes the deviance follows a χ2 distribution with degrees of freedom equal to the model residual. From the first line of our goodness of fit output, we can see these values are 54.9486 and 55:
p-value = 1 − probchi(χ2, d.f.);
d.f. = 55; χ2 = 54.9486;
p-value = 0.47659
This is a test of the model form: Does the Poisson model form fit our data?
We conclude that the model fits reasonably well because the goodness-of-fit χ2 test is not statistically significant. If the test had been statistically significant, it would indicate that the data do not fit the model well. In that situation, we may try to determine if there are omitted predictor variables, if our linearity assumption holds, and/or if there is an issue of over-dispersion.
References
- Blanc, J. (2011) Classifying CCs: Community, complementary and local currencies’ types and generations. International Journal of Community Currency Research 15, Special Issue, D4–10.
- Chávez, H. (2005) Aló Presidente. Televised broadcast, December.
- Database of Complementary Currencies Worldwide (2014) Available at: http://www.complementarycurrency.org/ccDatabase/les_public.html
- De Bondt, W. and Thaler, R. (1987) Further evidence on investor overreaction and stock market seasonality. The Journal of Finance 42, 3, 557–81.
- De Long, B.J., Shleifer, A., Summers, L.H. and Waldman, R.J. (1990) Noise trader risk in financial markets. Journal of Political Economy 98, 4, 703–38.
- Derudder, P. (2011) Cahier d’éspérance richesses et monnaies. Monnaie en débat.
- Dittmer, K. (2011) Communal currencies in Venezuela. International Journal of Community Currency Research 15, Section A, 78–83.
- Goerner, S., Lietaer, B. and Ulanowicz, R.E. (2009) Quantifying economic sustainability: Implications for free-enterprise theory, policy and practice. Ecological Economics 69, 1, 76–81.
- Greco, T.H. (1994) New Money for Healthy Communities. Greco Pub., Tucson, AZ.
- Holling, C.S. (1986) The resilience of terrestrial ecosystems: Local surprise and global change. In: Clark, W.C. and Munn, R.E. (eds.) Sustainable Development of the Biosphere. Cambridge University Press, London, pp. 292–317.
- Kash, J.A., Friedman, E.J. and Halpern, J.Y. (2007) Optimizing scrip systems: efficiency, crashes, hoarders, and altruists. Eighth ACM Conference on Electronic Commerce.
- Kennedy, M. and Lietaer, B. (2004) Regionalwährungen: Neue Wege zu nachhaltigem Wohlstand. Translated in French: Monnaies Régionales: de nouvelles voies vers une prospérité durable. Charles Léopold Mayer, Paris.
- Larcker, D.F. and Tayan, B. (2014) Corporate governance according to Charles T. Munger. Stanford Closer Look Series. Available at: https://www.gsb.stanford.edu/sites/default/files/38_Munger_0.pdf
- Lietaer, B., Ulanowicz, R.E., Goerner, S.J. and McLaren, N. (2010) Is our monetary structure a systemic cause for financial instability? Evidence and remedies from nature. Journal of Futures Studies 14, 89–108.
- Martignoni, J. (2012) A new approach to a typology of complementary currencies. International Journal of Community Currency Research 16, Section A, 1–17.
- May, R.M. (1972) Will a large complex system be stable? Nature 238, 413–14.
- Reinhart, C. and Rogoff, K. (2009) This Time Is Different. Eight Centuries of Financial Folly. Princeton University Press, Princeton, NJ.
- Schroeder, R.F.H., Miyazaki, Y. and Fare, M. (2011) Community currency research: An analysis of the literature. International Journal of Community Currency Research 15, Section A, 31–41.
- Thaler, R. (1999) The end of behavioral finance. Financial Analysts Journal 55, 6, 12–17.
- Western Australia Government (1990) LETSystems Training Pack. Community Development Branch, Department of State Development.
- WIR Bank (1934) WIR Economic Circle Cooperative, Wirtschaftsring-Genossenschaft. Available at: http://www.wir.ch/
- Zorach, A.C. and Ulanowicz, R.E. (2003) Quantifying the complexity of flow networks: How many roles are there? Complexity 8, 3, 68–76.